Ancestry Specific Quality Control
This page will outline the quality control procedure to be carried out within each super population.
1 Remove population outliers
Here will remove individuals that are population outliers which could bias downstream analysis. We will do by performing PCA within each population, and use distance from population centroids across 10PCs.
Show code
# Make a file listing the UKB keep files
ls /scratch/groups/ukbiobank/usr/ollie_pain/ReQC/defining_ancestry/UKBB.Ancestry.model_pred.*.keep > /scratch/groups/ukbiobank/usr/ollie_pain/ReQC/defining_ancestry/UKBB.Ancestry.model_pred.keep_list

sbatch -p brc,shared --mem=20G /users/k1806347/brc_scratch/Software/Rscript_singularity.sh /users/k1806347/brc_scratch/Software/MyGit/GenoPred/Scripts/Population_outlier/Population_outlier.R \
  --target_plink /scratch/datasets/ukbiobank/June2017/Genotypes/ukb_binary_v2 \
  --target_fam /scratch/groups/ukbiobank/usr/ollie_pain/ReQC/fake_fam.fam \
  --target_keep /scratch/groups/ukbiobank/usr/ollie_pain/ReQC/defining_ancestry/UKBB.Ancestry.model_pred.keep_list \
  --n_pcs 10 \
  --maf 0.05 \
  --geno 0.02 \
  --hwe 1e-6 \
  --memory 15000 \
  --plink /users/k1806347/brc_scratch/Software/plink1.9.sh \
  --plink2 /users/k1806347/brc_scratch/Software/plink2 \
  --output /scratch/groups/ukbiobank/usr/ollie_pain/ReQC/outlier_detection/UKBB.QC
1.1 Results
Show log file
## #################################################################
## # Population_outlier.R
## # For questions contact Oliver Pain (oliver.pain@kcl.ac.uk)
## #################################################################
## Analysis started at 2021-01-26 17:05:20
## Options are:
## Options are:
## $target_plink_chr
## [1] NA
##
## $target_plink
## [1] "/scratch/datasets/ukbiobank/June2017/Genotypes/ukb_binary_v2"
##
## $target_fam
## [1] "/scratch/groups/ukbiobank/usr/ollie_pain/ReQC/fake_fam.fam"
##
## $maf
## [1] 0.05
##
## $geno
## [1] 0.02
##
## $hwe
## [1] 1e-06
##
## $n_pcs
## [1] 10
##
## $plink
## [1] "/users/k1806347/brc_scratch/Software/plink1.9.sh"
##
## $plink2
## [1] "/users/k1806347/brc_scratch/Software/plink2"
##
## $target_keep
## [1] "/scratch/groups/ukbiobank/usr/ollie_pain/ReQC/defining_ancestry/UKBB.Ancestry.model_pred.keep_list"
##
## $output
## [1] "/scratch/groups/ukbiobank/usr/ollie_pain/ReQC/outlier_detection/UKBB.QC"
##
## $memory
## [1] 15000
##
## $help
## [1] FALSE
##
## $output_dir
## [1] "/scratch/groups/ukbiobank/usr/ollie_pain/ReQC/outlier_detection/"
##
## Analysis started at 2021-01-26 17:05:20
## Excluding long range LD...Done!
## QC qill be performed for AFR, AMR, EAS, EUR, SAS populations...
## ~~~~~~   AFR     ~~~~~~
## Done!
## Plotting target sample PCs...Done!
## Defining number of centroids...
## 9 centroids was found to fit best.
## 8003 out of 9127 remain.
## ~~~~~~~~~~~~~~~~~~~~~~~~~~~~~~
## ~~~~~~   AMR     ~~~~~~
## Done!
## Plotting target sample PCs...Done!
## Defining number of centroids...
## 2 centroids was found to fit best.
## 1980 out of 2033 remain.
## ~~~~~~~~~~~~~~~~~~~~~~~~~~~~~~
## ~~~~~~   EAS     ~~~~~~
## Done!
## Plotting target sample PCs...Done!
## Defining number of centroids...
## 2 centroids was found to fit best.
## 2540 out of 2654 remain.
## ~~~~~~~~~~~~~~~~~~~~~~~~~~~~~~
## ~~~~~~   EUR     ~~~~~~
## Done!
## Plotting target sample PCs...Done!
## Defining number of centroids...
## 2 centroids was found to fit best.
## 450393 out of 463275 remain.
## ~~~~~~~~~~~~~~~~~~~~~~~~~~~~~~
## ~~~~~~   SAS     ~~~~~~
## Done!
## Plotting target sample PCs...Done!
## Defining number of centroids...
## 2 centroids was found to fit best.
## 9852 out of 10569 remain.
## ~~~~~~~~~~~~~~~~~~~~~~~~~~~~~~
## Analysis finished at 2021-01-26 23:16:26
## Analysis duration was 6.18 hours
1.1.1 AFR
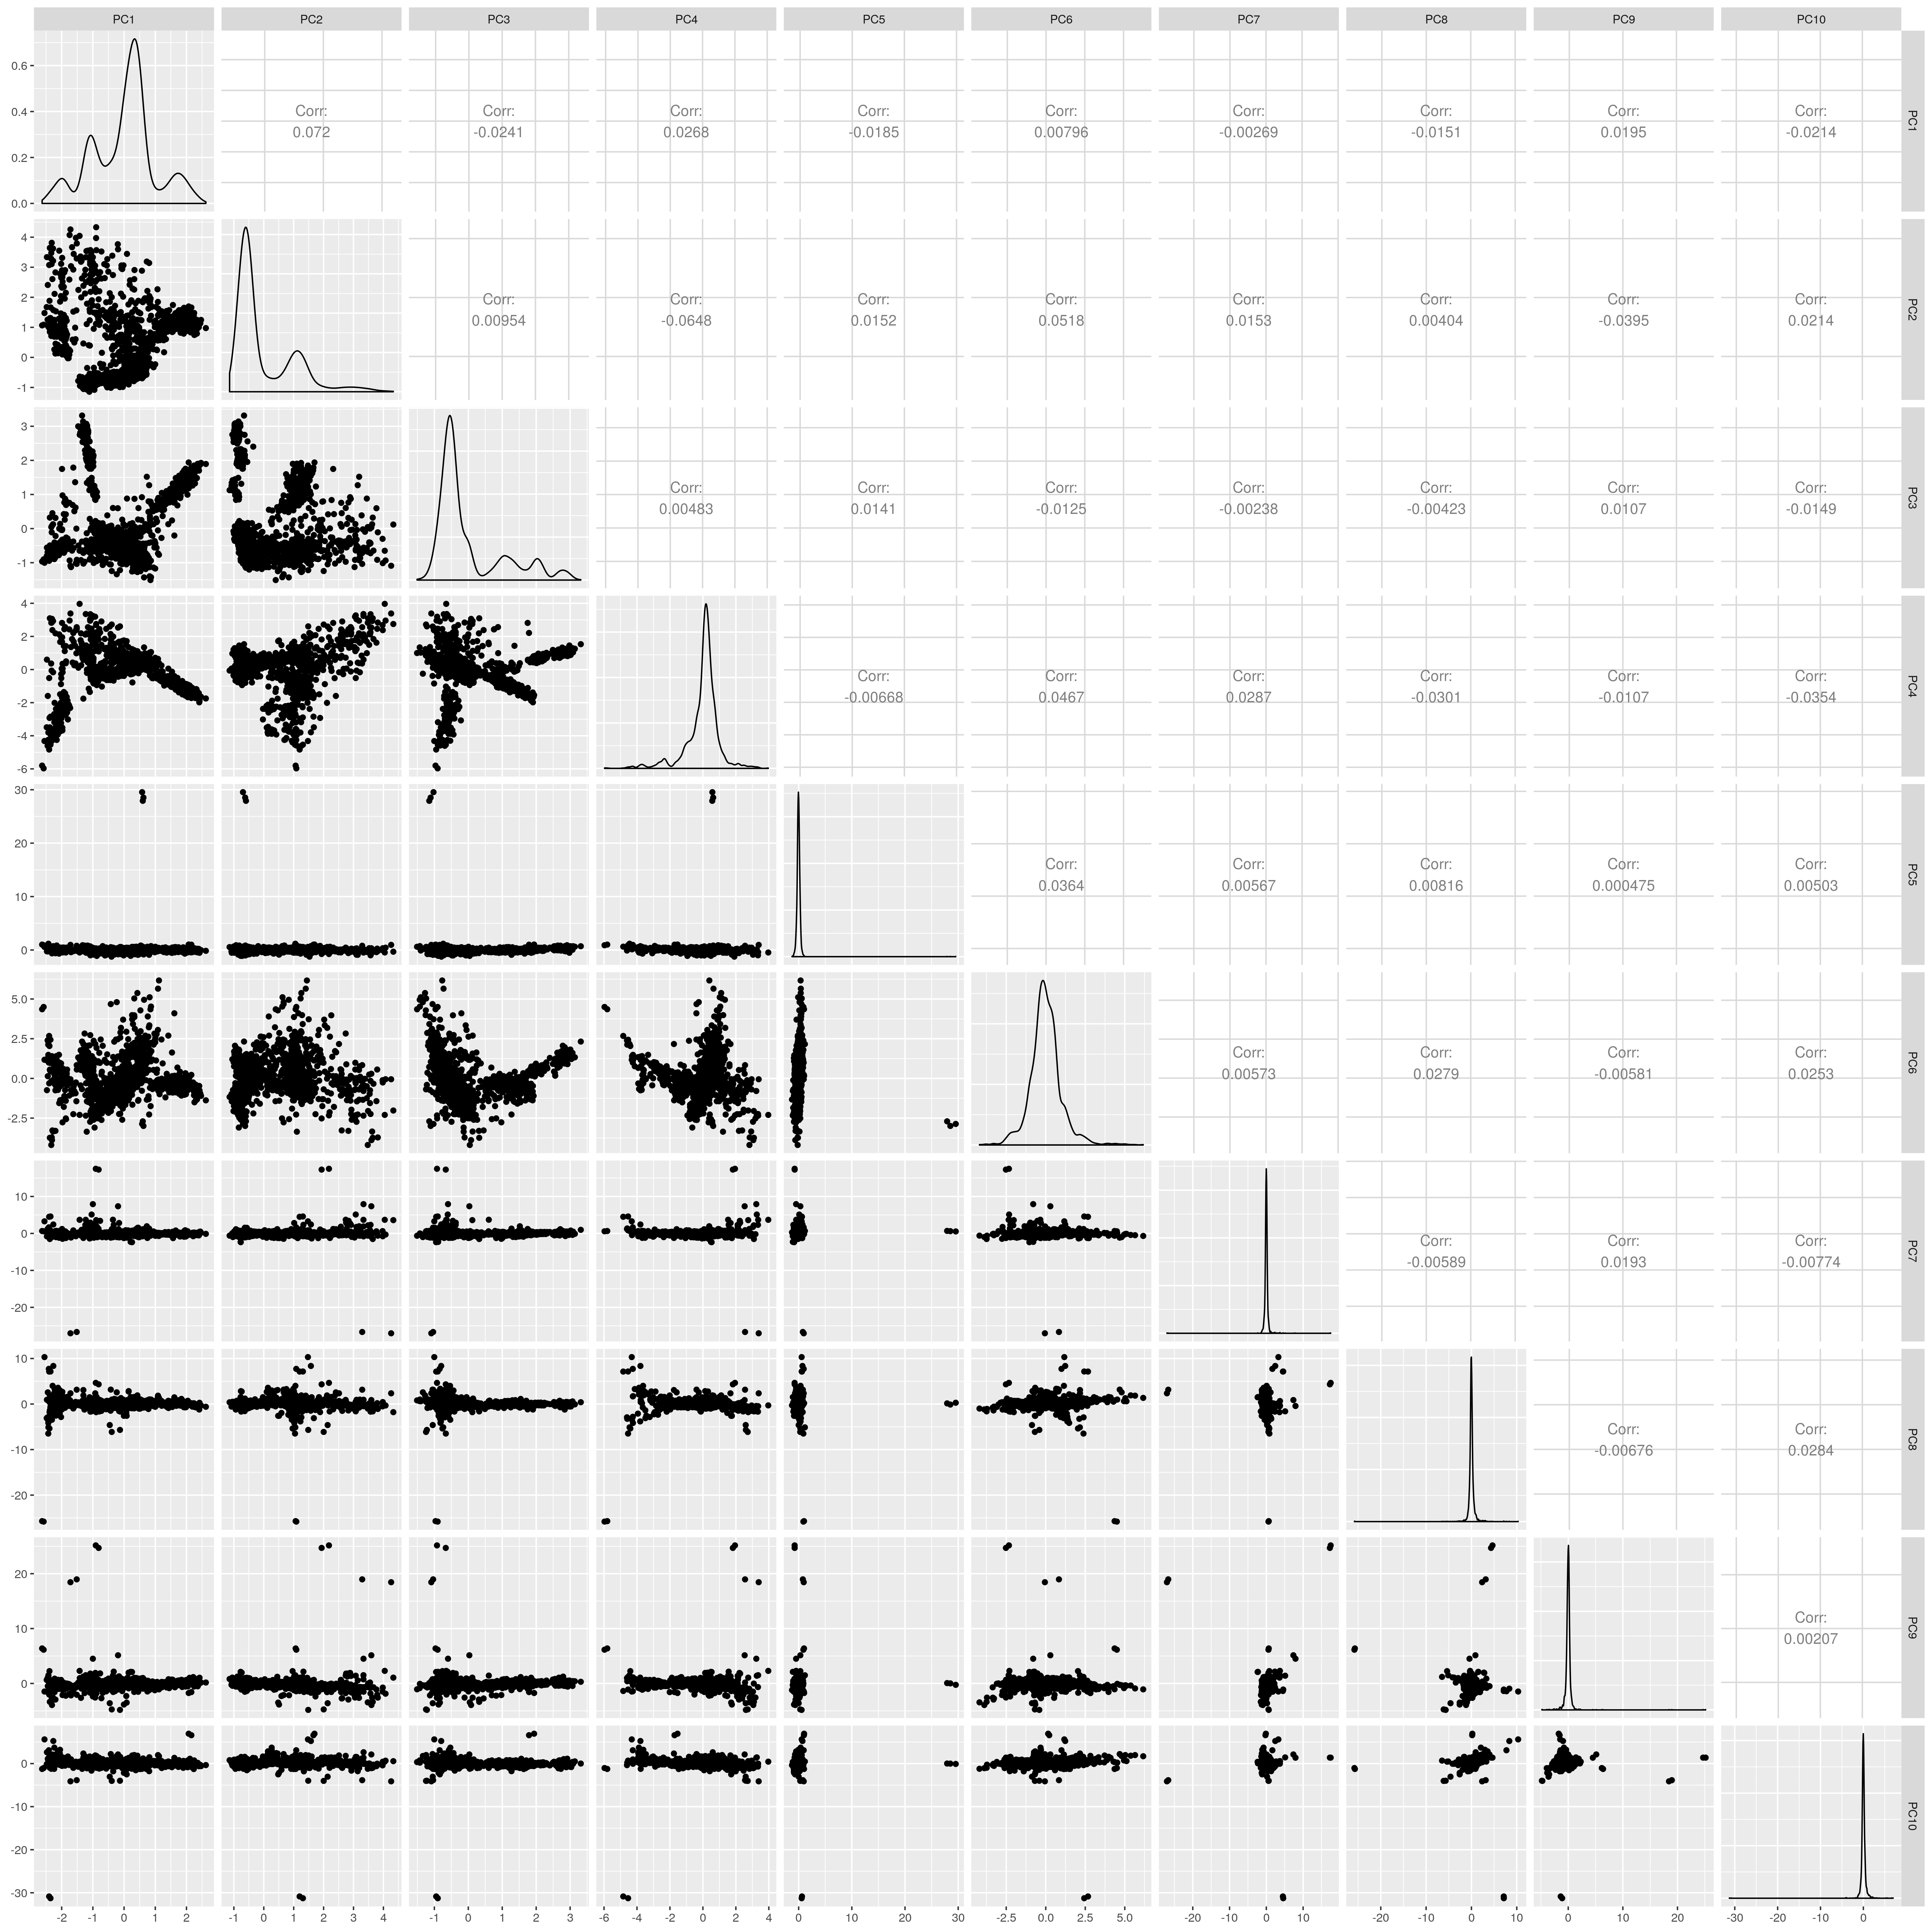
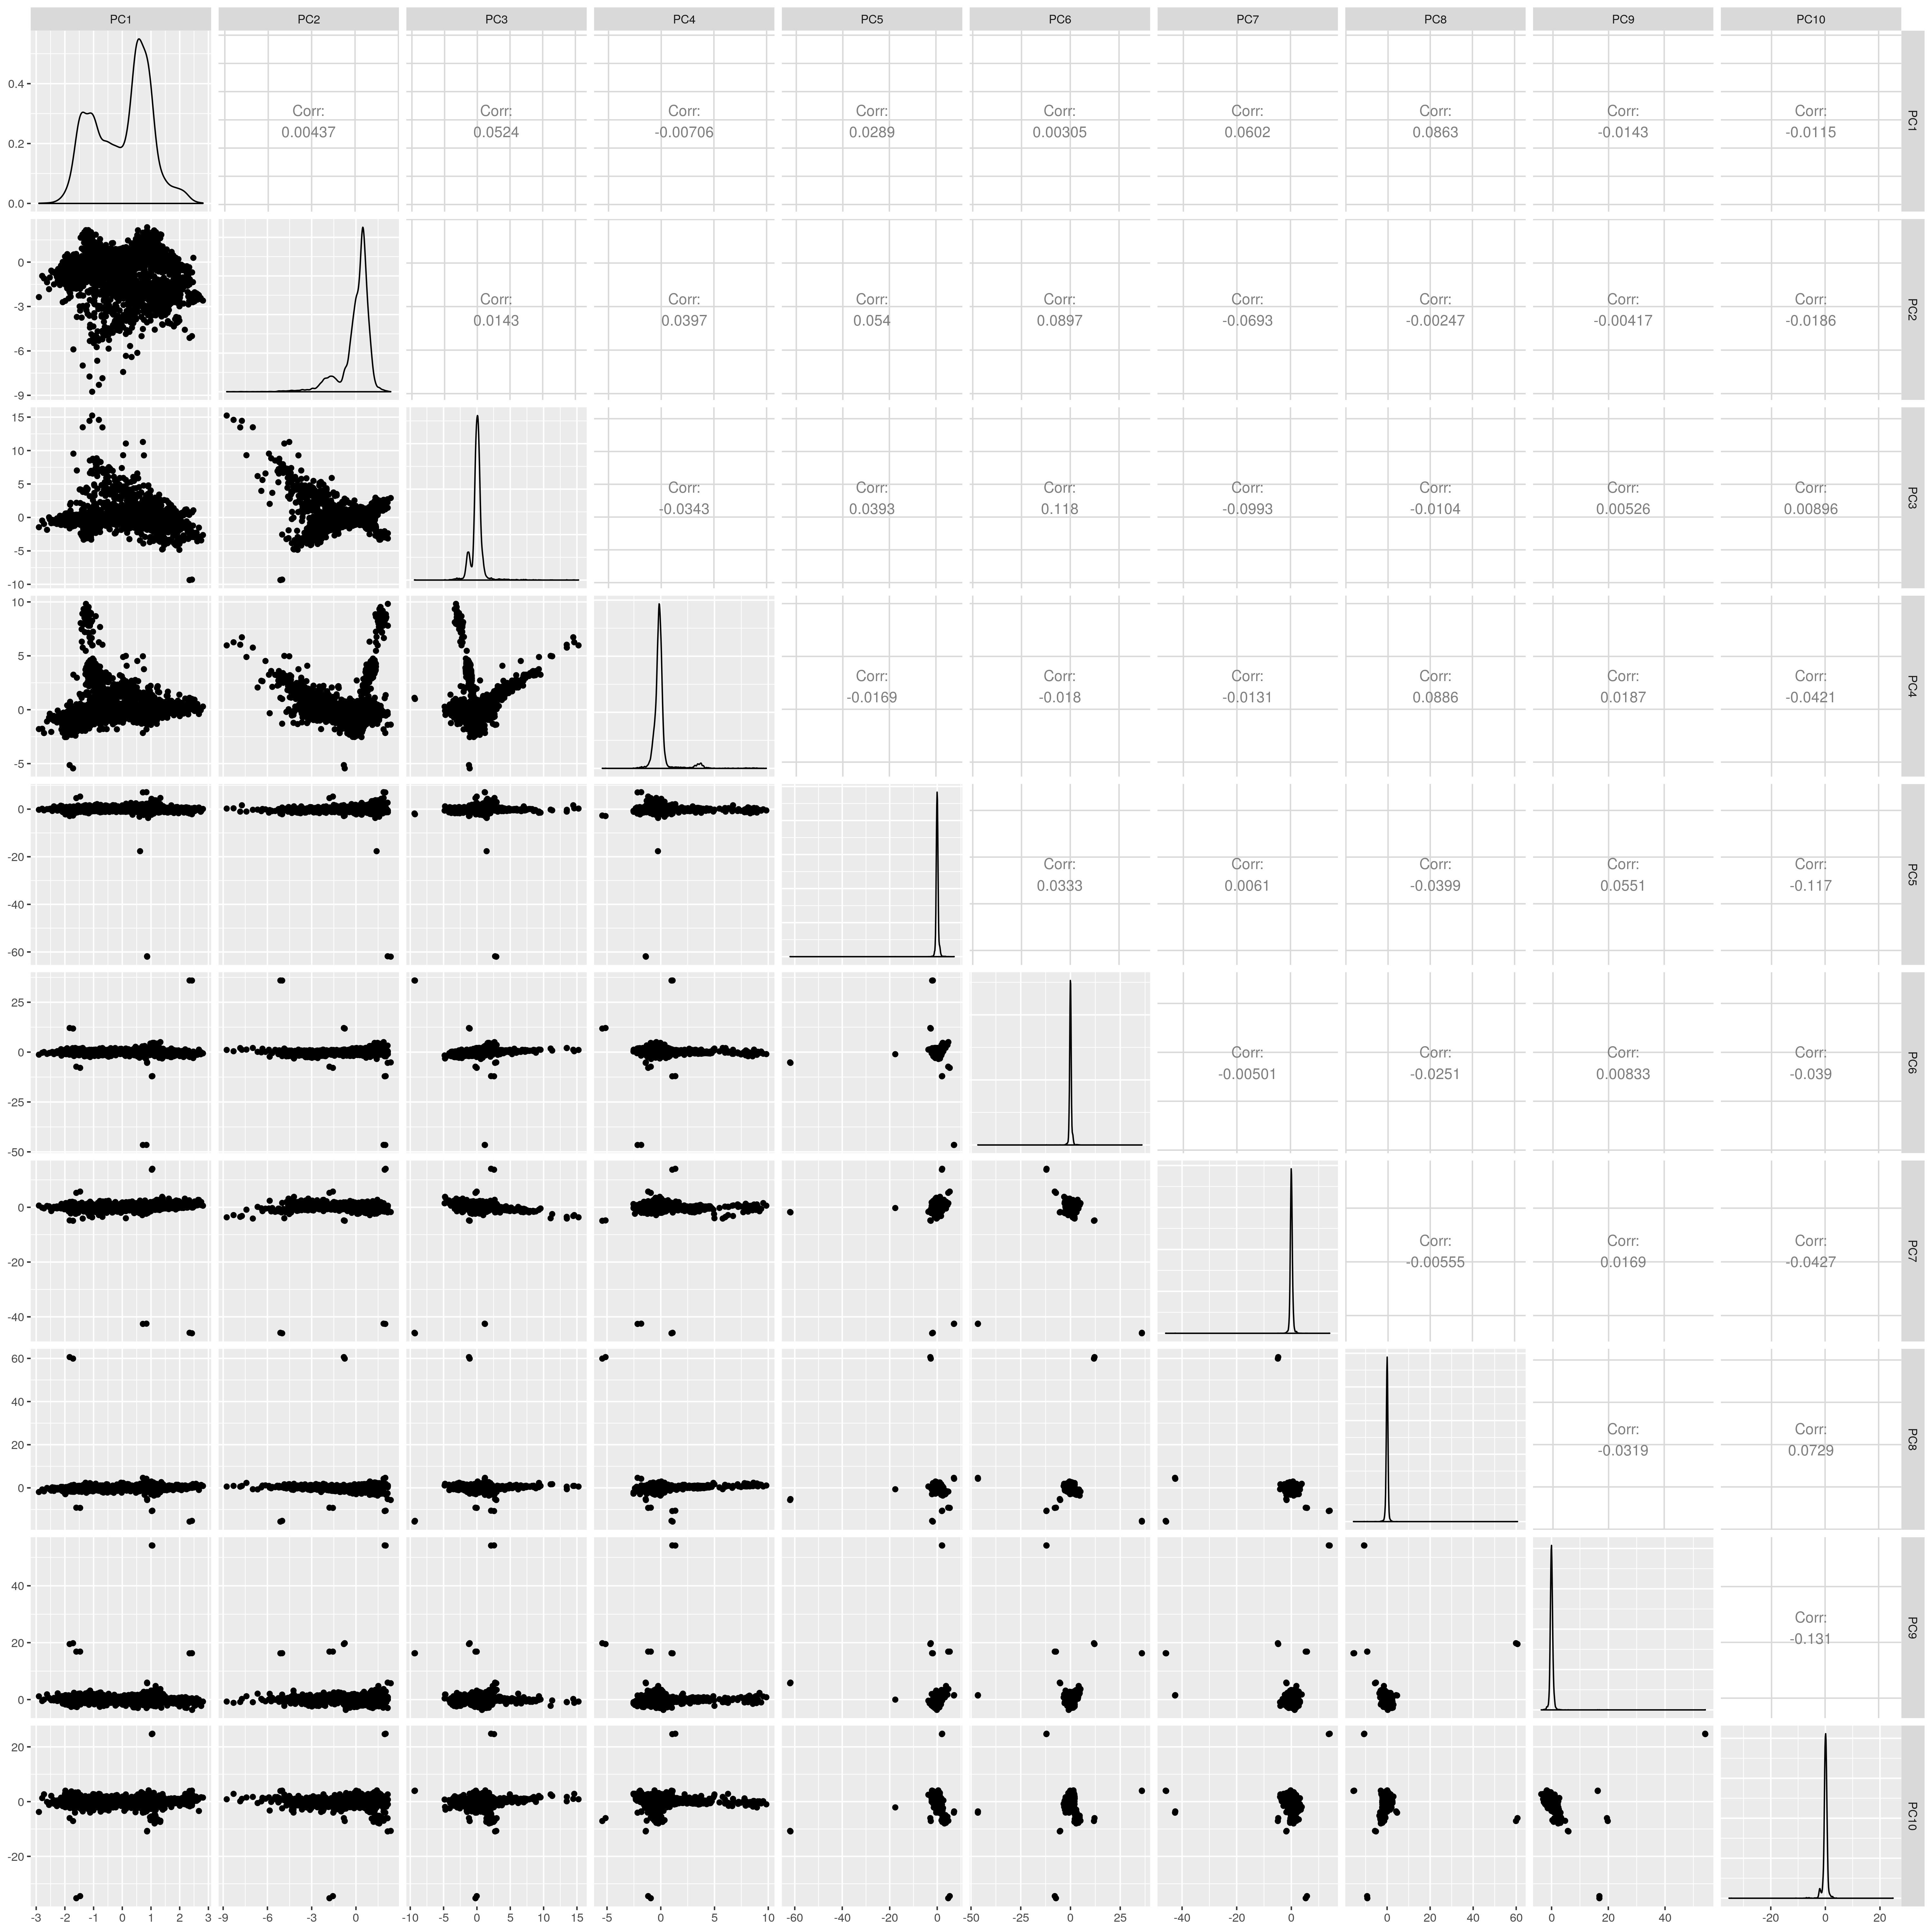
Show PCs before outlier removal
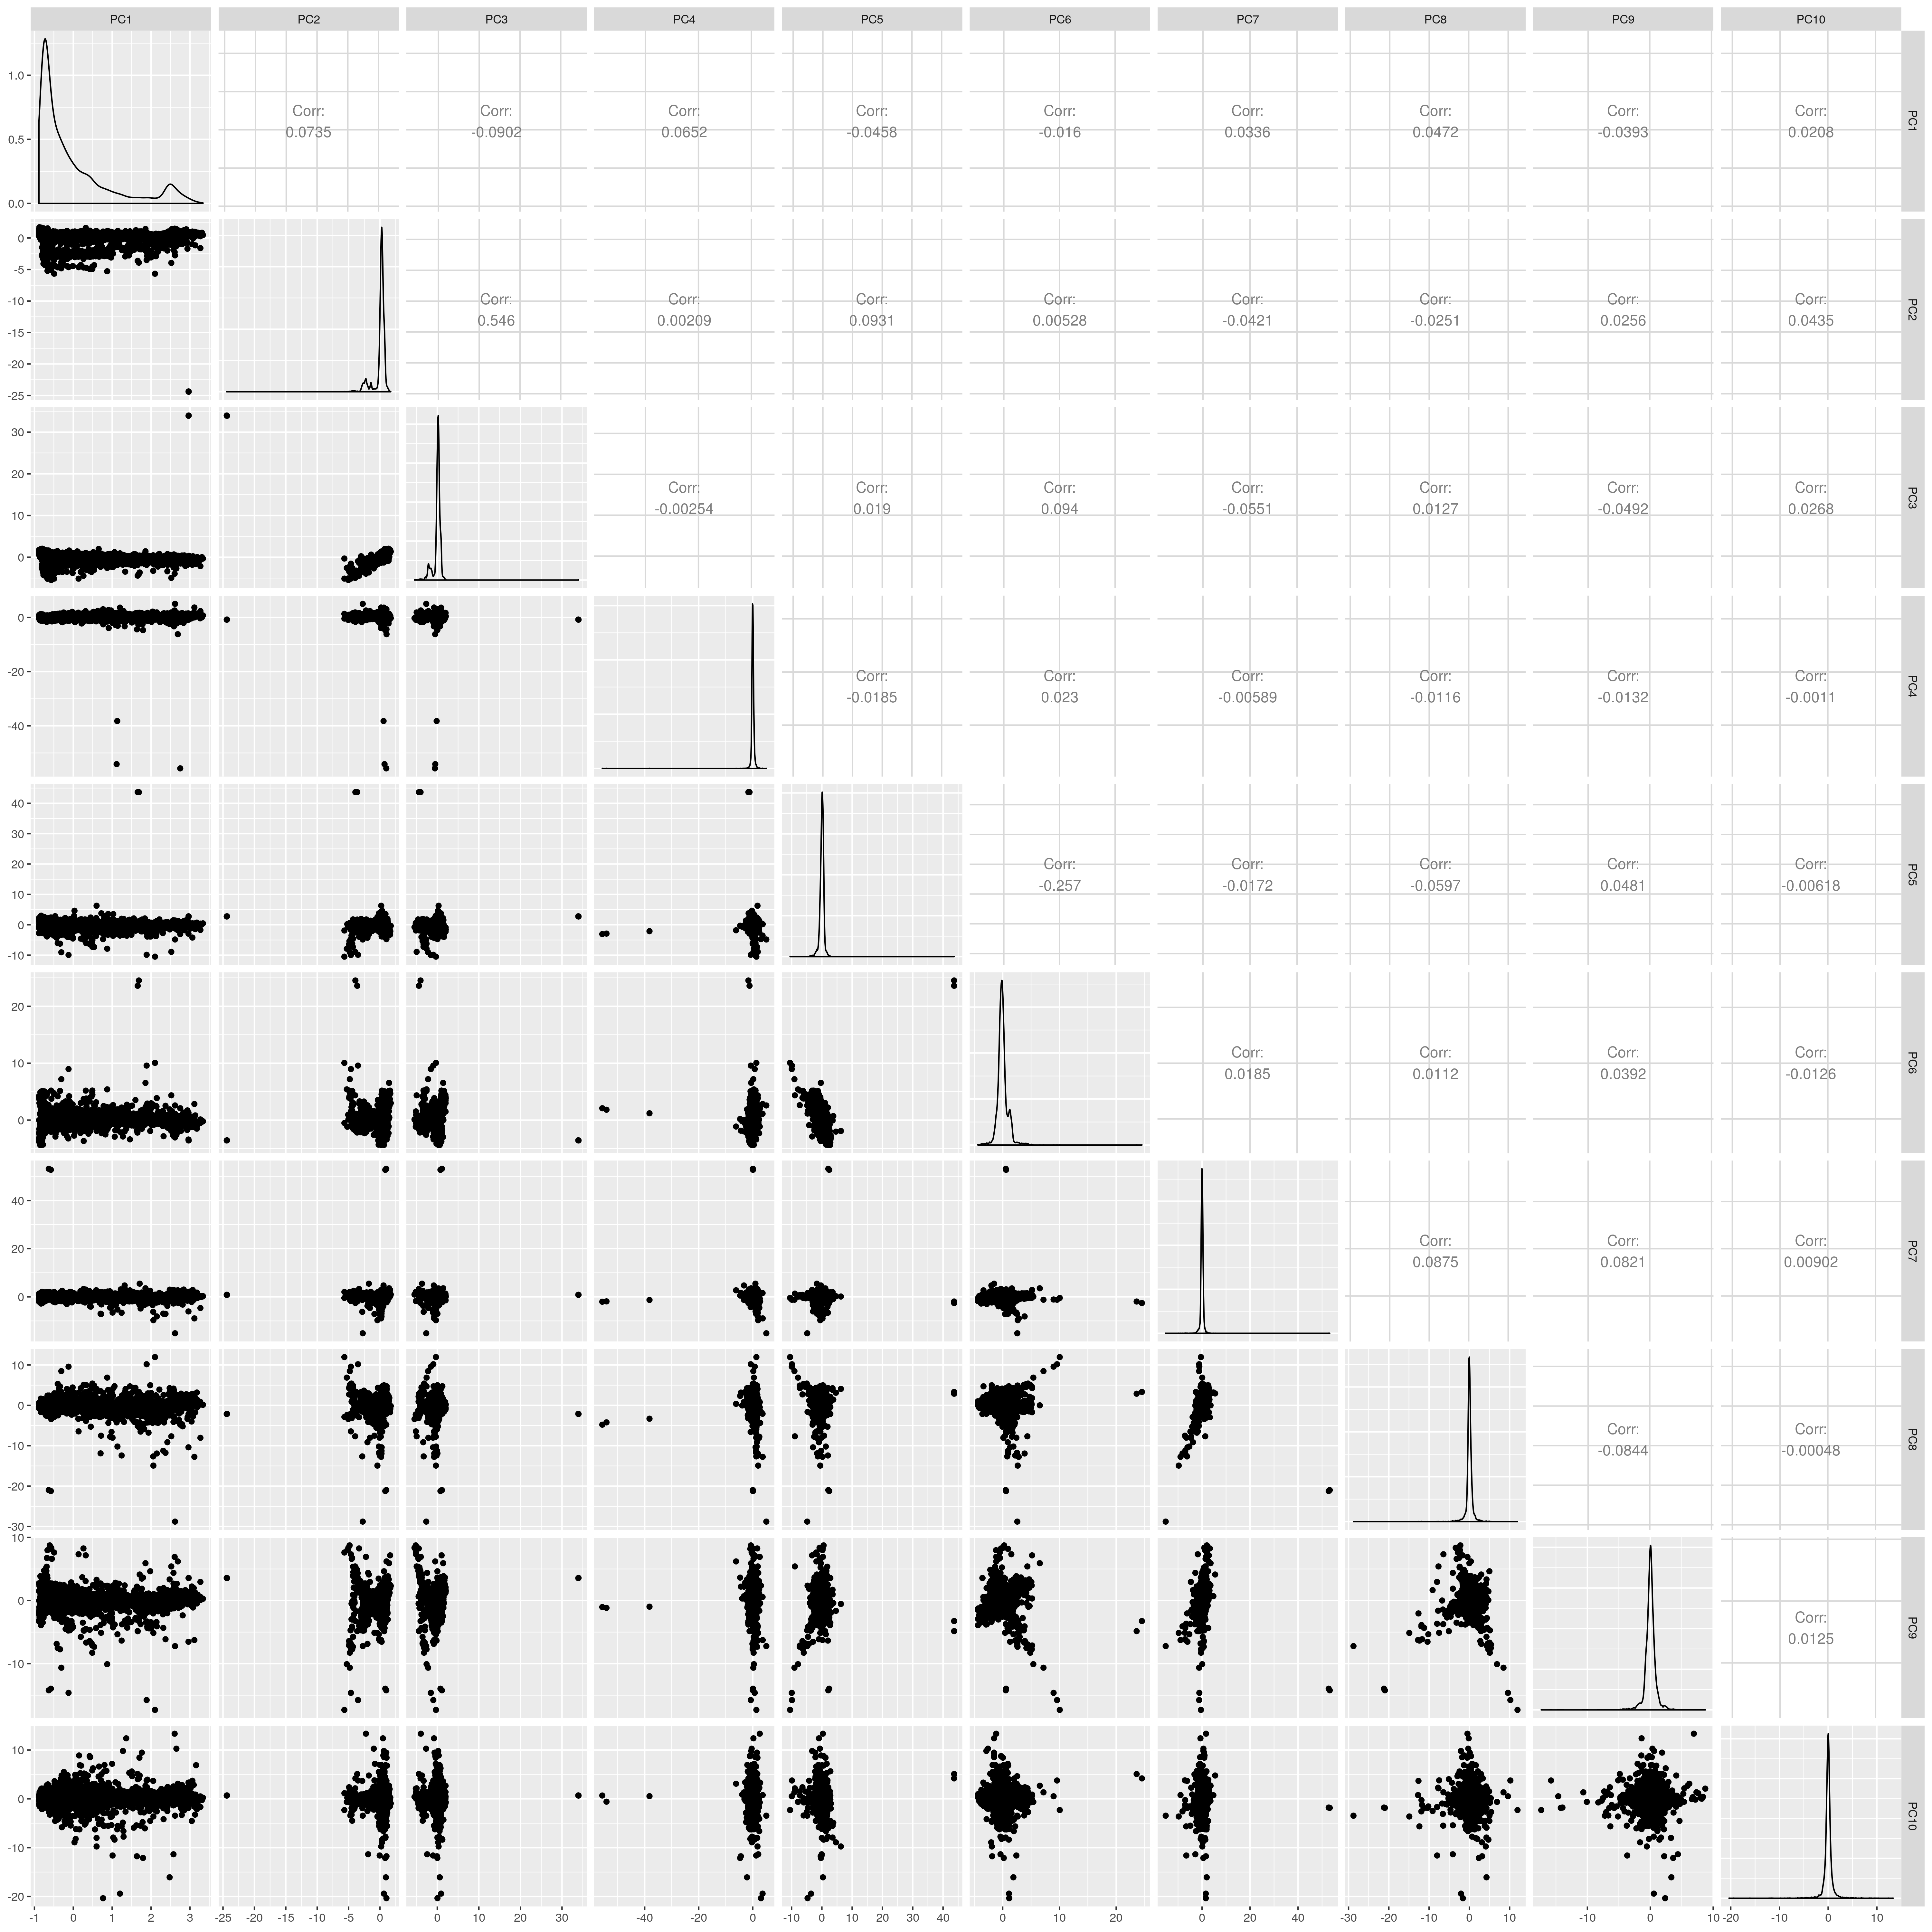
UKB AFR PCs before outlier removal
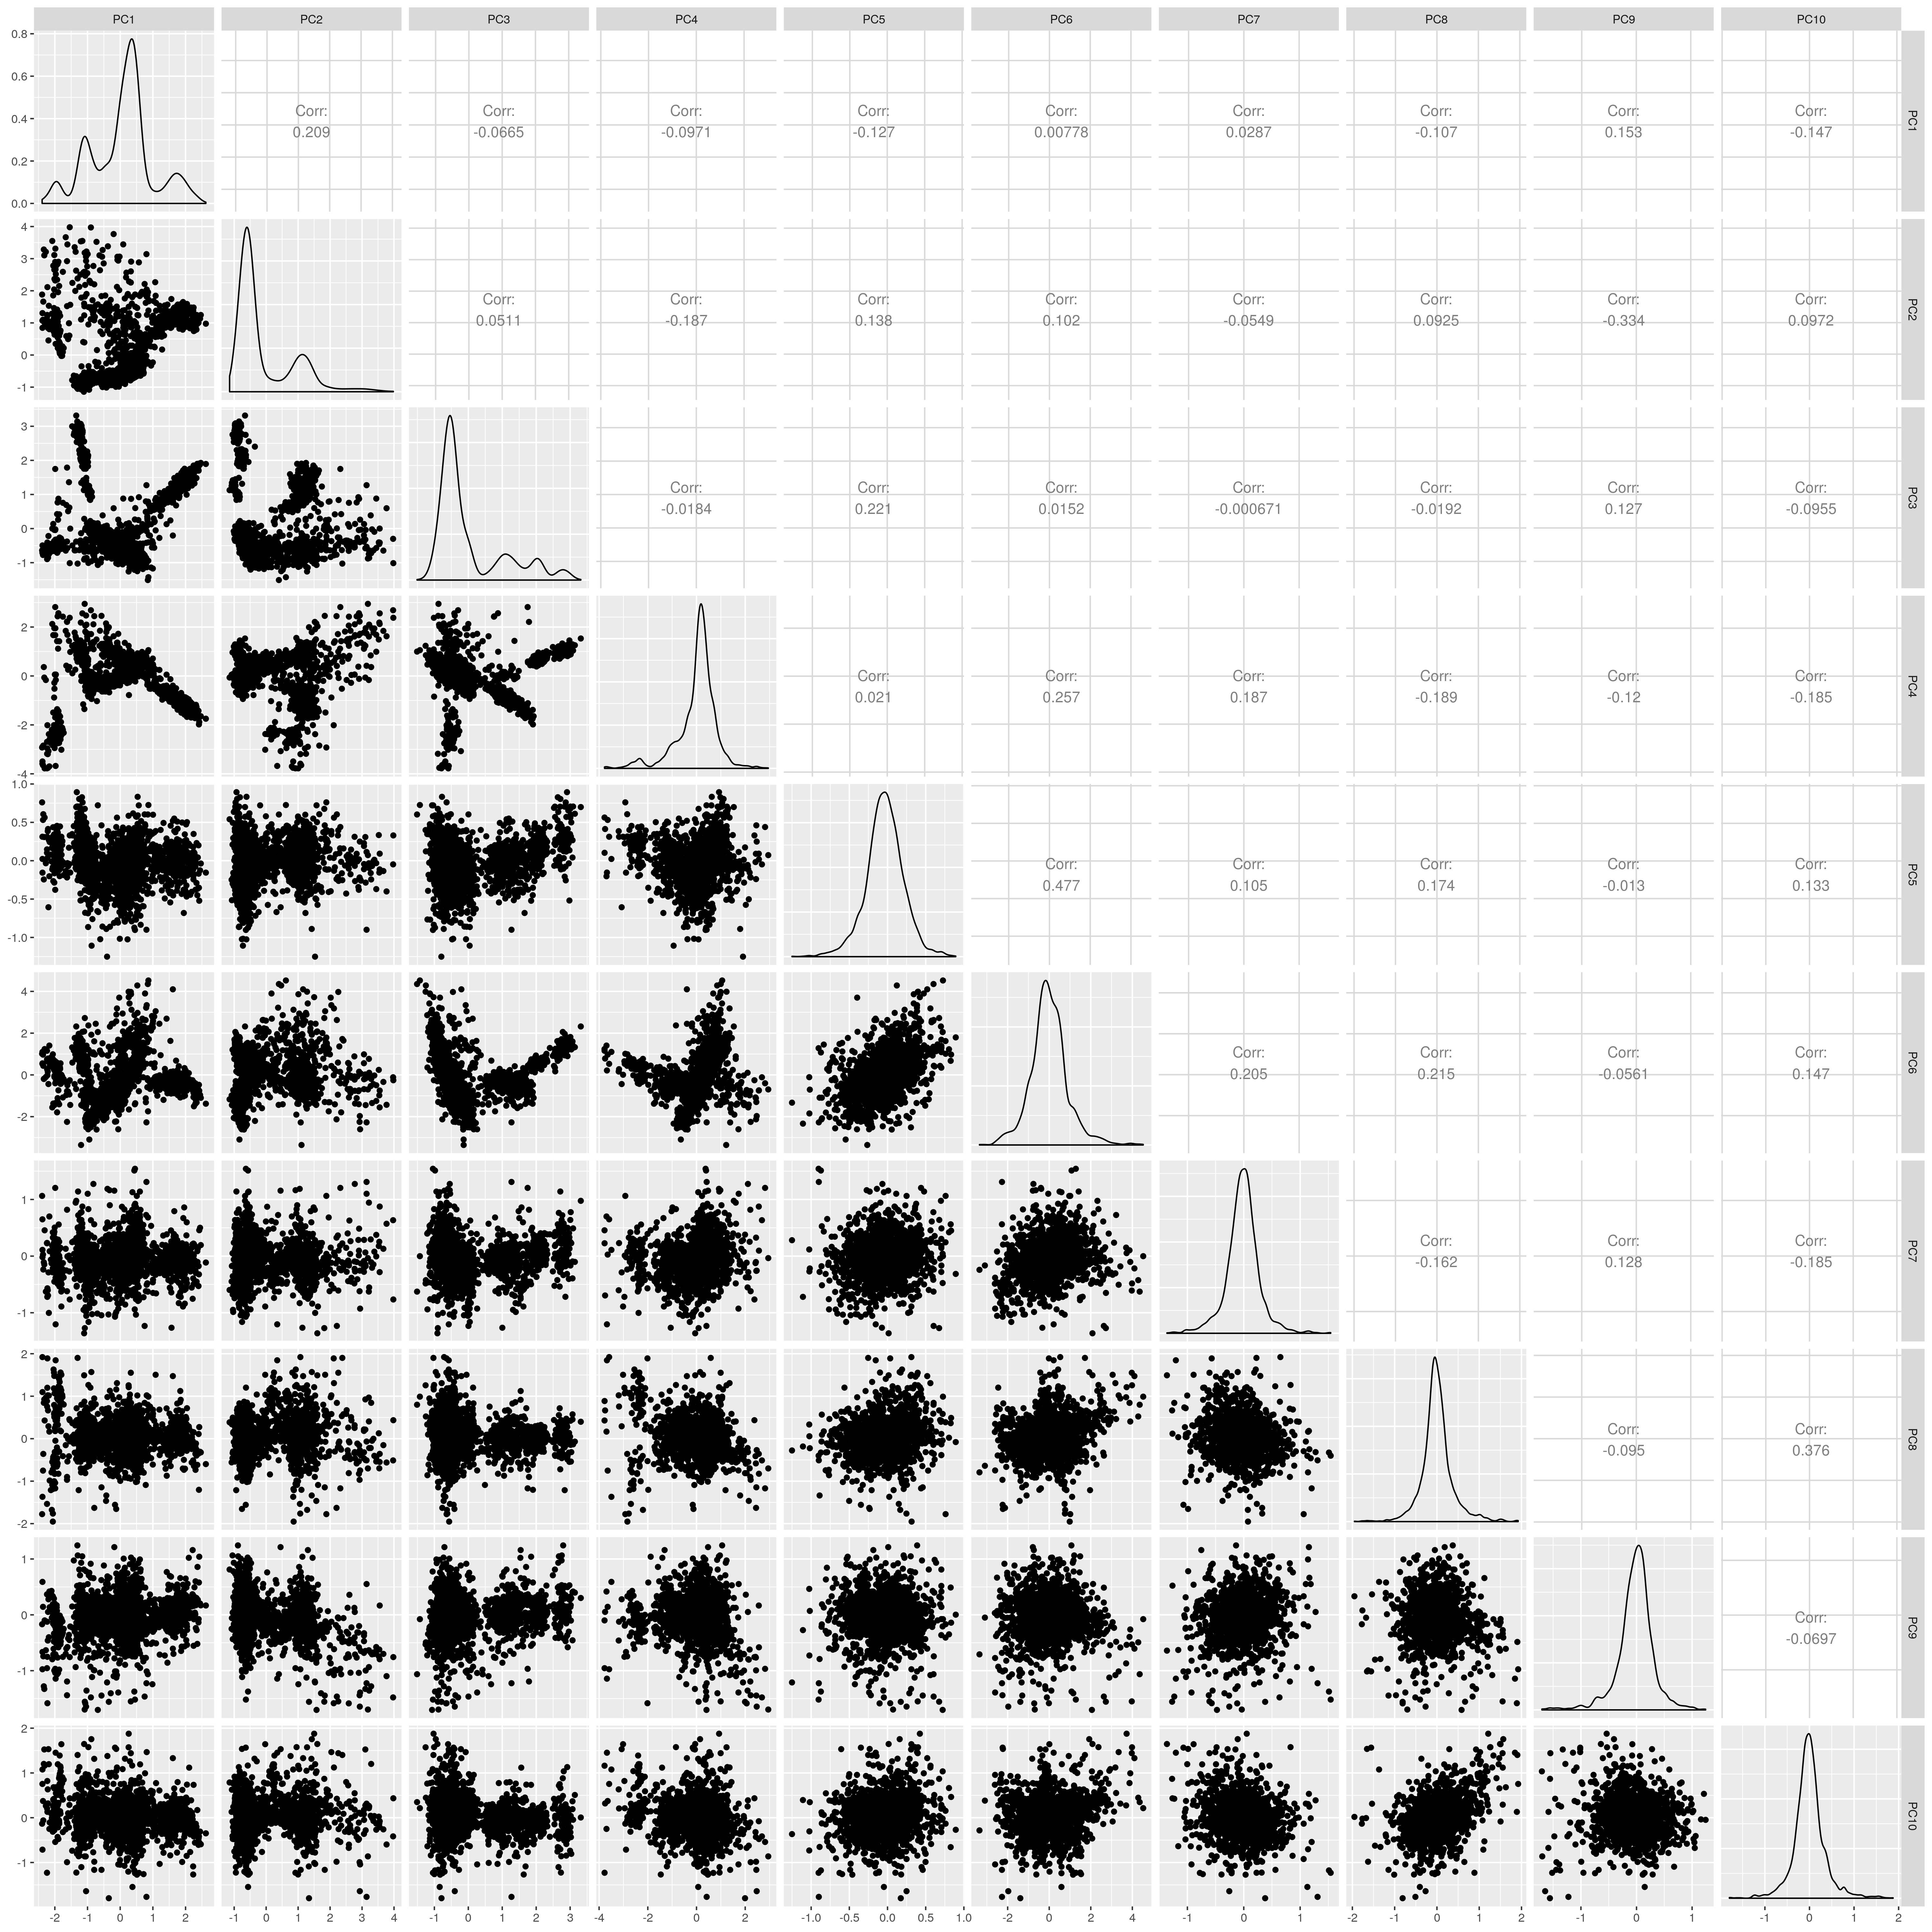
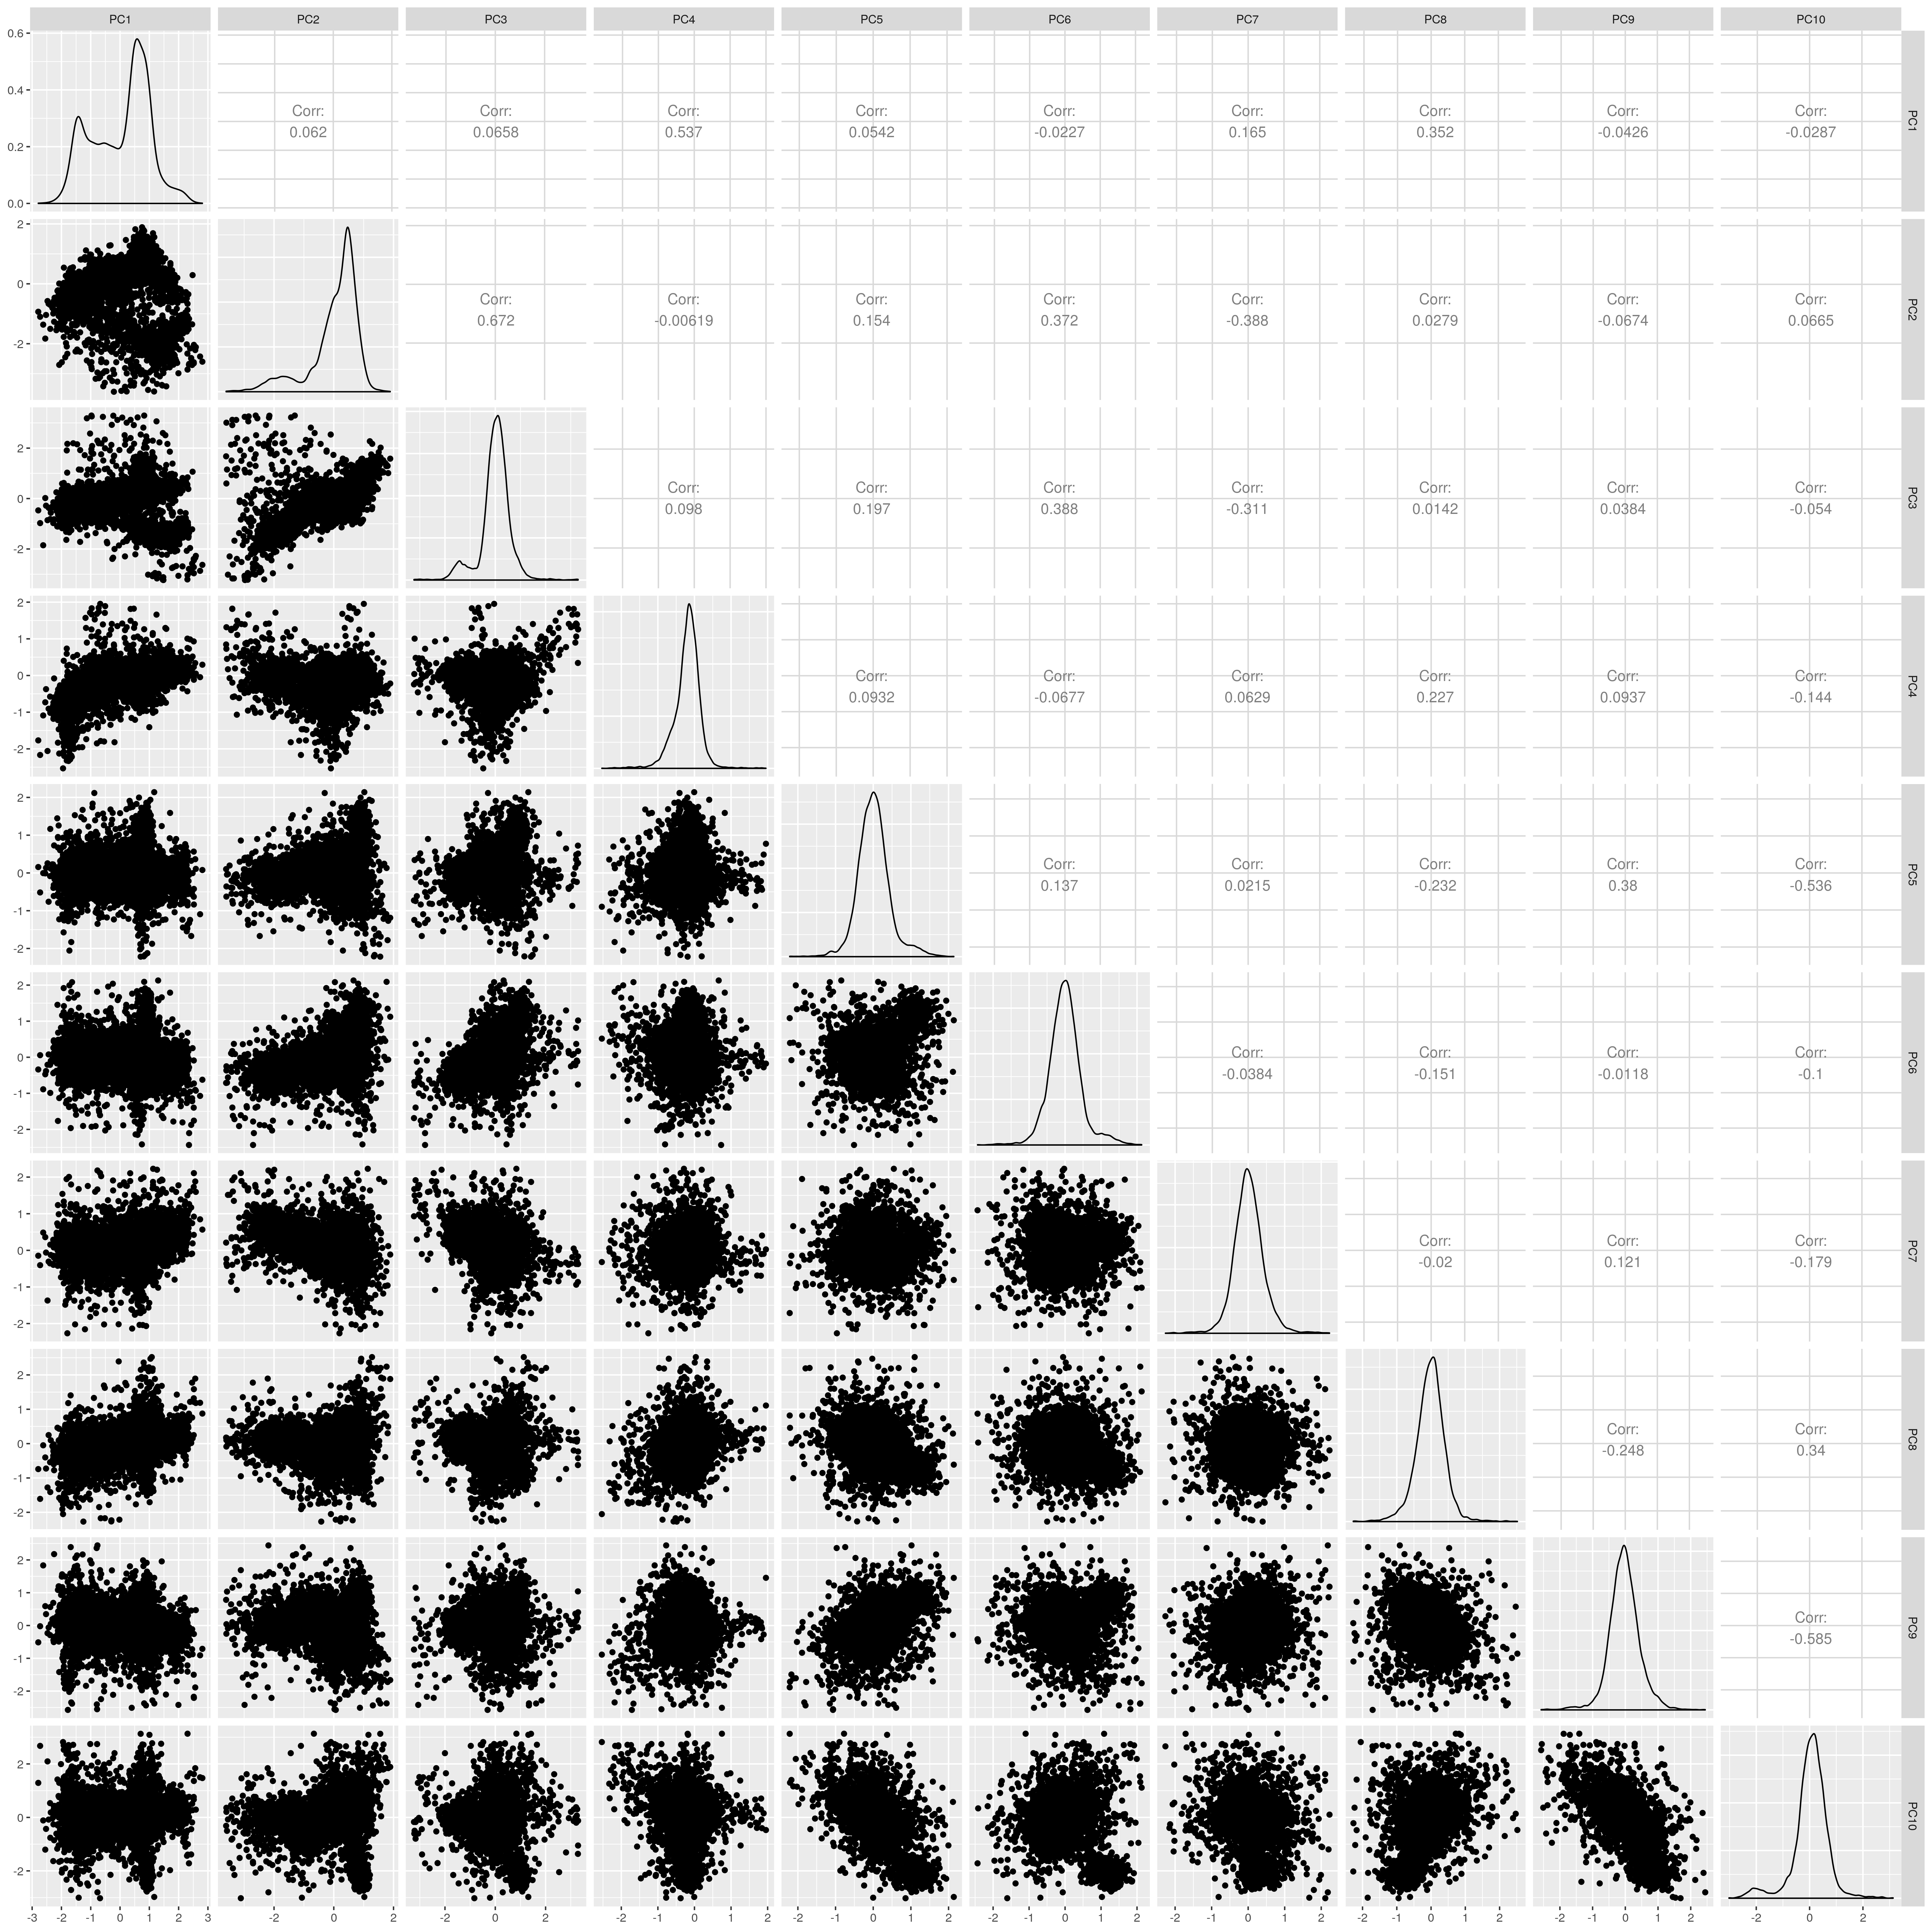
Show PCs after removal
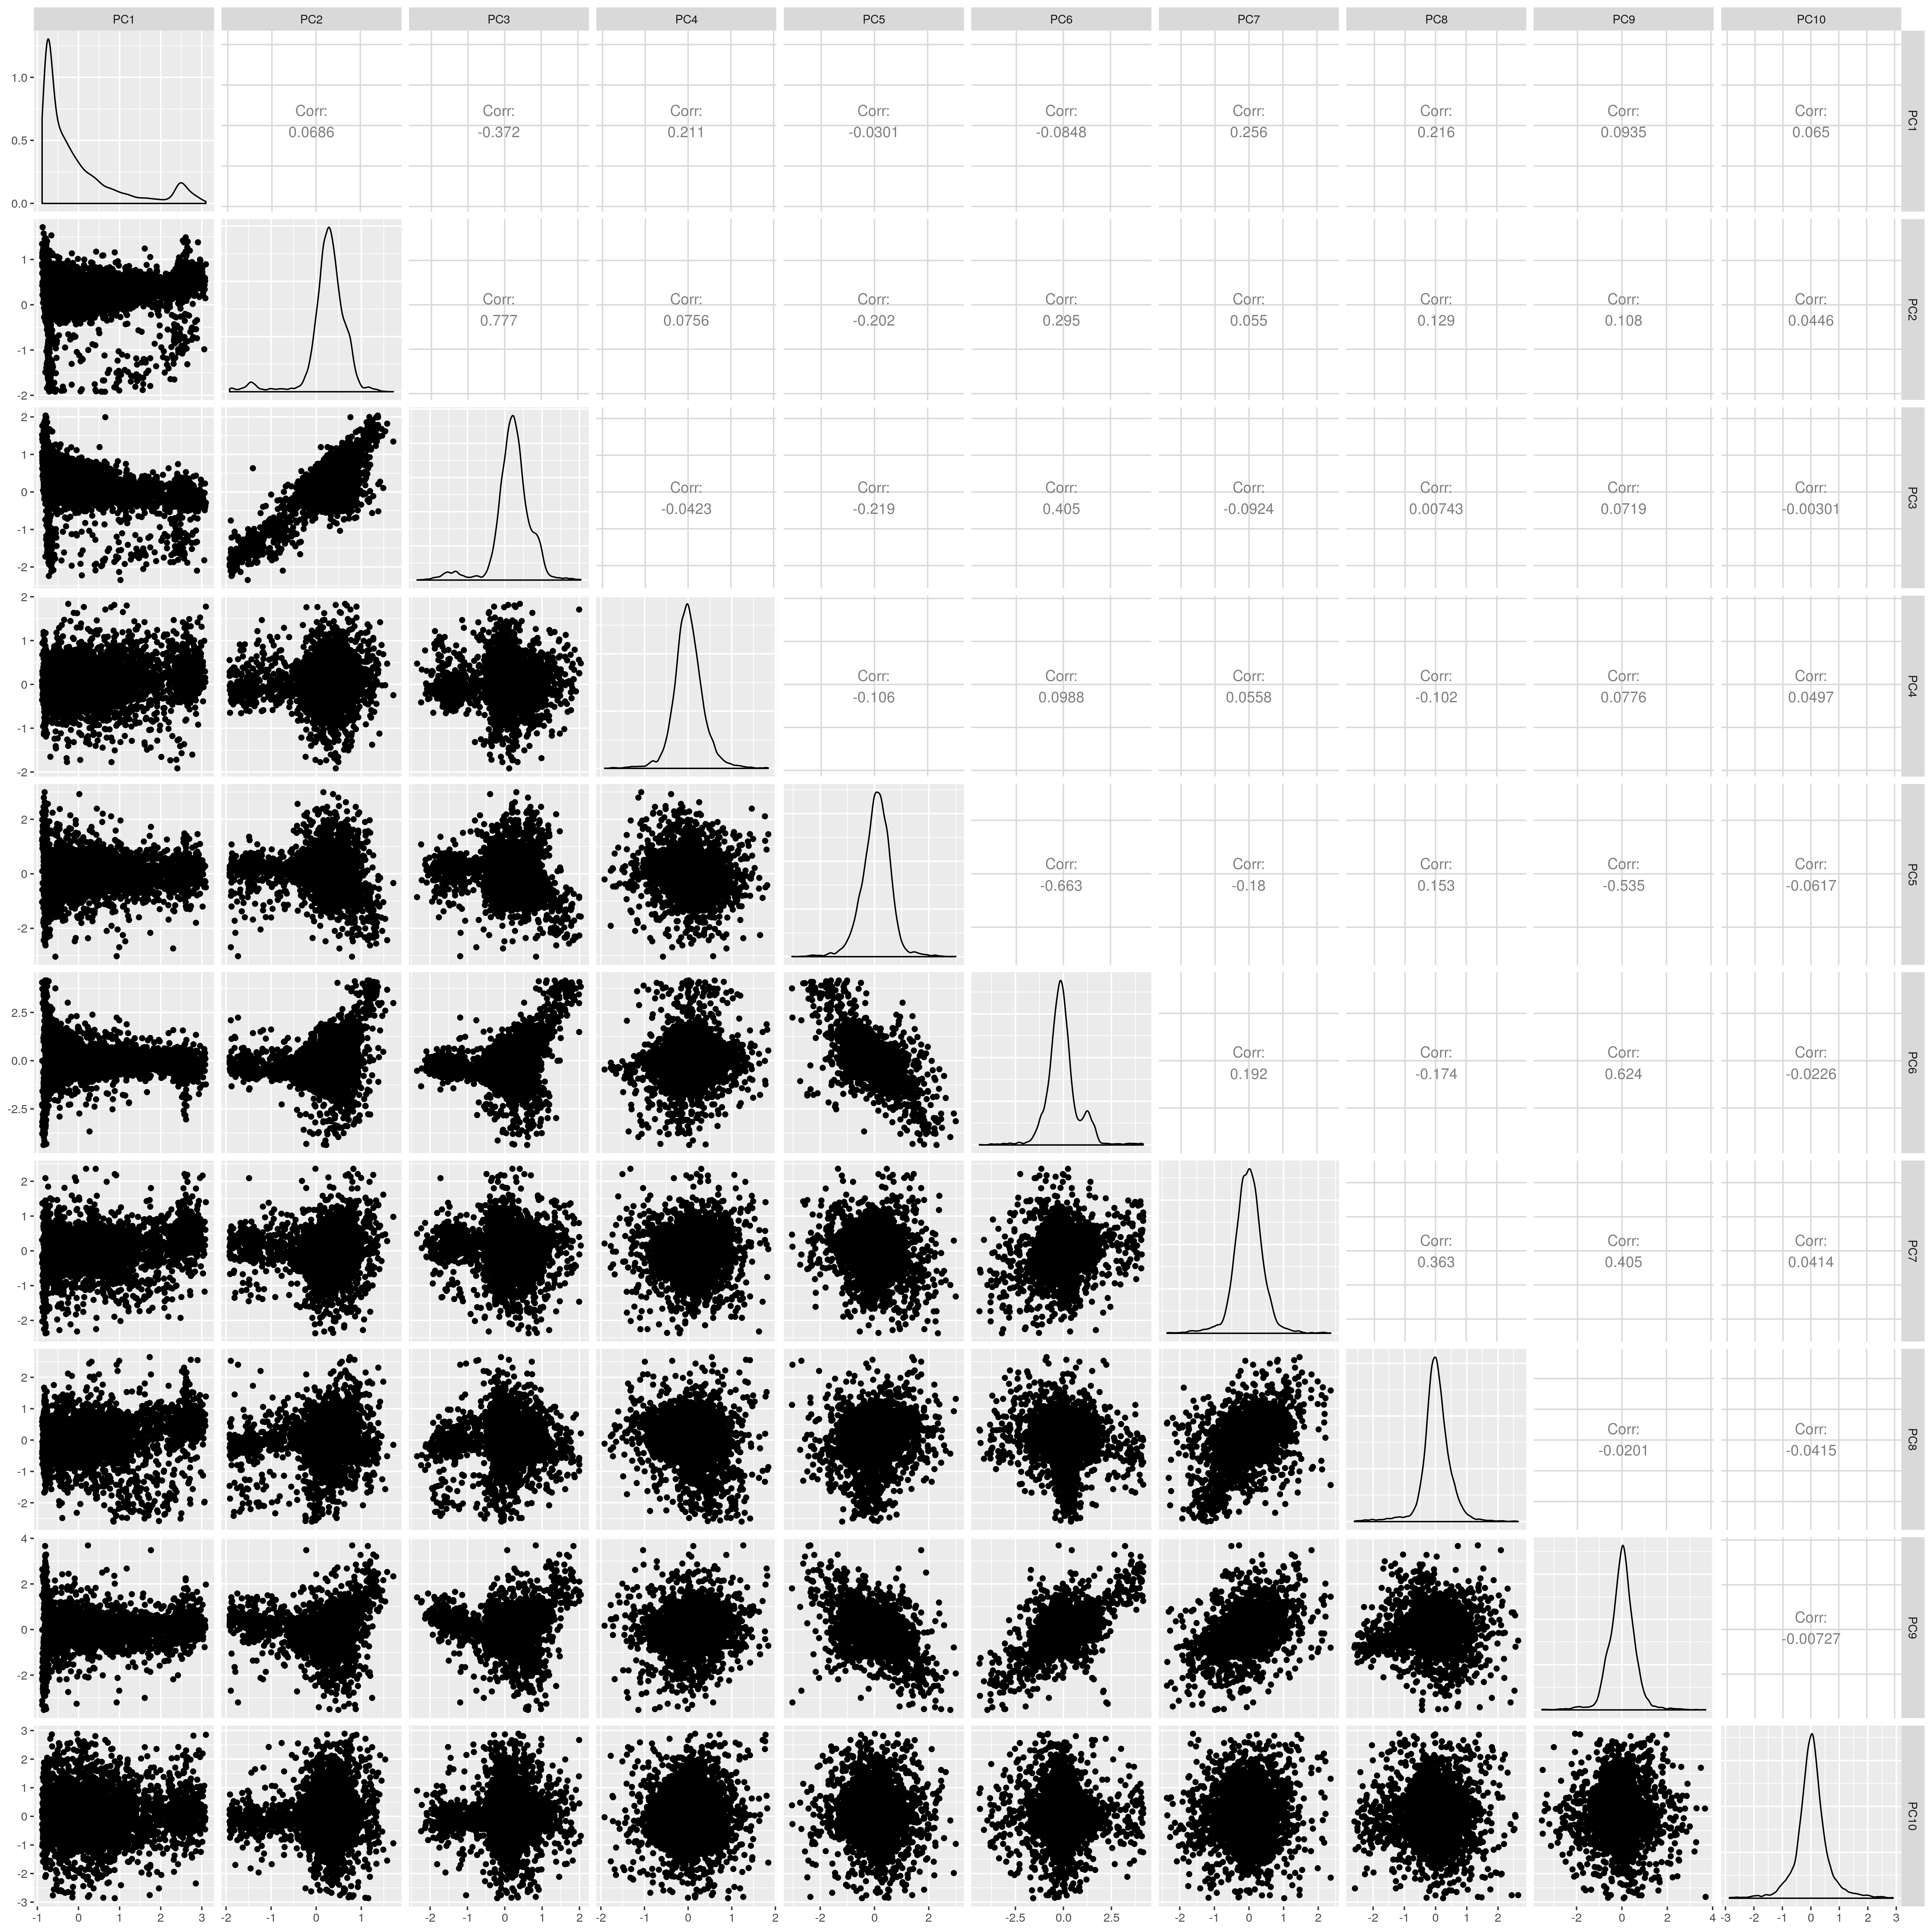
UKB AFR PCs after outlier removal
Show centroid distance before (left) and after (right) outlier removal
1.1.2 AMR
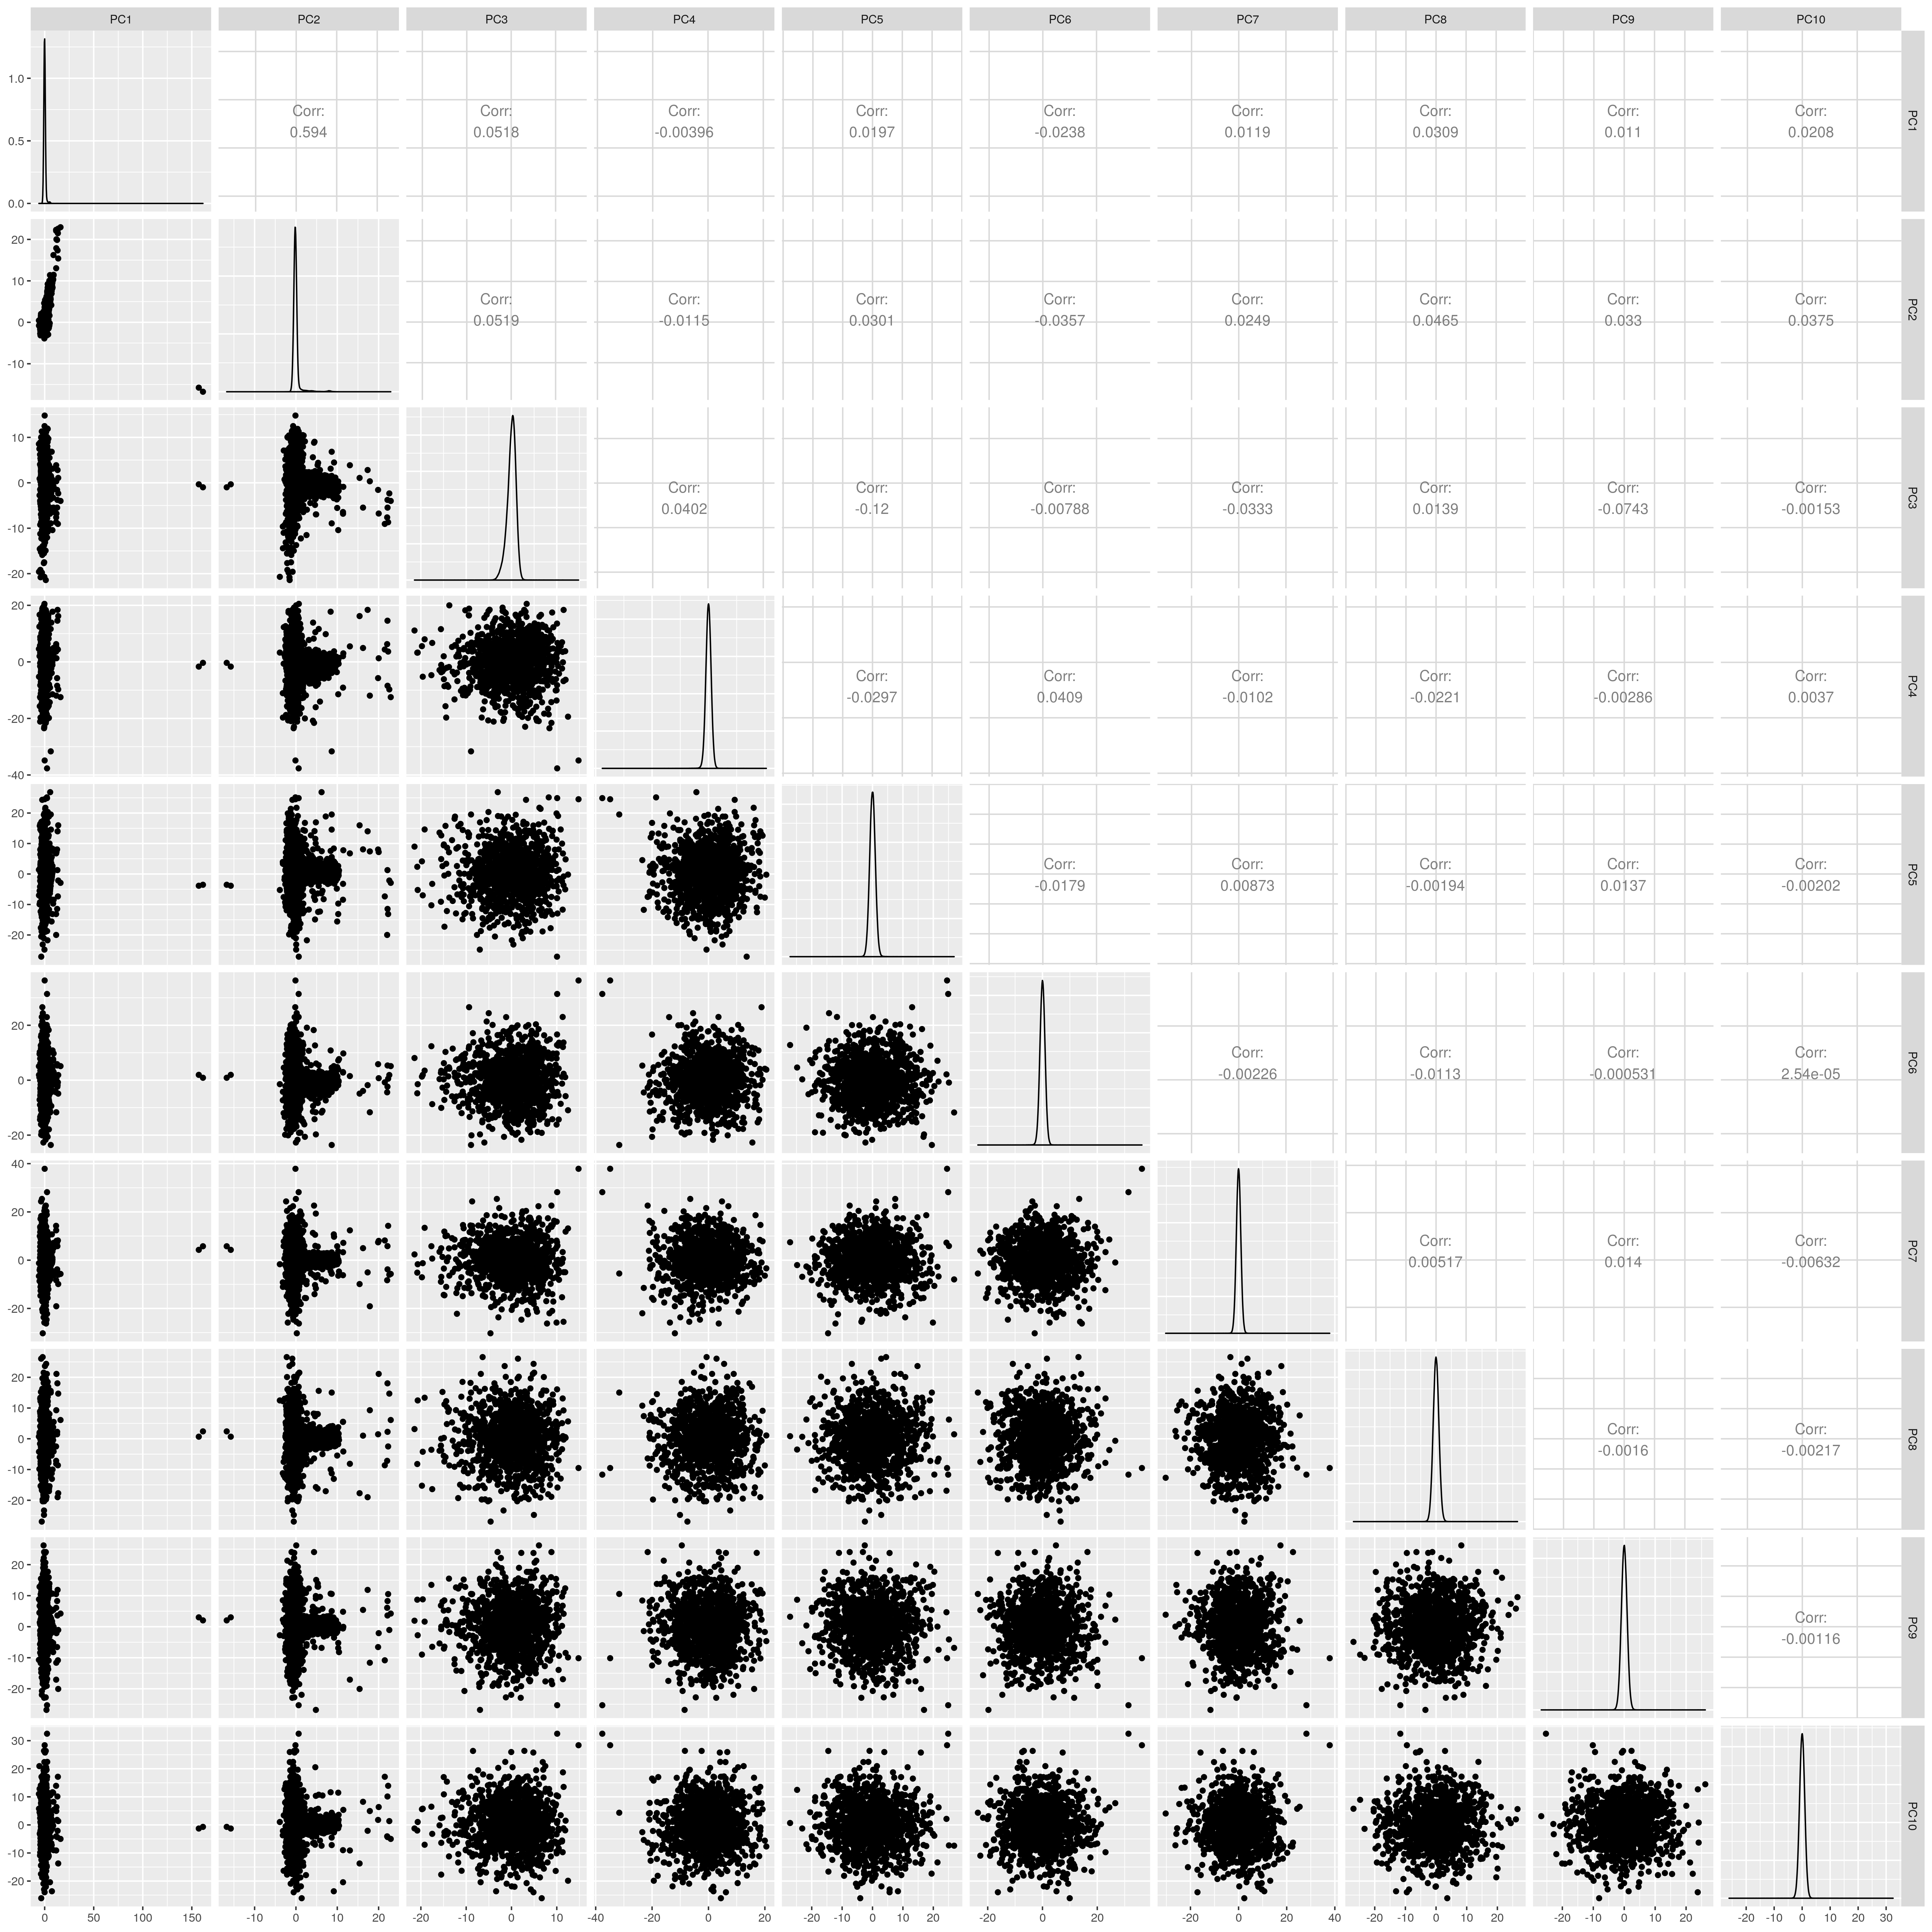
Show PCs before outlier removal
UKB AMR PCs before outlier removal
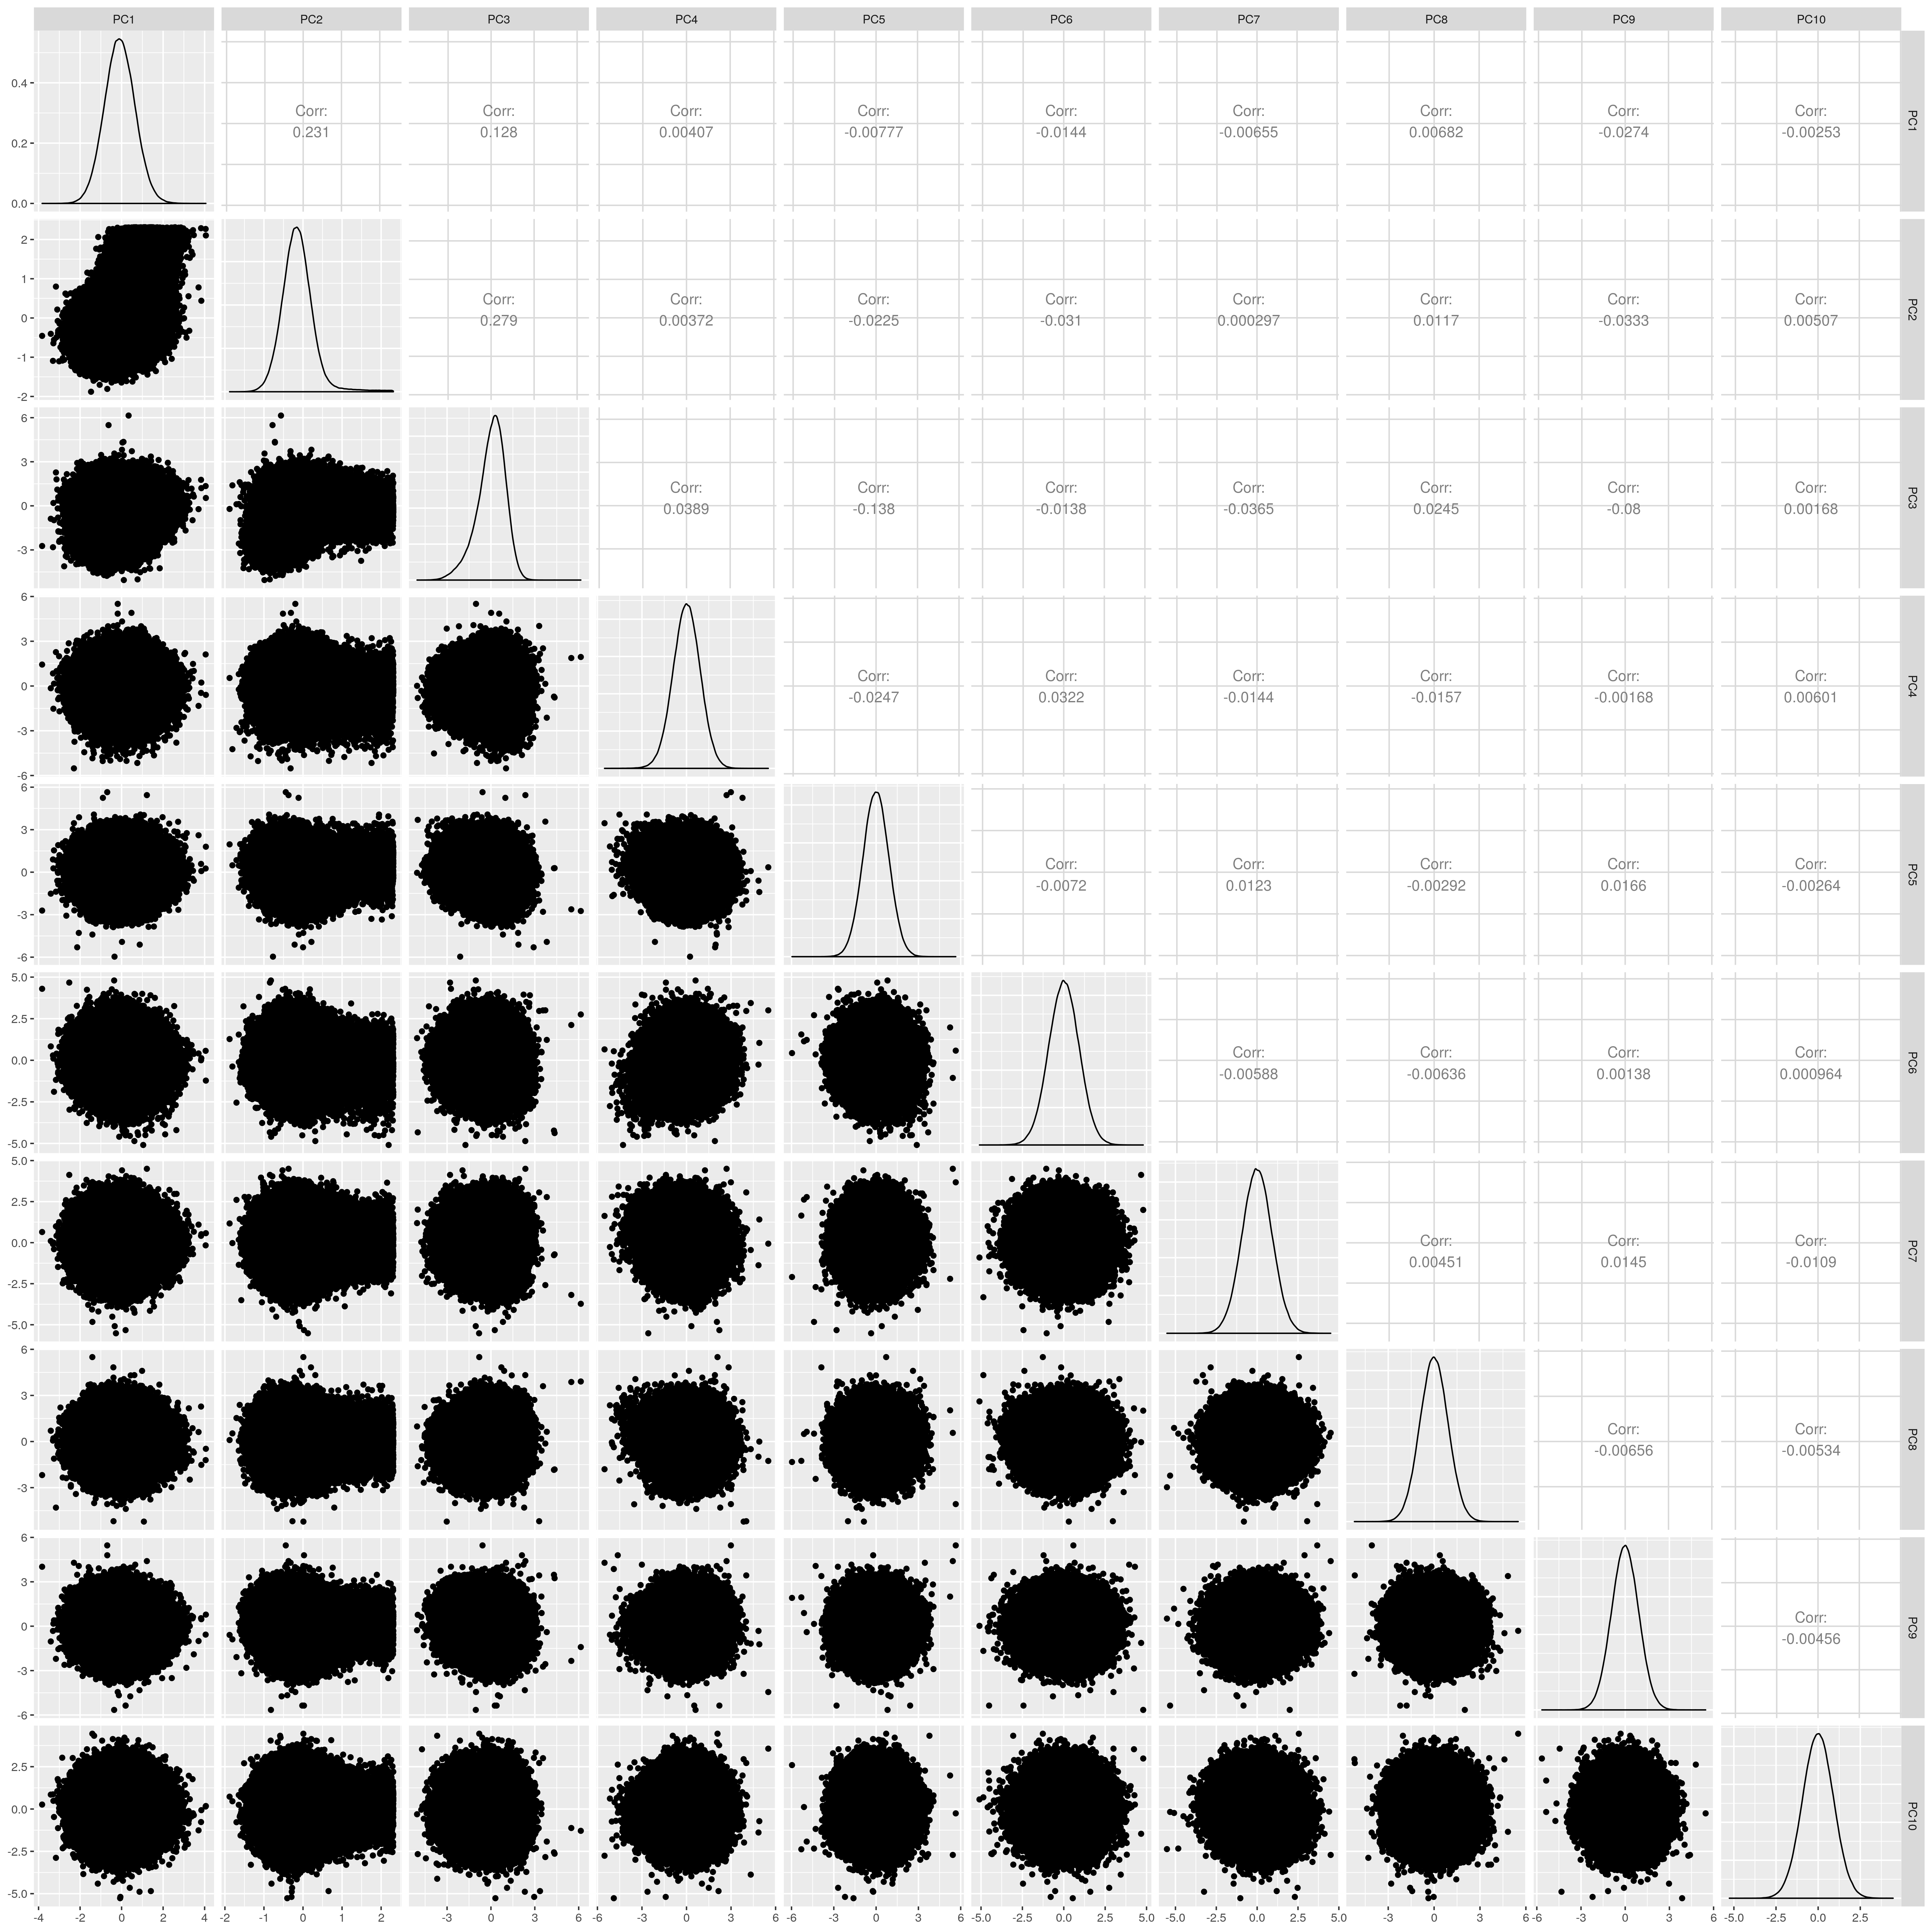
Show PCs after removal
UKB AMR PCs after outlier removal
Show centroid distance before (left) and after (right) outlier removal
1.1.3 EAS
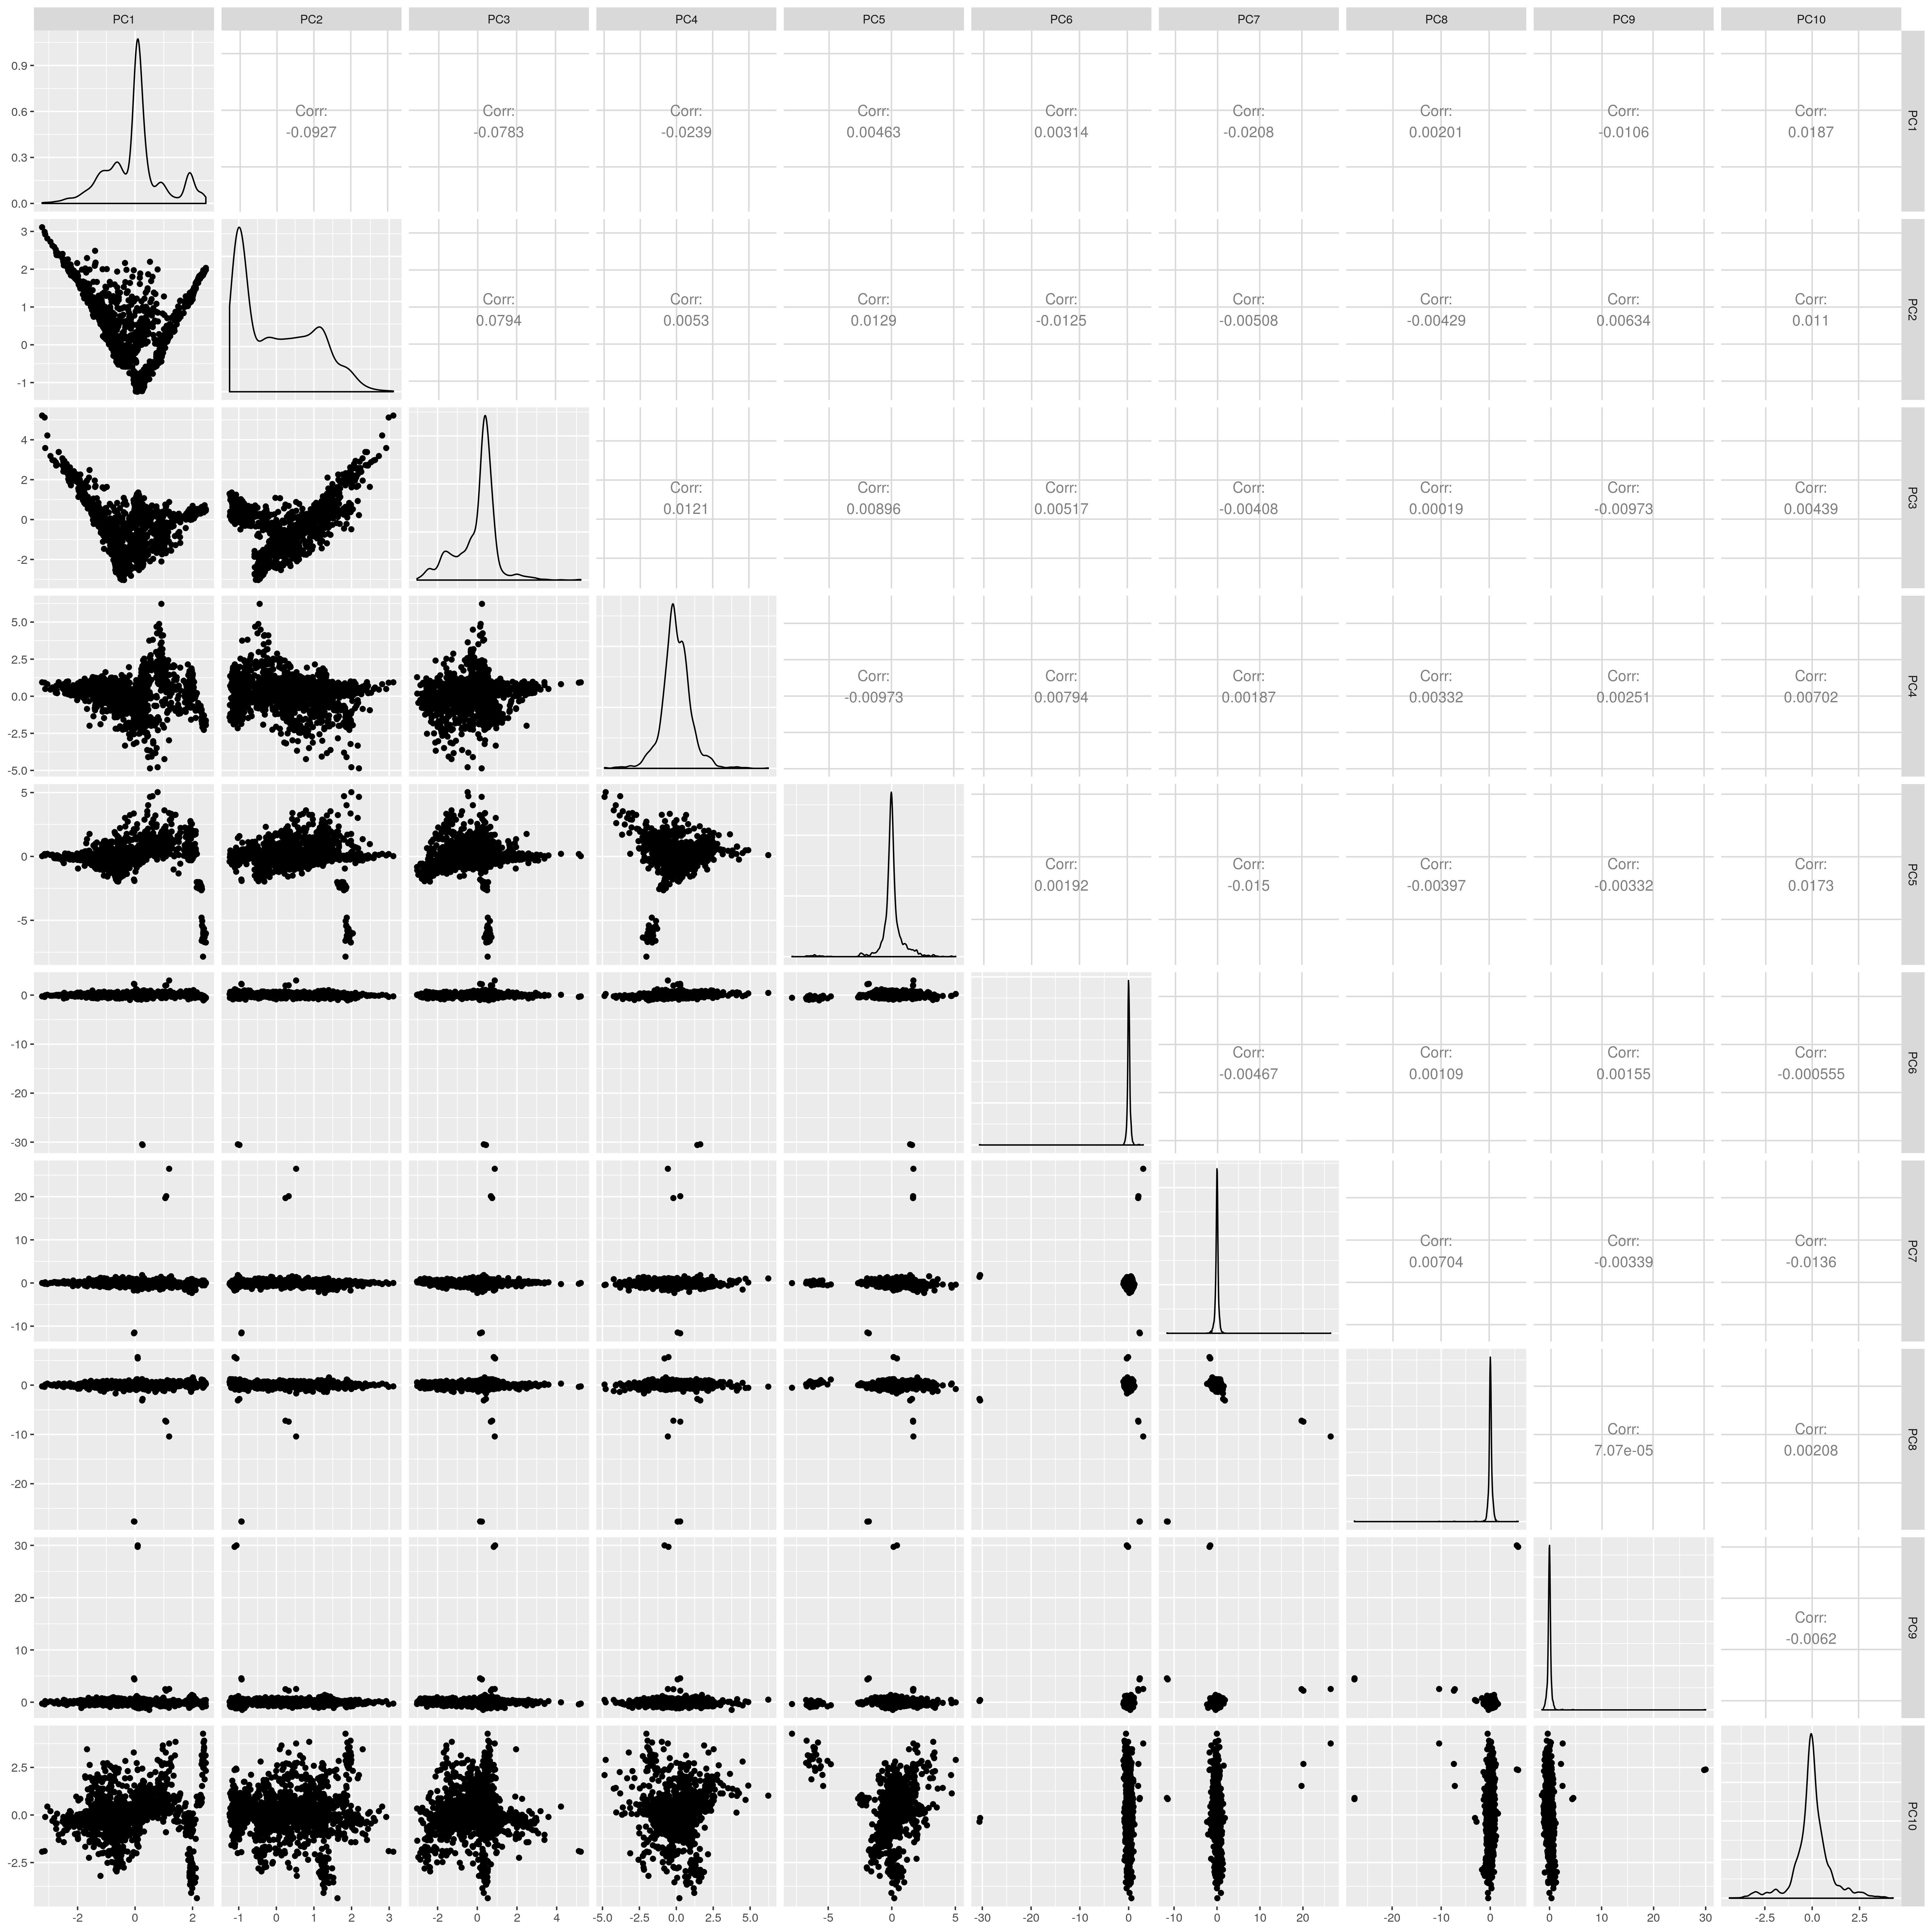
Show PCs before outlier removal
UKB EAS PCs before outlier removal
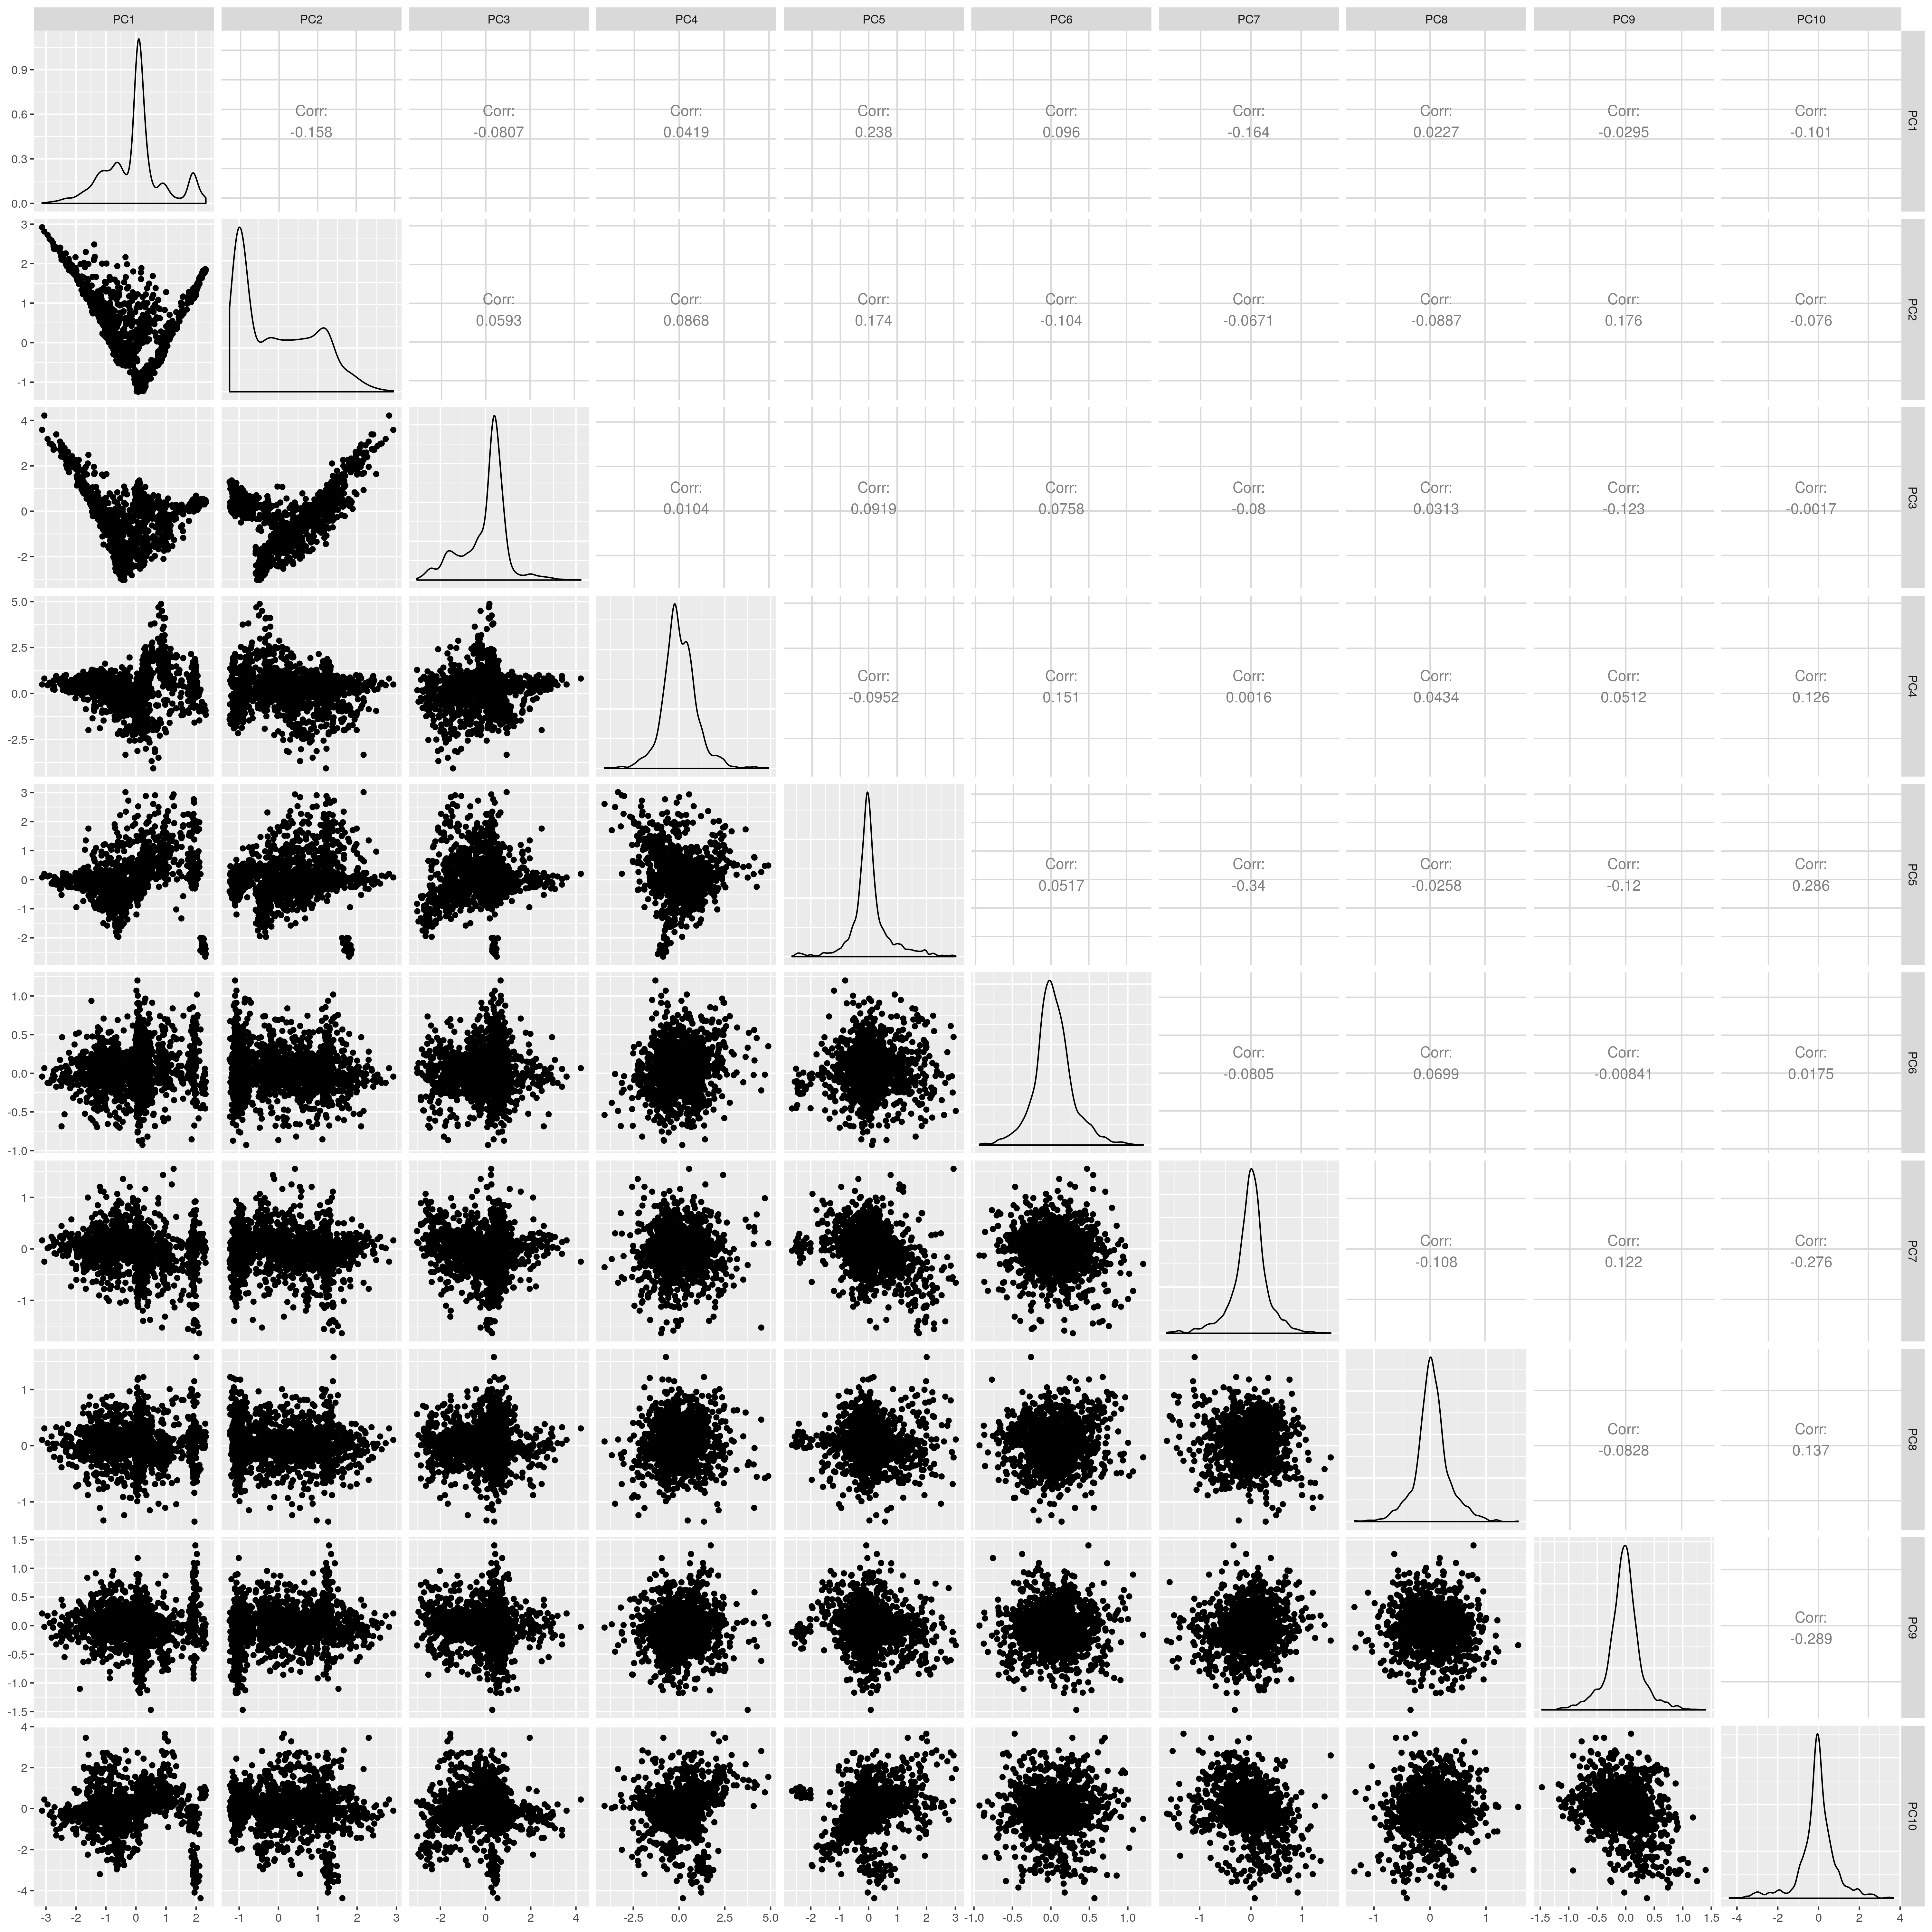
Show PCs after removal
UKB EAS PCs after outlier removal
Show centroid distance before (left) and after (right) outlier removal
1.1.4 EUR
Show PCs before outlier removal
UKB EUR PCs before outlier removal
Show PCs after removal
UKB EUR PCs after outlier removal
Show centroid distance before (left) and after (right) outlier removal
1.1.5 SAS
Show PCs before outlier removal
UKB SAS PCs before outlier removal
Show PCs after removal
UKB SAS PCs after outlier removal
Show centroid distance before (left) and after (right) outlier removal
The figures show that extreme outliers have been removed, without truncating the normal distribution. A centroid distance threshold of Q3 + IQR*30 has been used, which seems lenient but looking at the PC distributions indicates this threshold works well. When using more stringent thresholds, the PC normal distribution was truncated. By using the lenient centroid distance threshold, there is a large tail on the distance distribution but I don’t think this is problematic, as multiple centroids (clusters) exist within each population, meaning not everyone will be close to every centroid, and using a stringent distance threshold would remove a large number of individuals. I think to validate the QC, we should run standard GWAS with PCs regressed, and check the LD-score regression intercept.
3 Remove individuals and SNPs based on other QC metrics
SNP-level QC should done within population as the extent of missingness varies substantially across populations. This probably reflects the bias to capturing variation in European populations.
3.1 First estimate individual level missingness
Show code
mkdir /scratch/groups/ukbiobank/usr/ollie_pain/ReQC/PostQC

# Remove variants with a liberal level of missingness.
for pop in EUR AFR SAS EAS AMR;do
sbatch -p brc,shared --mem=4G /users/k1806347/brc_scratch/Software/plink1.9.sh \
  --bfile /scratch/datasets/ukbiobank/June2017/Genotypes/ukb_binary_v2 \
  --fam /scratch/groups/ukbiobank/usr/ollie_pain/ReQC/fake_fam.fam \
  --keep /scratch/groups/ukbiobank/usr/ollie_pain/ReQC/outlier_detection/UKBB.QC.${pop}.keep \
  --geno 0.05 \
  --write-snplist \
  --out /scratch/groups/ukbiobank/usr/ollie_pain/ReQC/PostQC/UKB.QC.${pop}.GENO_05
done

# Estimate individual missingness
for pop in EUR AFR SAS EAS AMR;do
sbatch -p brc,shared --mem=4G /users/k1806347/brc_scratch/Software/plink1.9.sh \
  --bfile /scratch/datasets/ukbiobank/June2017/Genotypes/ukb_binary_v2 \
  --fam /scratch/groups/ukbiobank/usr/ollie_pain/ReQC/fake_fam.fam \
  --keep /scratch/groups/ukbiobank/usr/ollie_pain/ReQC/outlier_detection/UKBB.QC.${pop}.keep \
  --extract /scratch/groups/ukbiobank/usr/ollie_pain/ReQC/PostQC/UKB.QC.${pop}.GENO_05.snplist \
  --missing \
  --out /scratch/groups/ukbiobank/usr/ollie_pain/ReQC/PostQC/UKB.QC.${pop}
done
3.2 Now create a list of individuals surviving all QC parameters
Show code
library(data.table)

# Read in the sqc file
sqc_file<-fread('/scratch/datasets/ukbiobank/June2017/Imputed/ukb_sqc_v2.txt')

# Read in sqc file header
sqc_file_header<-fread('/scratch/datasets/ukbiobank/June2017/Imputed/ukb_sqc_v2_fields.txt', sep='&', header=F)$V1
sqc_file_header<-sqc_file_header[-1:-4]
sqc_file_header_cols<-gsub(' .*','',sqc_file_header)
for(i in 1:length(sqc_file_header_cols)){
  print(paste0(sqc_file_header_cols[i],'  '))
  sqc_file_header<-gsub(paste0('^',sqc_file_header_cols[i],'  '),'',sqc_file_header)
}
sqc_file_header<-gsub('^   ','',sqc_file_header)
sqc_file_header<-gsub('^  ','',sqc_file_header)
sqc_file_header<-gsub('^ ','',sqc_file_header)
sqc_file_header<-sub(' .*','',sqc_file_header)
sqc_file_header<-gsub('\t','',sqc_file_header)

###
# Identify rows with concordant sex
###
# Columns 8 and 9
sex_check<-which(sqc_file$V10 == sqc_file$V11)
males<-sex_check[(sex_check %in% which(sqc_file$V10 == 'M'))]

###
# Identify rows that are not UKB recommended exlusions
###
# het.missing.outliers
het.missin.outlier<-which(sqc_file$V19 == 0)

# List those that survive both QC steps
qc<-sex_check[(sex_check %in% het.missin.outlier)]

###
# Identify individuals with <0.02 missingness
###

n_removed<-NULL
miss_keep_all<-NULL
for(pop in c('EUR','AFR','SAS','EAS','AMR')){
  imiss<-fread(paste0('/scratch/groups/ukbiobank/usr/ollie_pain/ReQC/PostQC/UKB.QC.',pop,'.imiss'))
  miss_keep<-imiss$FID[imiss$F_MISS < 0.02]
  miss_keep_all<-c(miss_keep_all,miss_keep)
  n_removed<-rbind(n_removed, data.frame(Pop=pop,
                                         Before=dim(imiss)[1],
                                         After=length(miss_keep)))
}

# The number removed from each population look reasonable.

# List those that survive both QC steps
qc<-qc[(qc %in% miss_keep_all)]

###
# Create file indicating rows that survive QC
###

# Make directory for the output
dir.create('/scratch/groups/ukbiobank/usr/ollie_pain/ReQC/PostQC/')

qc_table<-NULL
for(pop in c('EUR','AFR','SAS','EAS','AMR')){
  # Read in file listing that are not outliers
  keep<-fread(paste0('/scratch/groups/ukbiobank/usr/ollie_pain/ReQC/outlier_detection/UKBB.QC.',pop,'.keep'))

  # Remove those that fail sex check and are het.missing outliers
  keep_qc<-keep[(keep$V1 %in% qc),]

  write.table(keep_qc, paste0('/scratch/groups/ukbiobank/usr/ollie_pain/ReQC/PostQC/UKB.postQC.',pop,'.keep'), col.names=F, row.names=F, quote=F)

  # Output files for males and females seperately
  keep_qc_males<-keep_qc[(keep_qc$V1 %in% males),]
  keep_qc_females<-keep_qc[!(keep_qc$V1 %in% males),]

  write.table(keep_qc_males, paste0('/scratch/groups/ukbiobank/usr/ollie_pain/ReQC/PostQC/UKB.postQC.',pop,'.males.keep'), col.names=F, row.names=F, quote=F)
  write.table(keep_qc_females, paste0('/scratch/groups/ukbiobank/usr/ollie_pain/ReQC/PostQC/UKB.postQC.',pop,'.females.keep'), col.names=F, row.names=F, quote=F)

  qc_table<-rbind(qc_table, data.frame(Population=pop,
                                       PreQC=dim(keep)[1],
                                       PostQC=dim(keep_qc)[1],
                                       PostQC_Males=dim(keep_qc_males)[1],
                                       PostQC_Females=dim(keep_qc_females)[1]))

}

write.csv(qc_table, paste0('/scratch/groups/ukbiobank/usr/ollie_pain/ReQC/PostQC/UKB.postQC.NIndiv_table.csv'), col.names=F, row.names=F, quote=F)| Population | PreQC | PostQC | PostQC_Males | PostQC_Females |
|---|---|---|---|---|
| EUR | 450393 | 445255 | 203737 | 241518 |
| AFR | 8003 | 7924 | 3243 | 4681 |
| SAS | 9852 | 9688 | 5135 | 4553 |
| EAS | 2540 | 2502 | 826 | 1676 |
| AMR | 1980 | 1904 | 993 | 911 |
3.2.1 Create snplist of genotyped SNPs surviving QC for population
Show code
# QC autosomes within populations
for pop in EUR AFR SAS EAS AMR;do
sbatch -p brc,shared --mem=4G /users/k1806347/brc_scratch/Software/plink1.9.sh \
  --bfile /scratch/datasets/ukbiobank/June2017/Genotypes/ukb_binary_v2 \
  --fam /scratch/groups/ukbiobank/usr/ollie_pain/ReQC/fake_fam.fam \
  --keep /scratch/groups/ukbiobank/usr/ollie_pain/ReQC/PostQC/UKB.postQC.${pop}.keep \
  --maf 0.01 \
  --geno 0.02 \
  --chr 1-22 \
  --hwe 1e-8 \
  --write-snplist \
  --out /scratch/groups/ukbiobank/usr/ollie_pain/ReQC/PostQC/UKB.postQC.${pop}.Autosome.MAF_01.GENO_02.HWE_1e-8
done
# Create table showing the number of genotyped SNPs in each population after SNP QC
before_qc<-fread('/scratch/datasets/ukbiobank/June2017/Genotypes/ukb_binary_v2.bim')
before_qc_n<-dim(before_qc)[1]

qc_table<-NULL

for(pop in c('EUR','AFR','SAS','EAS','AMR')){
  after_qc<-fread(paste0('/scratch/groups/ukbiobank/usr/ollie_pain/ReQC/PostQC/UKB.postQC.',pop,'.Autosome.MAF_01.GENO_02.HWE_1e-8.snplist'), header=F)
  after_qc_n<-dim(after_qc)[1]

  qc_table<-rbind(qc_table, data.frame(Population=pop,
                                       PreQC=before_qc_n,
                                       PostQC=after_qc_n))

}

write.csv(qc_table, paste0('/scratch/groups/ukbiobank/usr/ollie_pain/ReQC/PostQC/UKB.postQC.NSNP_table.csv'), col.names=F, row.names=F, quote=F)| Population | PreQC | PostQC |
|---|---|---|
| EUR | 805426 | 542705 |
| AFR | 805426 | 386774 |
| SAS | 805426 | 495507 |
| EAS | 805426 | 341397 |
| AMR | 805426 | 549764 |
3.2.2 Remove temporary files
Show code
rm /scratch/groups/ukbiobank/usr/ollie_pain/ReQC/PostQC/UKB.QC.*4 Create SNP-stat for imputed variants in each population
This will only be implmented when someone actually wants the data.
Show code
mkdir /scratch/groups/ukbiobank/usr/ollie_pain/ReQC/PostQC/pop_snp_stat

for pop in $(echo EUR AFR SAS EAS AMR); do
mkdir /scratch/groups/ukbiobank/usr/ollie_pain/ReQC/PostQC/pop_snp_stat/${pop}
for chr in $(seq 1 22); do
sbatch -p brc,shared --mem 10G /users/k1806347/brc_scratch/Software/qctool2.sh \
  -g /scratch/datasets/ukbiobank/June2017/Imputed/ukb_imp_chr${chr}_v3_MAF1_INFO4.bgen \
  -s /scratch/datasets/ukbiobank/June2017/Imputed/FakeSample.sample \
  -incl-samples /scratch/groups/ukbiobank/usr/ollie_pain/ReQC/PostQC/UKB.postQC.${pop}.keep \
  -snp-stats \
  -osnp /scratch/groups/ukbiobank/usr/ollie_pain/ReQC/PostQC/pop_snp_stat/${pop}/UKB.postQC.${pop}.chr${chr}.txt
done
done
5 List files created
- UKB.postQC.${pop}.keep: UKB individuals by original row index surviving QC within each population.
- UKB.postQC.${pop}.Autosome.MAF_01.GENO_02.HWE_1e-8.snplist: List of autosomal genotyped variants surviving QC within each population
- UKB.postQC.${pop}.females.keep: Females in UKB individuals by original row index surviving QC within each
- UKB.postQC.${pop}.males.keep: Males in UKB individuals by original row index surviving QC within each