Evaluation of Imputed Gene Expression Risk Scores
1 Introduction
This study evaluates the predictive utility of GeRS calculated using several strategies. The predictive utility of models containing polygenic scores and GeRS is also investigated.
2 Aims
- Evaluate the predictive utility of GeRS based on a single eQTL data source.
- Evaluate models combining GeRS derived eQTL data from multiple tissues.
- Determine whether GeRS can improve prediction when in combination with polygenic scores.
3 Methods
3.1 Samples
- UK Biobank
- TEDS
3.2 Outcomes
- UK Biobank
- Depression (binary)
- Intelligence (continuous)
- Body mass index (BMI - continuous)
- Height (continuous)
- Coronary Artery Disease (CAD - Binary)
- Type II Diabetes (T2D - Binary)
- Inflammatory Bowel Disorder (IBD - Binary)
- Rheumatoid arthritis (RheuArth - Binary)
- TEDS
- ADHD traits (continuous)
- Height (continuous)
- Body mass index (BMI - continuous)
- GCSE scores (continuous)
Note. Multiple Slerosis in UK Biobank was not included due to insufficent SNP data in the corresponding GWAS for TWAS.
3.3 Genotypic data
Both target sample underwent stringent quality control prior to imputation using the HRC-reference. After imputation, genotypes were converted to PLINK hard-calls, and only HapMap3 SNPs were retained. Eureopean individuals within the target samples were identified and retained if they were within the 3SD of the 1KG European mean of the first 100 principal components.
3.4 GWAS summary statistics
For each target phenotype, the largest independent phenotype-matched GWAS was selected for calculating polygenic scores. More information can be found in the table below.
Preparing GWAS sumstats table for UK Biobank phenotypes
source('/users/k1806347/brc_scratch/Software/MyGit/GenoPred/config_used/Phenotype_prep.config')

library(data.table)

pheno<-fread('/users/k1806347/brc_scratch/Data/GWAS_sumstats/QC_sumstats_list_031218.csv')

ukb_pheno=c('Depression','Intelligence','BMI','Height','T2D','CAD','IBD','MultiScler','RheuArth')
ukb_gwas=c('DEPR06','COLL01','BODY03','HEIG03','DIAB05','COAD01','CROH01','SCLE02','RHEU01')
ukb_prev=c(0.15,NA,NA,NA,0.05,0.03,0.013,0.00164,0.005)
ukb_dat<-data.frame(pheno=ukb_pheno,gwas=ukb_gwas,prev=ukb_prev)

pheno_ukb<-pheno[(pheno$Code %in% ukb_gwas),]
pheno_ukb<-pheno_ukb[,c('Code','trait','year','PMID','Ncases','Ncontrols','sample_size_discovery','h2 observed','h2 se','lambda GC','intercept','intercept se')]
names(pheno_ukb)<-c('Code','trait','year','PMID','Ncases','Ncontrols','sample_size_discovery','h2_obs','h2_se','lambda','intercept','intercept_se')

pheno_ukb$pop_prev<-ukb_dat$prev[match(pheno_ukb$Code, ukb_dat$gwas)]
pheno_ukb$Target_Phenotype<-ukb_dat$pheno[match(pheno_ukb$Code, ukb_dat$gwas)]
pheno_ukb$Ncases<-as.numeric(gsub(',','',pheno_ukb$Ncases))
pheno_ukb$Ncontrols<-as.numeric(gsub(',','',pheno_ukb$Ncontrols))
pheno_ukb$samp_prev<-pheno_ukb$Ncases/(pheno_ukb$Ncases+pheno_ukb$Ncontrols)

h2l_R2 <- function(k, r2, p) {
  # K baseline disease risk
  # r2 from a linear regression model attributable to genomic profile risk score
  # P proportion of sample that are cases
  # calculates proportion of variance explained on the liability scale
  #from ABC at http://www.complextraitgenomics.com/software/
  #Lee SH, Goddard ME, Wray NR, Visscher PM. (2012) A better coefficient of determination for genetic profile analysis. Genet Epidemiol. 2012 Apr;36(3):214-24.
  x= qnorm(1-k)
  z= dnorm(x)
  i=z/k
  C= k*(1-k)*k*(1-k)/(z^2*p*(1-p))
  theta= i*((p-k)/(1-k))*(i*((p-k)/(1-k))-x)
  h2l_R2 = C*r2 / (1 + C*theta*r2)
}

se_h2l_R2 <- function(k,h2,se, p) {
  # K baseline disease risk
  # r2 from a linear regression model attributable to genomic profile risk score
  # P proportion of sample that are cases
  # calculates proportion of variance explained on the liability scale
  #from ABC at http://www.complextraitgenomics.com/software/
  #Lee SH, Goddard ME, Wray NR, Visscher PM. (2012) A better coefficient of determination for genetic profile analysis. Genet Epidemiol. 2012 Apr;36(3):214-24.

  #SE on the liability (From a Taylor series expansion)
  #var(h2l_r2) = [d(h2l_r2)/d(R2v)]^2*var(R2v) with d being calculus differentiation
  x= qnorm(1-k)
  z= dnorm(x)
  i=z/k
  C= k*(1-k)*k*(1-k)/(z^2*p*(1-p))
  theta= i*((p-k)/(1-k))*(i*((p-k)/(1-k))-x)
  se_h2l_R2 = C*(1-h2*theta)*se
}

pheno_ukb$h2_obs<-as.numeric(pheno_ukb$h2_obs)
pheno_ukb$h2_se<-as.numeric(pheno_ukb$h2_se)

pheno_ukb$h2_liab<-round(h2l_R2(k=pheno_ukb$pop_prev, r2=pheno_ukb$h2_obs, p=pheno_ukb$samp_prev),3)
pheno_ukb$h2_liab_se<-round(se_h2l_R2(k=pheno_ukb$pop_prev,h2=pheno_ukb$h2_obs,se=pheno_ukb$h2_se, p=pheno_ukb$samp_prev),3)

pheno_ukb$h2_obs<-paste0(pheno_ukb$h2_obs," (", pheno_ukb$h2_se,")")
pheno_ukb$h2_se<-NULL
pheno_ukb$h2_liab[!is.na(pheno_ukb$Ncases)]<-paste0(pheno_ukb$h2_liab[!is.na(pheno_ukb$Ncases)]," (", pheno_ukb$h2_liab_se[!is.na(pheno_ukb$Ncases)],")")
pheno_ukb$h2_liab_se<-NULL
pheno_ukb$intercept<-paste0(pheno_ukb$intercept," (", pheno_ukb$intercept_se,")")
pheno_ukb$intercept_se<-NULL

pheno_ukb$trait<-c('BMI','CAD','College Completion',"Crohn's Disease",'Major Depression','T2D','Height','RheuArth','MultiScler')
pheno_ukb<-pheno_ukb[match(ukb_dat$gwas,pheno_ukb$Code),]

pheno_ukb<-pheno_ukb[,c('Target_Phenotype','Code','trait','year','PMID','Ncases','Ncontrols','sample_size_discovery','h2_obs','h2_liab','intercept','lambda')]
names(pheno_ukb)<-c('Target Phenotype','Code','GWAS Phenotype','Year','PMID','Ncase','Ncontrol','N','h2_obs','h2_liab','Intercept','Lambda')

write.csv(pheno_ukb, '/users/k1806347/brc_scratch/Data/GWAS_sumstats/UKBB_phenotype_GWAS_descrip.csv', row.names=F, quote=F)
Show GWAS for UK Biobank phenotypes
| Target Phenotype | Code | GWAS Phenotype | Year | PMID | Ncase | Ncontrol | N | h2-obs (SE) | h2-liab (SE) | Intercept | Lambda |
|---|---|---|---|---|---|---|---|---|---|---|---|
| Major Depression | DEPR06 | major depressive disorder | 2018 | 29700475 | 116404 | 314990 | 431394 | 0.0551 (0.0023) | 0.085 (0.004) | 1.0169 (0.0088) | 1.3894 |
| Intelligence | COLL01 | college completion | 2013 | 23722424 | NA | NA | 95427 | 0.1048 (0.0075) | NA | 1.0214 (0.0086) | 1.1940 |
| BMI | BODY04 | BMI | 2015 | 25673413 | NA | NA | 322154 | 0.1297 (0.0056) | NA | 0.6729 (0.0076) | 1.0772 |
| Height | HEIG03 | height | 2014 | 25282103 | NA | NA | 253288 | 0.312 (0.0141) | NA | 1.3254 (0.0185) | 2.0007 |
| T2D | DIAB05 | diabetes type 2 | 2017 | 28566273 | 26676 | 132532 | 159208 | 0.0781 (0.0053) | 0.124 (0.008) | 0.9984 (0.0083) | 1.1459 |
| CAD | COAD01 | coronary artery disease | 2015 | 26343387 | 60801 | 123504 | 184305 | 0.0661 (0.0045) | 0.057 (0.004) | 0.8875 (0.0074) | 1.0466 |
| Crohn’s Disease | CROH01 | crohn disease | 2015 | 26192919 | 5956 | 14927 | 20883 | 0.4751 (0.0538) | 0.542 (0.059) | 1.0316 (0.0092) | 1.1396 |
| MultiScler | SCLE03 | multiple sclerosis | 2011 | 21833088 | 9772 | 17376 | 27148 | 0.0493 (0.0262) | 0.021 (0.012) | 1.0599 (0.0085) | 1.0375 |
| RheuArth | RHEU02 | rheumatoid arthritis | 2014 | 24390342 | 14361 | 43923 | 58284 | 0.1406 (0.0176) | 0.102 (0.013) | 0.9511 (0.0076) | 1.0466 |
| Breast Cancer | BRCA01 | breast cancer | 2017 | 29059683 | 122977 | 105974 | 228951 | 0.1326 (0.0108) | 0.157 (0.013) | 1.1001 (0.0125) | 1.3581 |
| Prostate Cancer | PRCA01 | prostate cancer | 2017 | 29892016 | 79148 | 61106 | 140254 | 0.1635 (0.0238) | 0.198 (0.029) | 1.0804 (0.0153) | 1.2201 |
Preparing GWAS sumstats table for TEDS phenotypes
source('/users/k1806347/brc_scratch/Software/MyGit/GenoPred/config_used/Phenotype_prep.config')

library(data.table)

pheno<-fread('/users/k1806347/brc_scratch/Data/GWAS_sumstats/QC_sumstats_list_031218.csv')

teds_pheno=c('Height21', 'BMI21', 'GCSE', 'ADHD')
teds_gwas=c('HEIG03', 'BODY11', 'EDUC03', 'ADHD04')
teds_prev=c(NA,NA,NA,0.05)
teds_dat<-data.frame(pheno=teds_pheno,gwas=teds_gwas,prev=teds_prev)

pheno_teds<-pheno[(pheno$Code %in% teds_gwas),]
pheno_teds<-pheno_teds[,c('Code','trait','year','PMID','Ncases','Ncontrols','sample_size_discovery','h2 observed','h2 se','lambda GC','intercept','intercept se')]
names(pheno_teds)<-c('Code','trait','year','PMID','Ncases','Ncontrols','sample_size_discovery','h2_obs','h2_se','lambda','intercept','intercept_se')

pheno_teds$pop_prev<-teds_dat$prev[match(pheno_teds$Code, teds_dat$gwas)]
pheno_teds$Target_Phenotype<-teds_dat$pheno[match(pheno_teds$Code, teds_dat$gwas)]
pheno_teds$Ncases<-as.numeric(gsub(',','',pheno_teds$Ncases))
pheno_teds$Ncontrols<-as.numeric(gsub(',','',pheno_teds$Ncontrols))
pheno_teds$samp_prev<-pheno_teds$Ncases/(pheno_teds$Ncases+pheno_teds$Ncontrols)

h2l_R2 <- function(k, r2, p) {
  # K baseline disease risk
  # r2 from a linear regression model attributable to genomic profile risk score
  # P proportion of sample that are cases
  # calculates proportion of variance explained on the liability scale
  #from ABC at http://www.complextraitgenomics.com/software/
  #Lee SH, Goddard ME, Wray NR, Visscher PM. (2012) A better coefficient of determination for genetic profile analysis. Genet Epidemiol. 2012 Apr;36(3):214-24.
  x= qnorm(1-k)
  z= dnorm(x)
  i=z/k
  C= k*(1-k)*k*(1-k)/(z^2*p*(1-p))
  theta= i*((p-k)/(1-k))*(i*((p-k)/(1-k))-x)
  h2l_R2 = C*r2 / (1 + C*theta*r2)
}

se_h2l_R2 <- function(k,h2,se, p) {
  # K baseline disease risk
  # r2 from a linear regression model attributable to genomic profile risk score
  # P proportion of sample that are cases
  # calculates proportion of variance explained on the liability scale
  #from ABC at http://www.complextraitgenomics.com/software/
  #Lee SH, Goddard ME, Wray NR, Visscher PM. (2012) A better coefficient of determination for genetic profile analysis. Genet Epidemiol. 2012 Apr;36(3):214-24.

  #SE on the liability (From a Taylor series expansion)
  #var(h2l_r2) = [d(h2l_r2)/d(R2v)]^2*var(R2v) with d being calculus differentiation
  x= qnorm(1-k)
  z= dnorm(x)
  i=z/k
  C= k*(1-k)*k*(1-k)/(z^2*p*(1-p))
  theta= i*((p-k)/(1-k))*(i*((p-k)/(1-k))-x)
  se_h2l_R2 = C*(1-h2*theta)*se
}

pheno_teds$h2_obs<-as.numeric(pheno_teds$h2_obs)
pheno_teds$h2_se<-as.numeric(pheno_teds$h2_se)

pheno_teds$h2_liab<-round(h2l_R2(k=pheno_teds$pop_prev, r2=pheno_teds$h2_obs, p=pheno_teds$samp_prev),3)
pheno_teds$h2_liab_se<-round(se_h2l_R2(k=pheno_teds$pop_prev,h2=pheno_teds$h2_obs,se=pheno_teds$h2_se, p=pheno_teds$samp_prev),3)

pheno_teds$h2_obs<-paste0(pheno_teds$h2_obs," (", pheno_teds$h2_se,")")
pheno_teds$h2_se<-NULL
pheno_teds$h2_liab[!is.na(pheno_teds$Ncases)]<-paste0(pheno_teds$h2_liab[!is.na(pheno_teds$Ncases)]," (", pheno_teds$h2_liab_se[!is.na(pheno_teds$Ncases)],")")
pheno_teds$h2_liab_se<-NULL
pheno_teds$intercept<-paste0(pheno_teds$intercept," (", pheno_teds$intercept_se,")")
pheno_teds$intercept_se<-NULL

pheno_teds$trait<-c("ADHD (mixed ancestry)",'BMI','Educational Attainment','Height')
pheno_teds<-pheno_teds[match(teds_dat$gwas,pheno_teds$Code),]

pheno_teds<-pheno_teds[,c('Target_Phenotype','Code','trait','year','PMID','Ncases','Ncontrols','sample_size_discovery','h2_obs','h2_liab','intercept','lambda')]
names(pheno_teds)<-c('Target Phenotype','Code','GWAS Phenotype','Year','PMID','Ncase','Ncontrol','N','h2_obs','h2_liab','Intercept','Lambda')

pheno_teds$PMID[2]<-30124842
pheno_teds$PMID[4]<-30478444

write.csv(pheno_teds, '/users/k1806347/brc_scratch/Data/GWAS_sumstats/TEDS_phenotype_GWAS_descrip.csv', row.names=F, quote=F)
Show GWAS for TEDS phenotypes
| Target Phenotype | Code | GWAS Phenotype | Year | PMID | Ncase | Ncontrol | N | h2-obs (SE) | h2-liab (SE) | Intercept | Lambda |
|---|---|---|---|---|---|---|---|---|---|---|---|
| Height | HEIG03 | height | 2014 | 25282103 | NA | NA | 253288 | 0.312 (0.0141) | NA | 1.3254 (0.0185) | 2.0007 |
| BMI | BODY11 | BMI | 2018 | 30124842 | NA | NA | 681275 | 0.1908 (0.0053) | NA | 1.1864 (0.0206) | 2.7872 |
| GCSE | EDUC03 | years educational attainment | 2018 | 30038396 | NA | NA | 766345 | 0.1066 (0.0026) | NA | 1.0301 (0.0137) | 2.0940 |
| ADHD symptoms | ADHD04 | ADHD | 2017 | 30478444 | 20183 | 35191 | 55374 | 0.3635 (0.0227) | 0.426 (0.026) | 1.0295 (0.0096) | 1.2431 |
3.5 TWAS
Preparing table showing SNP-weight sets used
source('/users/k1806347/brc_scratch/Software/MyGit/GenoPred/config_used/Phenotype_prep.config')

library(data.table)
weights<-fread(paste0(TWAS_rep, '/snp_weight_list.txt'), header=F)$V1

pos_unique<-fread('/users/k1806347/brc_scratch/Data/1KG/Phase3/Predicted_expression/Tissue_specific.pos')
pos_unique$WGT<-paste0(pos_unique$PANEL,'/',gsub('.*/','',pos_unique$WGT))

weights_info<-NULL
pos_all<-NULL
for(weights_i in weights){
  pos<-fread(paste0(FUSION_dir,'/SNP-weights/',weights_i,'/',weights_i,'.pos'))

  if(grepl('CMC', weights_i) == T){
    sample_i<-'CMC'
    tissue_i<-'Brain:DLPFC'
  }
  if(grepl('NTR', weights_i) == T){
    sample_i<-'NTR'
    tissue_i<-'Peripheral Blood'
  }
  if(grepl('YFS', weights_i) == T){
    sample_i<-'YFS'
    tissue_i<-'Whole Blood'
  }
  if(grepl('METSIM', weights_i) == T){
    sample_i<-'METSIM'
    tissue_i<-'Adipose'
  }
  if(grepl('CMC|NTR|YFS|METSIM', weights_i) == F){
    sample_i<-'GTEx'
    tissue_i<-gsub('_',' ',weights_i)
  }

  weights_info<-rbind(weights_info, data.frame(Set=weights_i,
                                               Sample=sample_i,
                                               Tissue=tissue_i,
                                               Type='Expression',
                                               N_indiv=pos$N[1],
                                               N_feat=dim(pos)[1],
                                               N_feat_spec=sum(pos$WGT %in% pos_unique$WGT)))

  pos_all<-rbind(pos_all, pos)
}

dim(pos_all) # 260598
length(unique(pos_all$ID)) # 26434

weights_info$Type<-as.character(weights_info$Type)
weights_info$Type[weights_info$Set=='CMC.BRAIN.RNASEQ_SPLICING']<-'Splicing'

write.csv(weights_info, '/users/k1806347/brc_scratch/Analyses/GeRS_comparison/snp_weights_table.csv', row.names=F, quote=F)
Show SNP-weight characteristics
| Set | Sample | Tissue | Type | N_indiv | N_feat | N_feat_spec |
|---|---|---|---|---|---|---|
| Adipose_Subcutaneous | GTEx | Adipose Subcutaneous | Expression | 385 | 8192 | 3917 |
| Adipose_Visceral_Omentum | GTEx | Adipose Visceral Omentum | Expression | 313 | 6173 | 2693 |
| Adrenal_Gland | GTEx | Adrenal Gland | Expression | 175 | 4520 | 1988 |
| Artery_Aorta | GTEx | Artery Aorta | Expression | 267 | 6462 | 2949 |
| Artery_Coronary | GTEx | Artery Coronary | Expression | 152 | 3247 | 1310 |
| Artery_Tibial | GTEx | Artery Tibial | Expression | 388 | 8223 | 4041 |
| Brain_Amygdala | GTEx | Brain Amygdala | Expression | 88 | 1836 | 794 |
| Brain_Anterior_cingulate_cortex_BA24 | GTEx | Brain Anterior cingulate cortex BA24 | Expression | 109 | 2709 | 1286 |
| Brain_Caudate_basal_ganglia | GTEx | Brain Caudate basal ganglia | Expression | 144 | 3660 | 1778 |
| Brain_Cerebellar_Hemisphere | GTEx | Brain Cerebellar Hemisphere | Expression | 125 | 4407 | 2238 |
| Brain_Cerebellum | GTEx | Brain Cerebellum | Expression | 154 | 5854 | 2991 |
| Brain_Cortex | GTEx | Brain Cortex | Expression | 136 | 4011 | 1932 |
| Brain_Frontal_Cortex_BA9 | GTEx | Brain Frontal Cortex BA9 | Expression | 118 | 3143 | 1531 |
| Brain_Hippocampus | GTEx | Brain Hippocampus | Expression | 111 | 2294 | 1051 |
| Brain_Hypothalamus | GTEx | Brain Hypothalamus | Expression | 108 | 2314 | 1071 |
| Brain_Nucleus_accumbens_basal_ganglia | GTEx | Brain Nucleus accumbens basal ganglia | Expression | 130 | 3239 | 1584 |
| Brain_Putamen_basal_ganglia | GTEx | Brain Putamen basal ganglia | Expression | 111 | 2817 | 1316 |
| Brain_Spinal_cord_cervical_c-1 | GTEx | Brain Spinal cord cervical c-1 | Expression | 83 | 2005 | 853 |
| Brain_Substantia_nigra | GTEx | Brain Substantia nigra | Expression | 80 | 1603 | 711 |
| Breast_Mammary_Tissue | GTEx | Breast Mammary Tissue | Expression | 251 | 5043 | 2199 |
| Cells_EBV-transformed_lymphocytes | GTEx | Cells EBV-transformed lymphocytes | Expression | 117 | 2757 | 1004 |
| Cells_Transformed_fibroblasts | GTEx | Cells Transformed fibroblasts | Expression | 300 | 7352 | 3458 |
| CMC.BRAIN.RNASEQ | CMC | Brain:DLPFC | Expression | 452 | 5419 | 2637 |
| CMC.BRAIN.RNASEQ_SPLICING | CMC | Brain:DLPFC | Splicing | 452 | 7771 | 3413 |
| Colon_Sigmoid | GTEx | Colon Sigmoid | Expression | 203 | 4873 | 2161 |
| Colon_Transverse | GTEx | Colon Transverse | Expression | 246 | 5315 | 2310 |
| Esophagus_Gastroesophageal_Junction | GTEx | Esophagus Gastroesophageal Junction | Expression | 213 | 4887 | 2148 |
| Esophagus_Mucosa | GTEx | Esophagus Mucosa | Expression | 358 | 8060 | 3794 |
| Esophagus_Muscularis | GTEx | Esophagus Muscularis | Expression | 335 | 7772 | 3711 |
| Heart_Atrial_Appendage | GTEx | Heart Atrial Appendage | Expression | 264 | 5670 | 2606 |
| Heart_Left_Ventricle | GTEx | Heart Left Ventricle | Expression | 272 | 5081 | 2207 |
| Liver | GTEx | Liver | Expression | 153 | 2913 | 1231 |
| Lung | GTEx | Lung | Expression | 383 | 7775 | 3514 |
| METSIM.ADIPOSE.RNASEQ | METSIM | Adipose | Expression | 563 | 4671 | 1560 |
| Minor_Salivary_Gland | GTEx | Minor Salivary Gland | Expression | 85 | 1821 | 712 |
| Muscle_Skeletal | GTEx | Muscle Skeletal | Expression | 491 | 7408 | 3515 |
| Nerve_Tibial | GTEx | Nerve Tibial | Expression | 361 | 9656 | 5014 |
| NTR.BLOOD.RNAARR | NTR | Peripheral Blood | Expression | 1247 | 2454 | 724 |
| Ovary | GTEx | Ovary | Expression | 122 | 2808 | 1302 |
| Pancreas | GTEx | Pancreas | Expression | 220 | 5093 | 2270 |
| Pituitary | GTEx | Pituitary | Expression | 157 | 4401 | 2102 |
| Prostate | GTEx | Prostate | Expression | 132 | 2796 | 1222 |
| Skin_Not_Sun_Exposed_Suprapubic | GTEx | Skin Not Sun Exposed Suprapubic | Expression | 335 | 7457 | 3637 |
| Skin_Sun_Exposed_Lower_leg | GTEx | Skin Sun Exposed Lower leg | Expression | 414 | 8878 | 4486 |
| Small_Intestine_Terminal_Ileum | GTEx | Small Intestine Terminal Ileum | Expression | 122 | 2878 | 1115 |
| Spleen | GTEx | Spleen | Expression | 146 | 4496 | 1690 |
| Stomach | GTEx | Stomach | Expression | 237 | 4455 | 1865 |
| Testis | GTEx | Testis | Expression | 225 | 9252 | 5860 |
| Thyroid | GTEx | Thyroid | Expression | 399 | 9825 | 5257 |
| Uterus | GTEx | Uterus | Expression | 101 | 2134 | 892 |
| Vagina | GTEx | Vagina | Expression | 106 | 2012 | 783 |
| Whole_Blood | GTEx | Whole Blood | Expression | 369 | 6006 | 1834 |
| YFS.BLOOD.RNAARR | YFS | Whole Blood | Expression | 1264 | 4700 | 1688 |
Preparing table showing TWAS descriptives
source('/users/k1806347/brc_scratch/Software/MyGit/GenoPred/config_used/Phenotype_prep.config')

library(data.table)
weights<-fread(paste0(TWAS_rep, '/snp_weight_list.txt'), header=F)$V1
pheno=c('Depression','Intelligence','BMI','Height','T2D','CAD','IBD','MultiScler','RheuArth','BMI','Educational Attainment','ADHD symptoms')
sample=c('UKB','UKB','UKB','Both','UKB','UKB','UKB','UKB','UKB','TEDS','TEDS','TEDS')
gwas=c('DEPR06','COLL01','BODY03','HEIG03','DIAB05','COAD01','CROH01','SCLE02','RHEU01','BODY11', 'EDUC03', 'ADHD04')

twas_descript<-NULL
for(i in 1:length(gwas)){
  twas<-fread(paste0(TWAS_rep,'/',gwas[i],'_withCOLOC/',gwas[i],'_res_GW.txt'))

  twas_descript<-rbind(twas_descript, data.frame(Sample=sample[i],
                                                 Target_Phenotype=pheno[i],
                                                 GWAS=gwas[i],
                                                 Nfeat=dim(twas)[1],
                                                 Nfeat_imp=sum(!is.na(twas$TWAS.P))))
}

twas_descript<-twas_descript[order(twas_descript$Sample),]

write.csv(twas_descript, '/users/k1806347/brc_scratch/Analyses/GeRS_comparison/twas_descript_table.csv', row.names=F, quote=F)
Show TWAS descriptives
| Sample | Target_Phenotype | GWAS | Nfeat | Nfeat_imp |
|---|---|---|---|---|
| UKB | Depression | DEPR06 | 260598 | 259237 |
| UKB | Intelligence | COLL01 | 260598 | 254147 |
| UKB | BMI | BODY03 | 260598 | 256091 |
| UKB | T2D | DIAB05 | 260598 | 260115 |
| UKB | CAD | COAD01 | 260598 | 259656 |
| UKB | IBD | CROH01 | 260598 | 258900 |
| UKB | MultiScler | SCLE02 | 260598 | 1194 |
| UKB | RheuArth | RHEU01 | 260598 | 259008 |
| Both | Height | HEIG03 | 260598 | 256037 |
| TEDS | BMI | BODY11 | 260598 | 256109 |
| TEDS | Educational Attainment | EDUC03 | 260598 | 260171 |
| TEDS | ADHD symptoms | ADHD04 | 260598 | 254736 |
3.6 Gene expression risk scores (GeRS)
TWAS integrates GWAS summary statistics with multi-SNP predictors of gene expression (SNP-weights) to infer gene expression associations. Multi-SNP predictors in combination with individual-level genotype data can also be used to predict the expression level of genes within an each individual. GeRS are calculated as the TWAS-effect size weighted sum of predicted gene expression levels in each individual.
This study used SNP-weights derived from multiple panels capturing eQTL effects across a range of adult tissues. SNP-weights were downloaded from the FUSION website. TWAS was performed using FUSION and SNP-weights were used to calculated predicted expression levels using PLINK. GeRS for each panel were then calculated in R. To account for the correlation between the predicted expression of nearby features due to LD, feature clumping was used to remove features within 5Mb of lead features with a predicted expression r^2 of >0.9. Due to the complex LD structure within the MHC region, only the lead feature within this region was retained.
TWAS, gene expression prediction and GeRS calculations were carried out using LD and MAF estimations from an ancestry matched reference genotype dataset. The same SNP-weights are used to predict expression levels regardless of the target samples, using MAF imputation to account for missing variation. Predicted expression levels for each gene are then standardised based on the ancestry-matched mean and standard deviation of expression. Clumping of features is performed using predicted expression level in the reference sample.
The code used to prepare the reference data required for calculating GeRS can be found here. The code used for calculating predicted expression levels in the target samples can be found here
Calculating GeRS in samples
###
# UKBB
###

. /users/k1806347/brc_scratch/Software/MyGit/GenoPred/config_used/Target_scoring.config

mkdir -p ${UKBB_output}/GeRS_for_comparison/1KG_ref/EUR
> ${UKBB_output}/GeRS_for_comparison/1KG_ref/EUR/todo.txt

# Create variable listing phenotypes and corresponding GWAS
pheno=$(echo Depression Intelligence BMI Height T2D CAD IBD RheuArth)
gwas=$(echo DEPR06 COLL01 BODY03 HEIG03 DIAB05 COAD01 CROH01 RHEU01)

for i in $(seq 1 8);do
  pheno_i=$(echo ${pheno} | cut -f ${i} -d ' ')
  gwas_i=$(echo ${gwas} | cut -f ${i} -d ' ')

  for weights in $(cat ~/brc_scratch/Data/TWAS_sumstats/FUSION/snp_weight_list.txt);do
    if [ ! -f ${UKBB_output}/GeRS_for_comparison/1KG_ref/EUR/${weights}/UKBB.w_hm3.EUR.${weights}.${gwas_i}.fiprofile ]; then
      echo $gwas_i $pheno_i $weights >> ${UKBB_output}/GeRS_for_comparison/1KG_ref/EUR/todo.txt
    fi
  done

done

for i in $(seq 1 $(wc -l ${UKBB_output}/GeRS_for_comparison/1KG_ref/EUR/todo.txt | cut -d ' ' -f 1));do
gwas=$(awk -v var="$i" 'NR == var {print $1}' ${UKBB_output}/GeRS_for_comparison/1KG_ref/EUR/todo.txt)
pheno=$(awk -v var="$i" 'NR == var {print $2}' ${UKBB_output}/GeRS_for_comparison/1KG_ref/EUR/todo.txt)
weights=$(awk -v var="$i" 'NR == var {print $3}' ${UKBB_output}/GeRS_for_comparison/1KG_ref/EUR/todo.txt)

sbatch -p brc,shared --mem 10G -n 1 /users/k1806347/brc_scratch/Software/Rscript.sh /users/k1806347/brc_scratch/Software/MyGit/GenoPred/Scripts/scaled_functionally_informed_risk_scorer/scaled_functionally_informed_risk_scorer.R \
  --targ_feature_pred ${UKBB_output}/Predicted_expression/FUSION/EUR/${weights}/UKBB.w_hm3.QCd.AllSNP.FUSION.${weights}.predictions.gz \
  --target_keep ${UKBB_output}/Phenotype/PRS_comp_subset/UKBB.${pheno}.txt \
  --ref_score ${Geno_1KG_dir}/Score_files_for_functionally_informed_risk_scores/${gwas}/1KGPhase3.w_hm3.EUR.FUSION.${gwas}.${weights}.score \
  --ref_scale ${Geno_1KG_dir}/Score_files_for_functionally_informed_risk_scores/${gwas}/1KGPhase3.w_hm3.EUR.FUSION.${gwas}.${weights}.scale \
  --pheno_name ${gwas} \
  --n_cores 1 \
  --pigz ${pigz_binary} \
  --output ${UKBB_output}/GeRS_for_comparison/1KG_ref/EUR/${weights}/UKBB.w_hm3.EUR.${weights}.${gwas}

sleep 20
done

###
# TEDS
###

. /users/k1806347/brc_scratch/Software/MyGit/GenoPred/config_used/Target_scoring.config

mkdir -p ${TEDS_output_dir}/FunctionallyInformedPolygenicScores/EUR
> ${TEDS_output_dir}/FunctionallyInformedPolygenicScores/EUR/todo.txt

# Create variable listing phenotypes and corresponding GWAS
gwas=$(echo HEIG03 EDUC03 ADHD04 BODY11)

for i in $(seq 1 4);do
  gwas_i=$(echo ${gwas} | cut -f ${i} -d ' ')

  for weights in $(cat ~/brc_scratch/Data/TWAS_sumstats/FUSION/snp_weight_list.txt);do
    if [ ! -f ${TEDS_output_dir}/FunctionallyInformedPolygenicScores/EUR/${weights}/TEDS.w_hm3.EUR.${weights}.${gwas_i}.fiprofile ]; then
      echo $gwas_i $weights >> ${TEDS_output_dir}/FunctionallyInformedPolygenicScores/EUR/todo.txt
    fi
  done

done

for i in $(seq 1 $(wc -l ${TEDS_output_dir}/FunctionallyInformedPolygenicScores/EUR/todo.txt | cut -d ' ' -f 1));do
gwas=$(awk -v var="$i" 'NR == var {print $1}' ${TEDS_output_dir}/FunctionallyInformedPolygenicScores/EUR/todo.txt)
weights=$(awk -v var="$i" 'NR == var {print $2}' ${TEDS_output_dir}/FunctionallyInformedPolygenicScores/EUR/todo.txt)

sbatch -p brc,shared --mem 10G -n 1 /users/k1806347/brc_scratch/Software/Rscript.sh /users/k1806347/brc_scratch/Software/MyGit/GenoPred/Scripts/scaled_functionally_informed_risk_scorer/scaled_functionally_informed_risk_scorer.R \
  --targ_feature_pred ${TEDS_output_dir}/Predicted_expression/FUSION/EUR/${weights}/TEDS.w_hm3.QCd.AllSNP.FUSION.${weights}.predictions.gz \
  --ref_score ${Geno_1KG_dir}/Score_files_for_functionally_informed_risk_scores/${gwas}/1KGPhase3.w_hm3.EUR.FUSION.${gwas}.${weights}.score \
  --ref_scale ${Geno_1KG_dir}/Score_files_for_functionally_informed_risk_scores/${gwas}/1KGPhase3.w_hm3.EUR.FUSION.${gwas}.${weights}.scale \
  --pheno_name ${gwas} \
  --n_cores 1 \
  --pigz ${pigz_binary} \
  --output ${TEDS_output_dir}/FunctionallyInformedPolygenicScores/EUR/${weights}/TEDS.w_hm3.EUR.${weights}.${gwas}

sleep 5
done
Calculating GeRS in samples using PP4 to filter features
###
# UKBB
###

. /users/k1806347/brc_scratch/Software/MyGit/GenoPred/config_used/Target_scoring.config

mkdir -p ${UKBB_output}/GeRS_for_comparison/1KG_ref_withCOLOC/EUR
> ${UKBB_output}/GeRS_for_comparison/1KG_ref_withCOLOC/EUR/todo.txt

# Create variable listing phenotypes and corresponding GWAS
pheno=$(echo Depression Intelligence BMI Height T2D CAD IBD RheuArth)
gwas=$(echo DEPR06 COLL01 BODY03 HEIG03 DIAB05 COAD01 CROH01 RHEU01)

for i in $(seq 1 8);do
  pheno_i=$(echo ${pheno} | cut -f ${i} -d ' ')
  gwas_i=$(echo ${gwas} | cut -f ${i} -d ' ')

  for weights in $(cat ~/brc_scratch/Data/TWAS_sumstats/FUSION/snp_weight_list.txt);do
    if [ ! -f ${UKBB_output}/GeRS_for_comparison/1KG_ref_withCOLOC/EUR/${weights}/UKBB.w_hm3.EUR.${weights}.${gwas_i}.fiprofile ]; then
      echo $gwas_i $pheno_i $weights >> ${UKBB_output}/GeRS_for_comparison/1KG_ref_withCOLOC/EUR/todo.txt
    fi
  done

done

for i in $(seq 1 $(wc -l ${UKBB_output}/GeRS_for_comparison/1KG_ref_withCOLOC/EUR/todo.txt | cut -d ' ' -f 1));do
gwas=$(awk -v var="$i" 'NR == var {print $1}' ${UKBB_output}/GeRS_for_comparison/1KG_ref_withCOLOC/EUR/todo.txt)
pheno=$(awk -v var="$i" 'NR == var {print $2}' ${UKBB_output}/GeRS_for_comparison/1KG_ref_withCOLOC/EUR/todo.txt)
weights=$(awk -v var="$i" 'NR == var {print $3}' ${UKBB_output}/GeRS_for_comparison/1KG_ref_withCOLOC/EUR/todo.txt)

sbatch -p brc,shared --mem 10G -n 1 /users/k1806347/brc_scratch/Software/Rscript.sh /users/k1806347/brc_scratch/Software/MyGit/GenoPred/Scripts/scaled_functionally_informed_risk_scorer/scaled_functionally_informed_risk_scorer.R \
  --targ_feature_pred ${UKBB_output}/Predicted_expression/FUSION/EUR/${weights}/UKBB.w_hm3.QCd.AllSNP.FUSION.${weights}.predictions.gz \
  --target_keep ${UKBB_output}/Phenotype/PRS_comp_subset/UKBB.${pheno}.txt \
  --ref_score ${Geno_1KG_dir}/Score_files_for_functionally_informed_risk_scores/${gwas}_COLOC_PP4/1KGPhase3.w_hm3.EUR.FUSION.${gwas}.${weights}.score \
  --ref_scale ${Geno_1KG_dir}/Score_files_for_functionally_informed_risk_scores/${gwas}_COLOC_PP4/1KGPhase3.w_hm3.EUR.FUSION.${gwas}.${weights}.scale \
  --pheno_name ${gwas} \
  --n_cores 1 \
  --pigz ${pigz_binary} \
  --output ${UKBB_output}/GeRS_for_comparison/1KG_ref_withCOLOC/EUR/${weights}/UKBB.w_hm3.EUR.${weights}.${gwas}

sleep 20
done

###
# TEDS
###

. /users/k1806347/brc_scratch/Software/MyGit/GenoPred/config_used/Target_scoring.config

mkdir -p ${TEDS_output_dir}/FunctionallyInformedPolygenicScores_withCOLOC/EUR
> ${TEDS_output_dir}/FunctionallyInformedPolygenicScores_withCOLOC/EUR/todo.txt

# Create variable listing phenotypes and corresponding GWAS
gwas=$(echo HEIG03 EDUC03 ADHD04 BODY11)

for i in $(seq 1 4);do
  gwas_i=$(echo ${gwas} | cut -f ${i} -d ' ')

  for weights in $(cat ~/brc_scratch/Data/TWAS_sumstats/FUSION/snp_weight_list.txt);do
    if [ ! -f ${TEDS_output_dir}/FunctionallyInformedPolygenicScores_withCOLOC/EUR/${weights}/TEDS.w_hm3.EUR.${weights}.${gwas_i}.fiprofile ]; then
      echo $gwas_i $weights >> ${TEDS_output_dir}/FunctionallyInformedPolygenicScores_withCOLOC/EUR/todo.txt
    fi
  done

done

for i in $(seq 1 $(wc -l ${TEDS_output_dir}/FunctionallyInformedPolygenicScores_withCOLOC/EUR/todo.txt | cut -d ' ' -f 1));do
gwas=$(awk -v var="$i" 'NR == var {print $1}' ${TEDS_output_dir}/FunctionallyInformedPolygenicScores_withCOLOC/EUR/todo.txt)
weights=$(awk -v var="$i" 'NR == var {print $2}' ${TEDS_output_dir}/FunctionallyInformedPolygenicScores_withCOLOC/EUR/todo.txt)

sbatch -p brc,shared --mem 10G -n 1 /users/k1806347/brc_scratch/Software/Rscript.sh /users/k1806347/brc_scratch/Software/MyGit/GenoPred/Scripts/scaled_functionally_informed_risk_scorer/scaled_functionally_informed_risk_scorer.R \
  --targ_feature_pred ${TEDS_output_dir}/Predicted_expression/FUSION/EUR/${weights}/TEDS.w_hm3.QCd.AllSNP.FUSION.${weights}.predictions.gz \
  --ref_score ${Geno_1KG_dir}/Score_files_for_functionally_informed_risk_scores/${gwas}_COLOC_PP4/1KGPhase3.w_hm3.EUR.FUSION.${gwas}.${weights}.score \
  --ref_scale ${Geno_1KG_dir}/Score_files_for_functionally_informed_risk_scores/${gwas}_COLOC_PP4/1KGPhase3.w_hm3.EUR.FUSION.${gwas}.${weights}.scale \
  --pheno_name ${gwas} \
  --n_cores 1 \
  --pigz ${pigz_binary} \
  --output ${TEDS_output_dir}/FunctionallyInformedPolygenicScores_withCOLOC/EUR/${weights}/TEDS.w_hm3.EUR.${weights}.${gwas}

sleep 5
done
Calculating GeRS in samples using tissue specific features
###
# UKBB
###

. /users/k1806347/brc_scratch/Software/MyGit/GenoPred/config_used/Target_scoring.config

mkdir -p ${UKBB_output}/GeRS_for_comparison/1KG_ref/EUR
> ${UKBB_output}/GeRS_for_comparison/1KG_ref/EUR/todo.TissueSpecific.txt

# Create variable listing phenotypes and corresponding GWAS
pheno=$(echo Depression Intelligence BMI Height T2D CAD IBD RheuArth)
gwas=$(echo DEPR06 COLL01 BODY03 HEIG03 DIAB05 COAD01 CROH01 RHEU01)

for i in $(seq 1 8);do
  pheno_i=$(echo ${pheno} | cut -f ${i} -d ' ')
  gwas_i=$(echo ${gwas} | cut -f ${i} -d ' ')

  for weights in $(cat ~/brc_scratch/Data/TWAS_sumstats/FUSION/snp_weight_list.txt);do
    if [ ! -f ${UKBB_output}/GeRS_for_comparison/1KG_ref/EUR/${weights}/UKBB.w_hm3.EUR.TissueSpecific.${weights}.${gwas_i}.fiprofile ]; then
      echo $gwas_i $pheno_i $weights >> ${UKBB_output}/GeRS_for_comparison/1KG_ref/EUR/todo.TissueSpecific.txt
    fi
  done
done

for i in $(seq 1 $(wc -l ${UKBB_output}/GeRS_for_comparison/1KG_ref/EUR/todo.TissueSpecific.txt | cut -d ' ' -f 1));do
gwas=$(awk -v var="$i" 'NR == var {print $1}' ${UKBB_output}/GeRS_for_comparison/1KG_ref/EUR/todo.TissueSpecific.txt)
pheno=$(awk -v var="$i" 'NR == var {print $2}' ${UKBB_output}/GeRS_for_comparison/1KG_ref/EUR/todo.TissueSpecific.txt)
weights=$(awk -v var="$i" 'NR == var {print $3}' ${UKBB_output}/GeRS_for_comparison/1KG_ref/EUR/todo.TissueSpecific.txt)

sbatch -p brc,shared --mem 10G -n 1 /users/k1806347/brc_scratch/Software/Rscript.sh /users/k1806347/brc_scratch/Software/MyGit/GenoPred/Scripts/scaled_functionally_informed_risk_scorer/scaled_functionally_informed_risk_scorer.R \
  --targ_feature_pred ${UKBB_output}/Predicted_expression/FUSION/EUR/${weights}/UKBB.w_hm3.QCd.AllSNP.FUSION.${weights}.predictions.gz \
  --target_keep ${UKBB_output}/Phenotype/PRS_comp_subset/UKBB.${pheno}.txt \
  --ref_score ${Geno_1KG_dir}/Score_files_for_functionally_informed_risk_scores/${gwas}/1KGPhase3.w_hm3.EUR.FUSION.TissueSpecific.${gwas}.${weights}.score \
  --ref_scale ${Geno_1KG_dir}/Score_files_for_functionally_informed_risk_scores/${gwas}/1KGPhase3.w_hm3.EUR.FUSION.TissueSpecific.${gwas}.${weights}.scale \
  --pheno_name ${gwas} \
  --n_cores 1 \
  --pigz ${pigz_binary} \
  --output ${UKBB_output}/GeRS_for_comparison/1KG_ref/EUR/${weights}/UKBB.w_hm3.EUR.TissueSpecific.${weights}.${gwas}

sleep 20
done

###
# TEDS
###

. /users/k1806347/brc_scratch/Software/MyGit/GenoPred/config_used/Target_scoring.config

mkdir -p ${TEDS_output_dir}/FunctionallyInformedPolygenicScores/EUR
> ${TEDS_output_dir}/FunctionallyInformedPolygenicScores/EUR/todo.TissueSpecific.txt

# Create variable listing phenotypes and corresponding GWAS
gwas=$(echo HEIG03 EDUC03 ADHD04 BODY11)

for i in $(seq 1 4);do
  gwas_i=$(echo ${gwas} | cut -f ${i} -d ' ')

  for weights in $(cat ~/brc_scratch/Data/TWAS_sumstats/FUSION/snp_weight_list.txt);do
    if [ ! -f ${TEDS_output_dir}/FunctionallyInformedPolygenicScores/EUR/${weights}/TEDS.w_hm3.EUR.TissueSpecific.${weights}.${gwas_i}.fiprofile ]; then
      echo $gwas_i $weights >> ${TEDS_output_dir}/FunctionallyInformedPolygenicScores/EUR/todo.TissueSpecific.txt
    fi
  done

done

for i in $(seq 1 $(wc -l ${TEDS_output_dir}/FunctionallyInformedPolygenicScores/EUR/todo.TissueSpecific.txt | cut -d ' ' -f 1));do
gwas=$(awk -v var="$i" 'NR == var {print $1}' ${TEDS_output_dir}/FunctionallyInformedPolygenicScores/EUR/todo.TissueSpecific.txt)
weights=$(awk -v var="$i" 'NR == var {print $2}' ${TEDS_output_dir}/FunctionallyInformedPolygenicScores/EUR/todo.TissueSpecific.txt)

sbatch -p brc,shared --mem 10G -n 1 /users/k1806347/brc_scratch/Software/Rscript.sh /users/k1806347/brc_scratch/Software/MyGit/GenoPred/Scripts/scaled_functionally_informed_risk_scorer/scaled_functionally_informed_risk_scorer.R \
  --targ_feature_pred ${TEDS_output_dir}/Predicted_expression/FUSION/EUR/${weights}/TEDS.w_hm3.QCd.AllSNP.FUSION.${weights}.predictions.gz \
  --ref_score ${Geno_1KG_dir}/Score_files_for_functionally_informed_risk_scores/${gwas}/1KGPhase3.w_hm3.EUR.FUSION.TissueSpecific.${gwas}.${weights}.score \
  --ref_scale ${Geno_1KG_dir}/Score_files_for_functionally_informed_risk_scores/${gwas}/1KGPhase3.w_hm3.EUR.FUSION.TissueSpecific.${gwas}.${weights}.scale \
  --pheno_name ${gwas} \
  --n_cores 1 \
  --pigz ${pigz_binary} \
  --output ${TEDS_output_dir}/FunctionallyInformedPolygenicScores/EUR/${weights}/TEDS.w_hm3.EUR.TissueSpecific.${weights}.${gwas}

sleep 5
done
Calculating GeRS in samples using colocalised features
###
# UKBB
###

. /users/k1806347/brc_scratch/Software/MyGit/GenoPred/config_used/Target_scoring.config

mkdir -p ${UKBB_output}/GeRS_for_comparison/1KG_ref_pT_withColoc/EUR
> ${UKBB_output}/GeRS_for_comparison/1KG_ref_pT_withColoc/EUR/todo.txt

# Create variable listing phenotypes and corresponding GWAS
pheno=$(echo Depression Intelligence BMI Height T2D CAD IBD RheuArth)
gwas=$(echo DEPR06 COLL01 BODY03 HEIG03 DIAB05 COAD01 CROH01 RHEU01)

for i in $(seq 1 8);do
  pheno_i=$(echo ${pheno} | cut -f ${i} -d ' ')
  gwas_i=$(echo ${gwas} | cut -f ${i} -d ' ')

  for weights in $(cat ~/brc_scratch/Data/TWAS_sumstats/FUSION/snp_weight_list.txt);do
    if [ ! -f ${UKBB_output}/GeRS_for_comparison/1KG_ref_pT_withColoc/EUR/${weights}/UKBB.w_hm3.EUR.${weights}.${gwas_i}.fiprofile ]; then
      echo $gwas_i $pheno_i $weights >> ${UKBB_output}/GeRS_for_comparison/1KG_ref_pT_withColoc/EUR/todo.txt
    fi
  done

done

for i in $(seq 1 $(wc -l ${UKBB_output}/GeRS_for_comparison/1KG_ref_pT_withColoc/EUR/todo.txt | cut -d ' ' -f 1));do
gwas=$(awk -v var="$i" 'NR == var {print $1}' ${UKBB_output}/GeRS_for_comparison/1KG_ref_pT_withColoc/EUR/todo.txt)
pheno=$(awk -v var="$i" 'NR == var {print $2}' ${UKBB_output}/GeRS_for_comparison/1KG_ref_pT_withColoc/EUR/todo.txt)
weights=$(awk -v var="$i" 'NR == var {print $3}' ${UKBB_output}/GeRS_for_comparison/1KG_ref_pT_withColoc/EUR/todo.txt)

sbatch -p brc,shared --mem 10G -n 1 /users/k1806347/brc_scratch/Software/Rscript.sh /users/k1806347/brc_scratch/Software/MyGit/GenoPred/Scripts/scaled_functionally_informed_risk_scorer/scaled_functionally_informed_risk_scorer.R \
  --targ_feature_pred ${UKBB_output}/Predicted_expression/FUSION/EUR/${weights}/UKBB.w_hm3.QCd.AllSNP.FUSION.${weights}.predictions.gz \
  --target_keep ${UKBB_output}/Phenotype/PRS_comp_subset/UKBB.${pheno}.txt \
  --ref_score ${Geno_1KG_dir}/Score_files_for_functionally_informed_risk_scores/${gwas}_pT_withColoc/1KGPhase3.w_hm3.EUR.FUSION.${gwas}.${weights}.score \
  --ref_scale ${Geno_1KG_dir}/Score_files_for_functionally_informed_risk_scores/${gwas}_pT_withColoc/1KGPhase3.w_hm3.EUR.FUSION.${gwas}.${weights}.scale \
  --pheno_name ${gwas} \
  --n_cores 1 \
  --pigz ${pigz_binary} \
  --output ${UKBB_output}/GeRS_for_comparison/1KG_ref_pT_withColoc/EUR/${weights}/UKBB.w_hm3.EUR.${weights}.${gwas}

sleep 20
done

###
# TEDS
###

. /users/k1806347/brc_scratch/Software/MyGit/GenoPred/config_used/Target_scoring.config

mkdir -p ${TEDS_output_dir}/FunctionallyInformedPolygenicScores_pT_withColoc/EUR
> ${TEDS_output_dir}/FunctionallyInformedPolygenicScores_pT_withColoc/EUR/todo.txt

# Create variable listing phenotypes and corresponding GWAS
gwas=$(echo HEIG03 EDUC03 ADHD04 BODY11)

for i in $(seq 1 4);do
  gwas_i=$(echo ${gwas} | cut -f ${i} -d ' ')

  for weights in $(cat ~/brc_scratch/Data/TWAS_sumstats/FUSION/snp_weight_list.txt);do
    if [ ! -f ${TEDS_output_dir}/FunctionallyInformedPolygenicScores_pT_withColoc/EUR/${weights}/TEDS.w_hm3.EUR.${weights}.${gwas_i}.fiprofile ]; then
      echo $gwas_i $weights >> ${TEDS_output_dir}/FunctionallyInformedPolygenicScores_pT_withColoc/EUR/todo.txt
    fi
  done

done

for i in $(seq 1 $(wc -l ${TEDS_output_dir}/FunctionallyInformedPolygenicScores_pT_withColoc/EUR/todo.txt | cut -d ' ' -f 1));do
gwas=$(awk -v var="$i" 'NR == var {print $1}' ${TEDS_output_dir}/FunctionallyInformedPolygenicScores_pT_withColoc/EUR/todo.txt)
weights=$(awk -v var="$i" 'NR == var {print $2}' ${TEDS_output_dir}/FunctionallyInformedPolygenicScores_pT_withColoc/EUR/todo.txt)

sbatch -p brc,shared --mem 10G -n 1 /users/k1806347/brc_scratch/Software/Rscript.sh /users/k1806347/brc_scratch/Software/MyGit/GenoPred/Scripts/scaled_functionally_informed_risk_scorer/scaled_functionally_informed_risk_scorer.R \
  --targ_feature_pred ${TEDS_output_dir}/Predicted_expression/FUSION/EUR/${weights}/TEDS.w_hm3.QCd.AllSNP.FUSION.${weights}.predictions.gz \
  --ref_score ${Geno_1KG_dir}/Score_files_for_functionally_informed_risk_scores/${gwas}_pT_withColoc/1KGPhase3.w_hm3.EUR.FUSION.${gwas}.${weights}.score \
  --ref_scale ${Geno_1KG_dir}/Score_files_for_functionally_informed_risk_scores/${gwas}_pT_withColoc/1KGPhase3.w_hm3.EUR.FUSION.${gwas}.${weights}.scale \
  --pheno_name ${gwas} \
  --n_cores 1 \
  --pigz ${pigz_binary} \
  --output ${TEDS_output_dir}/FunctionallyInformedPolygenicScores_pT_withColoc/EUR/${weights}/TEDS.w_hm3.EUR.${weights}.${gwas}

sleep 5
done
3.7 Functionally-informed polygenic scoring
Functionally informed polygenic scores were derived as follows:
- TWAS SNP-weight-stratified p-value thresholding and clumping (eQTL pT+clump)
Calculating GeRS in samples
# Set required variables
. /users/k1806347/brc_scratch/Software/MyGit/GenoPred/config_used/Target_scoring.config

#######
# UKBB
#######
# Create variable listing phenotypes and corresponding GWAS
pheno=$(echo Depression Intelligence BMI Height T2D CAD IBD RheuArth)
gwas=$(echo DEPR06 COLL01 BODY03 HEIG03 DIAB05 COAD01 CROH01 RHEU01)

# Calculate polygenic scores using 1KG reference
for i in $(seq 1 8);do
  pheno_i=$(echo ${pheno} | cut -f ${i} -d ' ')
  gwas_i=$(echo ${gwas} | cut -f ${i} -d ' ')

  sbatch --mem 10G -p brc,shared -J pT_clump /users/k1806347/brc_scratch/Software/Rscript.sh /users/k1806347/brc_scratch/Software/MyGit/GenoPred/Scripts/Scaled_polygenic_scorer/Scaled_polygenic_scorer.R \
    --target_plink_chr ${UKBB_output}/Genotype/Harmonised/UKBB.w_hm3.QCd.AllSNP.chr \
    --target_keep ${UKBB_output}/Phenotype/PRS_comp_subset/UKBB.${pheno_i}.txt \
    --ref_score ${Geno_1KG_dir}/Score_files_for_poylygenic_stratified_TWAS_Gene/${gwas_i}_withCOLOC/1KGPhase3.w_hm3.${gwas_i} \
    --ref_scale ${Geno_1KG_dir}/Score_files_for_poylygenic_stratified_TWAS_Gene/${gwas_i}_withCOLOC/1KGPhase3.w_hm3.${gwas_i}.EUR.scale \
    --ref_freq_chr ${Geno_1KG_dir}/freq_files/EUR/1KGPhase3.w_hm3.EUR.chr \
    --plink ${plink1_9} \
    --pheno_name ${gwas_i} \
    --output ${UKBB_output}/PRS_for_comparison/1KG_ref_withCOLOC/pt_clump_stratified_TWAS_Gene/${gwas_i}/UKBB.subset.w_hm3.${gwas_i}
done

#######
# TEDS
#######
# Create variable listing phenotypes and corresponding GWAS
gwas=$(echo HEIG03 EDUC03 ADHD04 BODY11)

# Calculate polygenic scores using 1KG reference
for i in $(seq 1 4);do
  gwas_i=$(echo ${gwas} | cut -f ${i} -d ' ')

  sbatch --mem 10G -p brc,shared -J pT_clump /users/k1806347/brc_scratch/Software/Rscript.sh /users/k1806347/brc_scratch/Software/MyGit/GenoPred/Scripts/Scaled_polygenic_scorer/Scaled_polygenic_scorer.R \
    --target_plink_chr ${TEDS_output_dir}/Genotype/Harmonised/TEDS.w_hm3.QCd.AllSNP.chr \
    --target_keep ${TEDS_output_dir}/Projected_PCs/Ancestry_idenitfier/TEDS.w_hm3.AllAncestry.EUR.keep \
    --ref_score ${Geno_1KG_dir}/Score_files_for_poylygenic_stratified_TWAS_Gene/${gwas_i}/1KGPhase3.w_hm3.${gwas_i} \
    --ref_scale ${Geno_1KG_dir}/Score_files_for_poylygenic_stratified_TWAS_Gene/${gwas_i}/1KGPhase3.w_hm3.${gwas_i}.EUR.scale \
    --ref_freq_chr ${Geno_1KG_dir}/freq_files/EUR/1KGPhase3.w_hm3.EUR.chr \
    --plink ${plink1_9} \
    --pheno_name ${gwas_i} \
    --output ${TEDS_output_dir}/PolygenicScores_stratified_TWAS_Gene/${gwas_i}/TEDS.subset.w_hm3.${gwas_i}
done
3.8 Functionally-agnostic polygenic scoring
Polygenic scores were derived using PRScs-auto, a Bayesian shrinkage method that I have shown to perform well previously.
Polygenic scores were derived using a reference standardised pipeline. The European subset of the 1KG reference was used (described here). In brief, all scores were derived using HapMap3 SNPs only, modelling LD based on the reference. Any HapMap3 missing in the target sample are imputed using the reference estimated allele frequency.
Polygenic scoring in target samples has been previously documented here
3.8.1 Derive pT+clump polygenic scores without retaining single variant in the MHC
Only do this as a sensitivity analysis for Rheumatoid arthritis
Show code
# Generate scoring files
. /users/k1806347/brc_scratch/Software/MyGit/GenoPred/config_used/Pipeline_prep.config

sbatch -p shared,brc --mem=6G /users/k1806347/brc_scratch/Software/Rscript.sh /users/k1806347/brc_scratch/Software/MyGit/GenoPred/Scripts/polygenic_score_file_creator/polygenic_score_file_creator.R \
  --ref_plink_chr ${Geno_1KG_dir}/1KGPhase3.w_hm3.chr \
  --ref_keep ${Geno_1KG_dir}/keep_files/EUR_samples.keep \
  --sumstats ${gwas_rep}/RHEU01.sumstats.gz \
  --plink ${plink1_9} \
  --memory 3000 \
  --prune_hla F \
  --output ${Geno_1KG_dir}/Score_files_for_poylygenic/RHEU01.noMHCClump/1KGPhase3.w_hm3.RHEU01.noMHCClump \
  --ref_pop_scale ${Geno_1KG_dir}/super_pop_keep.list

# Calculate scores in UKB
. /users/k1806347/brc_scratch/Software/MyGit/GenoPred/config_used/Target_scoring.config

sbatch --mem 10G -p brc,shared /users/k1806347/brc_scratch/Software/Rscript.sh /users/k1806347/brc_scratch/Software/MyGit/GenoPred/Scripts/Scaled_polygenic_scorer/Scaled_polygenic_scorer.R \
    --target_plink_chr ${UKBB_output}/Genotype/Harmonised/UKBB.w_hm3.QCd.AllSNP.chr \
    --target_keep ${UKBB_output}/Phenotype/PRS_comp_subset/UKBB.RheuArth.txt \
    --ref_score ${Geno_1KG_dir}/Score_files_for_poylygenic/RHEU01.noMHCClump/1KGPhase3.w_hm3.RHEU01.noMHCClump \
    --ref_scale ${Geno_1KG_dir}/Score_files_for_poylygenic/RHEU01.noMHCClump/1KGPhase3.w_hm3.RHEU01.noMHCClump.EUR.scale \
    --ref_freq_chr ${Geno_1KG_dir}/freq_files/EUR/1KGPhase3.w_hm3.EUR.chr \
    --plink ${plink1_9} \
    --pheno_name RHEU01 \
    --output ${UKBB_output}/PRS_for_comparison/1KG_ref/pt_clump/RHEU01.noMHCClump/UKBB.subset.w_hm3.RHEU01.noMHCClump
3.9 Estimating predictive ability
Models containing a single predictor were derived using generalised linear model (GLM). Models containing multiple predictors were derived using elastic-net regularisation to reduce the likelihood of overfitting and account for multicollinearity when modelling highly correlated predictors. Nested cross validation was used to estimate the variance explained by models to avoid overfitting. This involves an outer loop, splitting the data into training and test datasets, deriving the model using 10-fold cross validation in the training dataset, saving model predictions for the test dataset, combining the test predictions for each outer loop and estimating the variance explained.
Model building and evaluation was performed using an Rscript called Model_builder_V2_nested.R (more information here).
3.9.1 UK Biobank
Single-pT vs. Multi-pT
##############################
# Evaluating predictive utility of GeRS across multiple pTs individually and in combination
##############################
. /users/k1806347/brc_scratch/Software/MyGit/GenoPred/config_used/Target_scoring.config

# Make required directories
for pheno_i in $(echo Depression Intelligence BMI Height T2D CAD IBD MultiScler RheuArth);do
mkdir -p /users/k1806347/brc_scratch/Analyses/GeRS_comparison/UKBB_outcomes_for_prediction/${pheno_i}/Association_withGeRSs
done

# Create a file listing the predictors files
pheno=$(echo Depression Intelligence BMI Height T2D CAD IBD RheuArth)
gwas=$(echo DEPR06 COLL01 BODY03 HEIG03 DIAB05 COAD01 CROH01 RHEU01)
weights=$(cat ${TWAS_rep}/snp_weight_list.txt)

for i in $(seq 1 8);do
for weight in ${weights};do
pheno_i=$(echo ${pheno} | cut -f ${i} -d ' ')
gwas_i=$(echo ${gwas} | cut -f ${i} -d ' ')

cat > /users/k1806347/brc_scratch/Analyses/GeRS_comparison/UKBB_outcomes_for_prediction/${pheno_i}/Association_withGeRSs/UKBB.w_hm3.${weight}.${gwas_i}.EUR-GeRSs.predictor_groups <<EOF
predictors
${UKBB_output}/GeRS_for_comparison/1KG_ref/EUR/${weight}/UKBB.w_hm3.EUR.${weight}.${gwas_i}.fiprofile
EOF

done
done

# Derive and evaluate models
pheno=$(echo Depression Intelligence BMI Height T2D CAD IBD RheuArth)
gwas=$(echo DEPR06 COLL01 BODY03 HEIG03 DIAB05 COAD01 CROH01 RHEU01)
prev=$(echo 0.15 NA NA NA 0.05 0.03 0.013 0.00164 0.005)
weights=$(cat ${TWAS_rep}/snp_weight_list.txt)

# 1KG reference
for i in $(seq 1 8);do
for weight in ${weights};do
  pheno_i=$(echo ${pheno} | cut -f ${i} -d ' ')
  pheno_file_i=$(echo ${pheno_file} | cut -f ${i} -d ' ')
  gwas_i=$(echo ${gwas} | cut -f ${i} -d ' ')
  prev_i=$(echo ${prev} | cut -f ${i} -d ' ')

sbatch --mem 10G -n 2 -p brc,shared /users/k1806347/brc_scratch/Software/Rscript.sh /users/k1806347/brc_scratch/Software/MyGit/GenoPred/Scripts/Model_builder/Model_builder_V2_nested.R \
    --pheno ${UKBB_output}/Phenotype/PRS_comp_subset/UKBB.${pheno_i}.txt \
    --keep /users/k1806347/brc_scratch/Analyses/PRS_comparison/UKBB_outcomes_for_prediction/ukb18177_glanville_post_qc_id_list.UpdateIDs.fam \
    --out /users/k1806347/brc_scratch/Analyses/GeRS_comparison/UKBB_outcomes_for_prediction/${pheno_i}/Association_withGeRSs/UKBB.w_hm3.${weight}.${gwas_i}.EUR-GeRSs \
    --n_core 2 \
    --compare_predictors T \
    --assoc T \
    --outcome_pop_prev ${prev_i} \
    --predictors /users/k1806347/brc_scratch/Analyses/GeRS_comparison/UKBB_outcomes_for_prediction/${pheno_i}/Association_withGeRSs/UKBB.w_hm3.${weight}.${gwas_i}.EUR-GeRSs.predictor_groups
done
sleep 200
done
Single-tissue vs. Multi-tissue
##############################
# Evaluating predictive utility of GeRS across multiple tissues individually and in combination
##############################
. /users/k1806347/brc_scratch/Software/MyGit/GenoPred/config_used/Target_scoring.config

# Make required directories
for pheno_i in $(echo Depression Intelligence BMI Height T2D CAD IBD MultiScler RheuArth);do
mkdir -p /users/k1806347/brc_scratch/Analyses/GeRS_comparison/UKBB_outcomes_for_prediction/${pheno_i}/Association_withGeRSs
done

# Create a file listing the predictors files
pheno=$(echo Depression Intelligence BMI Height T2D CAD IBD RheuArth)
gwas=$(echo DEPR06 COLL01 BODY03 HEIG03 DIAB05 COAD01 CROH01 RHEU01)
weights=$(cat ${TWAS_rep}/snp_weight_list.txt)

for i in $(seq 1 8);do
  pheno_i=$(echo ${pheno} | cut -f ${i} -d ' ')
  gwas_i=$(echo ${gwas} | cut -f ${i} -d ' ')

  echo "predictors group" > /users/k1806347/brc_scratch/Analyses/GeRS_comparison/UKBB_outcomes_for_prediction/${pheno_i}/Association_withGeRSs/UKBB.w_hm3.AllTissue.${gwas_i}.EUR-GeRSs.predictor_groups

  for weight in ${weights}; do
    echo ${UKBB_output}/GeRS_for_comparison/1KG_ref/EUR/${weight}/UKBB.w_hm3.EUR.${weight}.${gwas_i}.fiprofile ${weight} >> /users/k1806347/brc_scratch/Analyses/GeRS_comparison/UKBB_outcomes_for_prediction/${pheno_i}/Association_withGeRSs/UKBB.w_hm3.AllTissue.${gwas_i}.EUR-GeRSs.predictor_groups
  done

done

# Derive and evaluate models
pheno=$(echo Depression Intelligence BMI Height T2D CAD IBD RheuArth)
gwas=$(echo DEPR06 COLL01 BODY03 HEIG03 DIAB05 COAD01 CROH01 RHEU01)
prev=$(echo 0.15 NA NA NA 0.05 0.03 0.013 0.00164 0.005)
weights=YFS.BLOOD.RNAARR

# 1KG reference
for i in $(seq 1 8);do
  pheno_i=$(echo ${pheno} | cut -f ${i} -d ' ')
  pheno_file_i=$(echo ${pheno_file} | cut -f ${i} -d ' ')
  gwas_i=$(echo ${gwas} | cut -f ${i} -d ' ')
  prev_i=$(echo ${prev} | cut -f ${i} -d ' ')

sbatch --mem 10G -n 2 -p brc,shared /users/k1806347/brc_scratch/Software/Rscript.sh /users/k1806347/brc_scratch/Software/MyGit/GenoPred/Scripts/Model_builder/Model_builder_V2_nested.R \
    --pheno ${UKBB_output}/Phenotype/PRS_comp_subset/UKBB.${pheno_i}.txt \
    --keep /users/k1806347/brc_scratch/Analyses/PRS_comparison/UKBB_outcomes_for_prediction/ukb18177_glanville_post_qc_id_list.UpdateIDs.fam \
    --out /users/k1806347/brc_scratch/Analyses/GeRS_comparison/UKBB_outcomes_for_prediction/${pheno_i}/Association_withGeRSs/UKBB.w_hm3.AllTissue.${gwas_i}.EUR-GeRSs \
    --n_core 2 \
    --compare_predictors F \
    --assoc T \
    --outcome_pop_prev ${prev_i} \
    --predictors /users/k1806347/brc_scratch/Analyses/GeRS_comparison/UKBB_outcomes_for_prediction/${pheno_i}/Association_withGeRSs/UKBB.w_hm3.AllTissue.${gwas_i}.EUR-GeRSs.predictor_groups
done
Multi-tissue per pT
##############################
# Evaluating predictive utility of GeRS across multiple tissues for each pT seperately
##############################
. /users/k1806347/brc_scratch/Software/MyGit/GenoPred/config_used/Target_scoring.config

# Make required directories
for pheno_i in $(echo Depression Intelligence BMI Height T2D CAD IBD MultiScler RheuArth);do
mkdir -p /users/k1806347/brc_scratch/Analyses/GeRS_comparison/UKBB_outcomes_for_prediction/${pheno_i}/Association_withGeRSs
done

# Split the GeRS files by pT
module add apps/R
R

source('/users/k1806347/brc_scratch/Software/MyGit/GenoPred/config_used/Target_scoring.config')

gwas<-c('DEPR06','COLL01','BODY03','HEIG03','DIAB05','COAD01','CROH01','RHEU01')

weights<-read.table('~/brc_scratch/Data/TWAS_sumstats/FUSION/snp_weight_list.txt', stringsAsFactors=F)$V1

library(data.table)

for(gwas_i in gwas){
print(gwas_i)
  for(weights_i in weights){

    GeRS<-fread(paste0(UKBB_output,'/GeRS_for_comparison/1KG_ref/EUR/',weights_i,'/UKBB.w_hm3.EUR.',weights_i,'.',gwas_i,'.fiprofile'))

    GeRS_pT<-gsub('.*_','',names(GeRS)[-1:-2])

    for(pT_i in GeRS_pT){
      write.table(GeRS[,c('FID','IID',paste0(gwas_i,'_',pT_i)), with=F], paste0(UKBB_output,'/GeRS_for_comparison/1KG_ref/EUR/',weights_i,'/UKBB.w_hm3.EUR.',weights_i,'.',gwas_i,'.pT_',pT_i,'.fiprofile'),col.names=T, row.names=F, quote=F)
    }
  }
}

q()
n

# Create a file listing the predictors files
pheno=$(echo Depression Intelligence BMI Height T2D CAD IBD RheuArth)
gwas=$(echo DEPR06 COLL01 BODY03 HEIG03 DIAB05 COAD01 CROH01 RHEU01)
weights=$(cat ${TWAS_rep}/snp_weight_list.txt)
pT=$(echo 1e-06 1e-05 1e-04 0.001 0.01 0.05 0.1 0.5 1)

for i in $(seq 1 8);do
  pheno_i=$(echo ${pheno} | cut -f ${i} -d ' ')
  gwas_i=$(echo ${gwas} | cut -f ${i} -d ' ')

  echo "predictors group" > /users/k1806347/brc_scratch/Analyses/GeRS_comparison/UKBB_outcomes_for_prediction/${pheno_i}/Association_withGeRSs/UKBB.w_hm3.AllTissue.${gwas_i}.EUR-GeRSs.per_PT.predictor_groups

  for pT_i in ${pT};do
    for weight in ${weights}; do
        if [ -f ${UKBB_output}/GeRS_for_comparison/1KG_ref/EUR/${weight}/UKBB.w_hm3.EUR.${weight}.${gwas_i}.pT_${pT_i}.fiprofile ]; then

        echo ${UKBB_output}/GeRS_for_comparison/1KG_ref/EUR/${weight}/UKBB.w_hm3.EUR.${weight}.${gwas_i}.pT_${pT_i}.fiprofile ${pT_i} >> /users/k1806347/brc_scratch/Analyses/GeRS_comparison/UKBB_outcomes_for_prediction/${pheno_i}/Association_withGeRSs/UKBB.w_hm3.AllTissue.${gwas_i}.EUR-GeRSs.per_PT.predictor_groups

        fi
    done
  done

done

# Derive and evaluate models
pheno=$(echo Depression Intelligence BMI Height T2D CAD IBD RheuArth)
gwas=$(echo DEPR06 COLL01 BODY03 HEIG03 DIAB05 COAD01 CROH01 RHEU01)
prev=$(echo 0.15 NA NA NA 0.05 0.03 0.013 0.00164 0.005)

# 1KG reference
for i in $(seq 1 8);do
  pheno_i=$(echo ${pheno} | cut -f ${i} -d ' ')
  pheno_file_i=$(echo ${pheno_file} | cut -f ${i} -d ' ')
  gwas_i=$(echo ${gwas} | cut -f ${i} -d ' ')
  prev_i=$(echo ${prev} | cut -f ${i} -d ' ')

sbatch --mem 20G -n 4 -p brc,shared /users/k1806347/brc_scratch/Software/Rscript.sh /users/k1806347/brc_scratch/Software/MyGit/GenoPred/Scripts/Model_builder/Model_builder_V2_nested.R \
    --pheno ${UKBB_output}/Phenotype/PRS_comp_subset/UKBB.${pheno_i}.txt \
    --keep /users/k1806347/brc_scratch/Analyses/PRS_comparison/UKBB_outcomes_for_prediction/ukb18177_glanville_post_qc_id_list.UpdateIDs.fam \
    --out /users/k1806347/brc_scratch/Analyses/GeRS_comparison/UKBB_outcomes_for_prediction/${pheno_i}/Association_withGeRSs/UKBB.w_hm3.AllTissue.${gwas_i}.EUR-GeRSs.per_PT \
    --n_core 4 \
    --compare_predictors F \
    --assoc T \
    --outcome_pop_prev ${prev_i} \
    --predictors /users/k1806347/brc_scratch/Analyses/GeRS_comparison/UKBB_outcomes_for_prediction/${pheno_i}/Association_withGeRSs/UKBB.w_hm3.AllTissue.${gwas_i}.EUR-GeRSs.per_PT.predictor_groups
done
Single-tissue vs. Multi-tissue (PP4+clump)
##############################
# Evaluating predictive utility of GeRS across multiple tissues individually and in combination
##############################
. /users/k1806347/brc_scratch/Software/MyGit/GenoPred/config_used/Target_scoring.config

# Make required directories
for pheno_i in $(echo Depression Intelligence BMI Height T2D CAD IBD MultiScler RheuArth);do
mkdir -p /users/k1806347/brc_scratch/Analyses/GeRS_comparison/UKBB_outcomes_for_prediction/${pheno_i}/Association_withGeRSs
done

# Create a file listing the predictors files
pheno=$(echo Depression Intelligence BMI Height T2D CAD IBD RheuArth)
gwas=$(echo DEPR06 COLL01 BODY03 HEIG03 DIAB05 COAD01 CROH01 RHEU01)
weights=$(cat ${TWAS_rep}/snp_weight_list.txt)

for i in $(seq 1 8);do
  pheno_i=$(echo ${pheno} | cut -f ${i} -d ' ')
  gwas_i=$(echo ${gwas} | cut -f ${i} -d ' ')

  echo "predictors group" > /users/k1806347/brc_scratch/Analyses/GeRS_comparison/UKBB_outcomes_for_prediction/${pheno_i}/Association_withGeRSs/UKBB.w_hm3.AllTissue.${gwas_i}.EUR-GeRSs_PP4.predictor_groups

  for weight in ${weights}; do
    echo ${UKBB_output}/GeRS_for_comparison/1KG_ref_withCOLOC/EUR/${weight}/UKBB.w_hm3.EUR.${weight}.${gwas_i}.fiprofile ${weight} >> /users/k1806347/brc_scratch/Analyses/GeRS_comparison/UKBB_outcomes_for_prediction/${pheno_i}/Association_withGeRSs/UKBB.w_hm3.AllTissue.${gwas_i}.EUR-GeRSs_PP4.predictor_groups
  done

done

# Derive and evaluate models
pheno=$(echo Depression Intelligence BMI Height T2D CAD IBD RheuArth)
gwas=$(echo DEPR06 COLL01 BODY03 HEIG03 DIAB05 COAD01 CROH01 RHEU01)
prev=$(echo 0.15 NA NA NA 0.05 0.03 0.013 0.00164 0.005)
weights=YFS.BLOOD.RNAARR

# 1KG reference
for i in $(seq 1 8);do
  pheno_i=$(echo ${pheno} | cut -f ${i} -d ' ')
  pheno_file_i=$(echo ${pheno_file} | cut -f ${i} -d ' ')
  gwas_i=$(echo ${gwas} | cut -f ${i} -d ' ')
  prev_i=$(echo ${prev} | cut -f ${i} -d ' ')

sbatch --mem 20G -n 4 -p brc,shared /users/k1806347/brc_scratch/Software/Rscript.sh /users/k1806347/brc_scratch/Software/MyGit/GenoPred/Scripts/Model_builder/Model_builder_V2_nested.R \
    --pheno ${UKBB_output}/Phenotype/PRS_comp_subset/UKBB.${pheno_i}.txt \
    --keep /users/k1806347/brc_scratch/Analyses/PRS_comparison/UKBB_outcomes_for_prediction/ukb18177_glanville_post_qc_id_list.UpdateIDs.fam \
    --out /users/k1806347/brc_scratch/Analyses/GeRS_comparison/UKBB_outcomes_for_prediction/${pheno_i}/Association_withGeRSs/UKBB.w_hm3.AllTissue.${gwas_i}.EUR-GeRSs_PP4 \
    --n_core 4 \
    --compare_predictors F \
    --assoc T \
    --outcome_pop_prev ${prev_i} \
    --predictors /users/k1806347/brc_scratch/Analyses/GeRS_comparison/UKBB_outcomes_for_prediction/${pheno_i}/Association_withGeRSs/UKBB.w_hm3.AllTissue.${gwas_i}.EUR-GeRSs_PP4.predictor_groups
done
Single-tissue vs. Multi-tissue (TissueSpecific)
##############################
# Evaluating predictive utility of GeRS across multiple tissues individually and in combination
##############################
. /users/k1806347/brc_scratch/Software/MyGit/GenoPred/config_used/Target_scoring.config

# Make required directories
for pheno_i in $(echo Depression Intelligence BMI Height T2D CAD IBD MultiScler RheuArth);do
mkdir -p /users/k1806347/brc_scratch/Analyses/GeRS_comparison/UKBB_outcomes_for_prediction/${pheno_i}/Association_withGeRSs
done

# Create a file listing the predictors files
pheno=$(echo Depression Intelligence BMI Height T2D CAD IBD RheuArth)
gwas=$(echo DEPR06 COLL01 BODY03 HEIG03 DIAB05 COAD01 CROH01 RHEU01)
weights=$(cat ${TWAS_rep}/snp_weight_list.txt)

for i in $(seq 1 8);do
  pheno_i=$(echo ${pheno} | cut -f ${i} -d ' ')
  gwas_i=$(echo ${gwas} | cut -f ${i} -d ' ')

  echo "predictors group" > /users/k1806347/brc_scratch/Analyses/GeRS_comparison/UKBB_outcomes_for_prediction/${pheno_i}/Association_withGeRSs/UKBB.w_hm3.AllTissue.TissueSpecific.${gwas_i}.EUR-GeRSs.predictor_groups

  for weight in ${weights}; do
    echo ${UKBB_output}/GeRS_for_comparison/1KG_ref/EUR/${weight}/UKBB.w_hm3.EUR.TissueSpecific.${weight}.${gwas_i}.fiprofile ${weight} >> /users/k1806347/brc_scratch/Analyses/GeRS_comparison/UKBB_outcomes_for_prediction/${pheno_i}/Association_withGeRSs/UKBB.w_hm3.AllTissue.TissueSpecific.${gwas_i}.EUR-GeRSs.predictor_groups
  done

done

# Derive and evaluate models
pheno=$(echo Depression Intelligence BMI Height T2D CAD IBD RheuArth)
gwas=$(echo DEPR06 COLL01 BODY03 HEIG03 DIAB05 COAD01 CROH01 RHEU01)
prev=$(echo 0.15 NA NA NA 0.05 0.03 0.013 0.00164 0.005)
weights=YFS.BLOOD.RNAARR

# 1KG reference
for i in $(seq 1 8);do
  pheno_i=$(echo ${pheno} | cut -f ${i} -d ' ')
  pheno_file_i=$(echo ${pheno_file} | cut -f ${i} -d ' ')
  gwas_i=$(echo ${gwas} | cut -f ${i} -d ' ')
  prev_i=$(echo ${prev} | cut -f ${i} -d ' ')

sbatch --mem 20G -n 4 -p brc,shared /users/k1806347/brc_scratch/Software/Rscript.sh /users/k1806347/brc_scratch/Software/MyGit/GenoPred/Scripts/Model_builder/Model_builder_V2_nested.R \
    --pheno ${UKBB_output}/Phenotype/PRS_comp_subset/UKBB.${pheno_i}.txt \
    --keep /users/k1806347/brc_scratch/Analyses/PRS_comparison/UKBB_outcomes_for_prediction/ukb18177_glanville_post_qc_id_list.UpdateIDs.fam \
    --out /users/k1806347/brc_scratch/Analyses/GeRS_comparison/UKBB_outcomes_for_prediction/${pheno_i}/Association_withGeRSs/UKBB.w_hm3.AllTissue.TissueSpecific.${gwas_i}.EUR-GeRSs \
    --n_core 4 \
    --compare_predictors F \
    --assoc T \
    --outcome_pop_prev ${prev_i} \
    --predictors /users/k1806347/brc_scratch/Analyses/GeRS_comparison/UKBB_outcomes_for_prediction/${pheno_i}/Association_withGeRSs/UKBB.w_hm3.AllTissue.TissueSpecific.${gwas_i}.EUR-GeRSs.predictor_groups
done
Single-tissue vs. Multi-tissue (colocalised)
##############################
# Evaluating predictive utility of GeRS across multiple tissues individually and in combination
##############################
. /users/k1806347/brc_scratch/Software/MyGit/GenoPred/config_used/Target_scoring.config

# Make required directories
for pheno_i in $(echo Depression Intelligence BMI Height T2D CAD IBD MultiScler RheuArth);do
mkdir -p /users/k1806347/brc_scratch/Analyses/GeRS_comparison/UKBB_outcomes_for_prediction/${pheno_i}/Association_withGeRSs
done

# Create a file listing the predictors files
pheno=$(echo Depression Intelligence BMI Height T2D CAD IBD RheuArth)
gwas=$(echo DEPR06 COLL01 BODY03 HEIG03 DIAB05 COAD01 CROH01 RHEU01)
weights=$(cat ${TWAS_rep}/snp_weight_list.txt)

for i in $(seq 1 8);do
  pheno_i=$(echo ${pheno} | cut -f ${i} -d ' ')
  gwas_i=$(echo ${gwas} | cut -f ${i} -d ' ')

  echo "predictors group" > /users/k1806347/brc_scratch/Analyses/GeRS_comparison/UKBB_outcomes_for_prediction/${pheno_i}/Association_withGeRSs/UKBB.w_hm3.AllTissue.${gwas_i}.EUR-GeRSs_pT_withColoc.predictor_groups

  for weight in ${weights}; do

    if [ -f ${UKBB_output}/GeRS_for_comparison/1KG_ref_pT_withColoc/EUR/${weight}/UKBB.w_hm3.EUR.${weight}.${gwas_i}.fiprofile ]; then

      echo ${UKBB_output}/GeRS_for_comparison/1KG_ref_pT_withColoc/EUR/${weight}/UKBB.w_hm3.EUR.${weight}.${gwas_i}.fiprofile ${weight} >> /users/k1806347/brc_scratch/Analyses/GeRS_comparison/UKBB_outcomes_for_prediction/${pheno_i}/Association_withGeRSs/UKBB.w_hm3.AllTissue.${gwas_i}.EUR-GeRSs_pT_withColoc.predictor_groups

    fi

  done

done

# Derive and evaluate models
pheno=$(echo Depression Intelligence BMI Height T2D CAD IBD RheuArth)
gwas=$(echo DEPR06 COLL01 BODY03 HEIG03 DIAB05 COAD01 CROH01 RHEU01)
prev=$(echo 0.15 NA NA NA 0.05 0.03 0.013 0.00164 0.005)

# 1KG reference
for i in $(seq 1 8);do
  pheno_i=$(echo ${pheno} | cut -f ${i} -d ' ')
  pheno_file_i=$(echo ${pheno_file} | cut -f ${i} -d ' ')
  gwas_i=$(echo ${gwas} | cut -f ${i} -d ' ')
  prev_i=$(echo ${prev} | cut -f ${i} -d ' ')

sbatch --mem 20G -n 4 -p brc,shared /users/k1806347/brc_scratch/Software/Rscript.sh /users/k1806347/brc_scratch/Software/MyGit/GenoPred/Scripts/Model_builder/Model_builder_V2_nested.R \
    --pheno ${UKBB_output}/Phenotype/PRS_comp_subset/UKBB.${pheno_i}.txt \
    --keep /users/k1806347/brc_scratch/Analyses/PRS_comparison/UKBB_outcomes_for_prediction/ukb18177_glanville_post_qc_id_list.UpdateIDs.fam \
    --out /users/k1806347/brc_scratch/Analyses/GeRS_comparison/UKBB_outcomes_for_prediction/${pheno_i}/Association_withGeRSs/UKBB.w_hm3.AllTissue.${gwas_i}.EUR-GeRSs_pT_withColoc \
    --n_core 4 \
    --compare_predictors F \
    --assoc T \
    --outcome_pop_prev ${prev_i} \
    --predictors /users/k1806347/brc_scratch/Analyses/GeRS_comparison/UKBB_outcomes_for_prediction/${pheno_i}/Association_withGeRSs/UKBB.w_hm3.AllTissue.${gwas_i}.EUR-GeRSs_pT_withColoc.predictor_groups
done
Multi-tissue per pT (colocalised)
##############################
# Evaluating predictive utility of GeRS across multiple tissues for each pT seperately
##############################
. /users/k1806347/brc_scratch/Software/MyGit/GenoPred/config_used/Target_scoring.config

# Make required directories
for pheno_i in $(echo Depression Intelligence BMI Height T2D CAD IBD MultiScler RheuArth);do
mkdir -p /users/k1806347/brc_scratch/Analyses/GeRS_comparison/UKBB_outcomes_for_prediction/${pheno_i}/Association_withGeRSs
done

# Split the GeRS files by pT
module add apps/R
R

source('/users/k1806347/brc_scratch/Software/MyGit/GenoPred/config_used/Target_scoring.config')

gwas<-c('DEPR06','COLL01','BODY03','HEIG03','DIAB05','COAD01','CROH01','RHEU01')

weights<-read.table('~/brc_scratch/Data/TWAS_sumstats/FUSION/snp_weight_list.txt', stringsAsFactors=F)$V1

library(data.table)

for(gwas_i in gwas){
print(gwas_i)
  for(weights_i in weights){

    if(file.exists(paste0(UKBB_output,'/GeRS_for_comparison/1KG_ref_pT_withColoc/EUR/',weights_i,'/UKBB.w_hm3.EUR.',weights_i,'.',gwas_i,'.fiprofile')) == T){

      GeRS<-fread(paste0(UKBB_output,'/GeRS_for_comparison/1KG_ref_pT_withColoc/EUR/',weights_i,'/UKBB.w_hm3.EUR.',weights_i,'.',gwas_i,'.fiprofile'))

      GeRS_pT<-gsub('.*_','',names(GeRS)[-1:-2])

      for(pT_i in GeRS_pT){
        write.table(GeRS[,c('FID','IID',paste0(gwas_i,'_',pT_i)), with=F], paste0(UKBB_output,'/GeRS_for_comparison/1KG_ref_pT_withColoc/EUR/',weights_i,'/UKBB.w_hm3.EUR.',weights_i,'.',gwas_i,'.pT_',pT_i,'.fiprofile'),col.names=T, row.names=F, quote=F)
      }
    }
  }
}

q()
n

# Create a file listing the predictors files
pheno=$(echo Depression Intelligence BMI Height T2D CAD IBD RheuArth)
gwas=$(echo DEPR06 COLL01 BODY03 HEIG03 DIAB05 COAD01 CROH01 RHEU01)
weights=$(cat ${TWAS_rep}/snp_weight_list.txt)
pT=$(echo 1e-06 1e-05 1e-04 0.001 0.01 0.05 0.1 0.5 1)

for i in $(seq 1 8);do
  pheno_i=$(echo ${pheno} | cut -f ${i} -d ' ')
  gwas_i=$(echo ${gwas} | cut -f ${i} -d ' ')

  echo "predictors group" > /users/k1806347/brc_scratch/Analyses/GeRS_comparison/UKBB_outcomes_for_prediction/${pheno_i}/Association_withGeRSs/UKBB.w_hm3.AllTissue.${gwas_i}.EUR-GeRSs_pT_withColoc.per_PT.predictor_groups

  for pT_i in ${pT};do
    for weight in ${weights}; do
        if [ -f ${UKBB_output}/GeRS_for_comparison/1KG_ref_pT_withColoc/EUR/${weight}/UKBB.w_hm3.EUR.${weight}.${gwas_i}.pT_${pT_i}.fiprofile ]; then

        echo ${UKBB_output}/GeRS_for_comparison/1KG_ref_pT_withColoc/EUR/${weight}/UKBB.w_hm3.EUR.${weight}.${gwas_i}.pT_${pT_i}.fiprofile ${pT_i} >> /users/k1806347/brc_scratch/Analyses/GeRS_comparison/UKBB_outcomes_for_prediction/${pheno_i}/Association_withGeRSs/UKBB.w_hm3.AllTissue.${gwas_i}.EUR-GeRSs_pT_withColoc.per_PT.predictor_groups

        fi
    done
  done

done

# Derive and evaluate models
pheno=$(echo Depression Intelligence BMI Height T2D CAD IBD RheuArth)
gwas=$(echo DEPR06 COLL01 BODY03 HEIG03 DIAB05 COAD01 CROH01 RHEU01)
prev=$(echo 0.15 NA NA NA 0.05 0.03 0.013 0.00164 0.005)

# 1KG reference
for i in $(seq 1 8);do
  pheno_i=$(echo ${pheno} | cut -f ${i} -d ' ')
  pheno_file_i=$(echo ${pheno_file} | cut -f ${i} -d ' ')
  gwas_i=$(echo ${gwas} | cut -f ${i} -d ' ')
  prev_i=$(echo ${prev} | cut -f ${i} -d ' ')

sbatch --mem 20G -n 4 -p brc,shared /users/k1806347/brc_scratch/Software/Rscript.sh /users/k1806347/brc_scratch/Software/MyGit/GenoPred/Scripts/Model_builder/Model_builder_V2_nested.R \
    --pheno ${UKBB_output}/Phenotype/PRS_comp_subset/UKBB.${pheno_i}.txt \
    --keep /users/k1806347/brc_scratch/Analyses/PRS_comparison/UKBB_outcomes_for_prediction/ukb18177_glanville_post_qc_id_list.UpdateIDs.fam \
    --out /users/k1806347/brc_scratch/Analyses/GeRS_comparison/UKBB_outcomes_for_prediction/${pheno_i}/Association_withGeRSs/UKBB.w_hm3.AllTissue.${gwas_i}.EUR-GeRSs_pT_withColoc.per_PT \
    --n_core 4 \
    --compare_predictors F \
    --assoc T \
    --outcome_pop_prev ${prev_i} \
    --predictors /users/k1806347/brc_scratch/Analyses/GeRS_comparison/UKBB_outcomes_for_prediction/${pheno_i}/Association_withGeRSs/UKBB.w_hm3.AllTissue.${gwas_i}.EUR-GeRSs_pT_withColoc.per_PT.predictor_groups
done
GeRS + PRS
##############################
# Evaluating predictive utility of GeRS and PRS individually and in combination
##############################
. /users/k1806347/brc_scratch/Software/MyGit/GenoPred/config_used/Target_scoring.config

# Make required directories
for pheno_i in $(echo Depression Intelligence BMI Height T2D CAD IBD RheuArth);do
mkdir -p /users/k1806347/brc_scratch/Analyses/GeRS_comparison/UKBB_outcomes_for_prediction/${pheno_i}/Association_withPRS_and_GeRSs
done

# Create a file listing the predictors files
pheno=$(echo Depression Intelligence BMI Height T2D CAD IBD RheuArth)
gwas=$(echo DEPR06 COLL01 BODY03 HEIG03 DIAB05 COAD01 CROH01 RHEU01)
weights=$(cat ${TWAS_rep}/snp_weight_list.txt)

for i in $(seq 1 8);do
  pheno_i=$(echo ${pheno} | cut -f ${i} -d ' ')
  gwas_i=$(echo ${gwas} | cut -f ${i} -d ' ')

  echo "predictors group" > /users/k1806347/brc_scratch/Analyses/GeRS_comparison/UKBB_outcomes_for_prediction/${pheno_i}/Association_withPRS_and_GeRSs/UKBB.w_hm3.AllTissue.${gwas_i}.EUR-GeRSs.EUR-PRSs.pt_clump.predictor_groups

  for weight in ${weights}; do
    echo ${UKBB_output}/GeRS_for_comparison/1KG_ref/EUR/${weight}/UKBB.w_hm3.EUR.${weight}.${gwas_i}.fiprofile GeRS >> /users/k1806347/brc_scratch/Analyses/GeRS_comparison/UKBB_outcomes_for_prediction/${pheno_i}/Association_withPRS_and_GeRSs/UKBB.w_hm3.AllTissue.${gwas_i}.EUR-GeRSs.EUR-PRSs.pt_clump.predictor_groups
  done

    echo ${UKBB_output}/PRS_for_comparison/1KG_ref/pt_clump/${gwas_i}/UKBB.subset.w_hm3.${gwas_i}.profiles PRS >> /users/k1806347/brc_scratch/Analyses/GeRS_comparison/UKBB_outcomes_for_prediction/${pheno_i}/Association_withPRS_and_GeRSs/UKBB.w_hm3.AllTissue.${gwas_i}.EUR-GeRSs.EUR-PRSs.pt_clump.predictor_groups
done

# Run for no mhc clump rheumarth
echo "predictors group" > /users/k1806347/brc_scratch/Analyses/GeRS_comparison/UKBB_outcomes_for_prediction/RheuArth/Association_withPRS_and_GeRSs/UKBB.w_hm3.AllTissue.RHEU01.noMHCClump.EUR-GeRSs.EUR-PRSs.pt_clump.predictor_groups

for weight in ${weights}; do
  echo ${UKBB_output}/GeRS_for_comparison/1KG_ref/EUR/${weight}/UKBB.w_hm3.EUR.${weight}.RHEU01.fiprofile GeRS >> /users/k1806347/brc_scratch/Analyses/GeRS_comparison/UKBB_outcomes_for_prediction/RheuArth/Association_withPRS_and_GeRSs/UKBB.w_hm3.AllTissue.RHEU01.noMHCClump.EUR-GeRSs.EUR-PRSs.pt_clump.predictor_groups
done

echo ${UKBB_output}/PRS_for_comparison/1KG_ref/pt_clump/RHEU01.noMHCClump/UKBB.subset.w_hm3.RHEU01.noMHCClump.profiles PRS >> /users/k1806347/brc_scratch/Analyses/GeRS_comparison/UKBB_outcomes_for_prediction/RheuArth/Association_withPRS_and_GeRSs/UKBB.w_hm3.AllTissue.RHEU01.noMHCClump.EUR-GeRSs.EUR-PRSs.pt_clump.predictor_groups

# Derive and evaluate models
pheno=$(echo Depression Intelligence BMI Height T2D CAD IBD RheuArth RheuArth)
gwas=$(echo DEPR06 COLL01 BODY03 HEIG03 DIAB05 COAD01 CROH01 RHEU01 RHEU01.noMHCClump)
prev=$(echo 0.15 NA NA NA 0.05 0.03 0.013 0.00164 0.005 0.005)

# 1KG reference
for i in $(seq 1 9);do
  pheno_i=$(echo ${pheno} | cut -f ${i} -d ' ')
  pheno_file_i=$(echo ${pheno_file} | cut -f ${i} -d ' ')
  gwas_i=$(echo ${gwas} | cut -f ${i} -d ' ')
  prev_i=$(echo ${prev} | cut -f ${i} -d ' ')

sbatch --mem 10G -n 4 -p brc,shared /users/k1806347/brc_scratch/Software/Rscript.sh /users/k1806347/brc_scratch/Software/MyGit/GenoPred/Scripts/Model_builder/Model_builder_V2_nested.R \
    --pheno ${UKBB_output}/Phenotype/PRS_comp_subset/UKBB.${pheno_i}.txt \
    --keep /users/k1806347/brc_scratch/Analyses/PRS_comparison/UKBB_outcomes_for_prediction/ukb18177_glanville_post_qc_id_list.UpdateIDs.fam \
    --out /users/k1806347/brc_scratch/Analyses/GeRS_comparison/UKBB_outcomes_for_prediction/${pheno_i}/Association_withPRS_and_GeRSs/UKBB.w_hm3.AllTissue.${gwas_i}.EUR-GeRSs.EUR-PRSs.pt_clump \
    --n_core 4 \
    --compare_predictors F \
    --assoc T \
    --outcome_pop_prev ${prev_i} \
    --predictors /users/k1806347/brc_scratch/Analyses/GeRS_comparison/UKBB_outcomes_for_prediction/${pheno_i}/Association_withPRS_and_GeRSs/UKBB.w_hm3.AllTissue.${gwas_i}.EUR-GeRSs.EUR-PRSs.pt_clump.predictor_groups
done
GeRS PP4 + PRS
##############################
# Evaluating predictive utility of GeRS and PRS individually and in combination
##############################
. /users/k1806347/brc_scratch/Software/MyGit/GenoPred/config_used/Target_scoring.config

# Create a file listing the predictors files
pheno=$(echo Depression Intelligence BMI Height T2D CAD IBD RheuArth)
gwas=$(echo DEPR06 COLL01 BODY03 HEIG03 DIAB05 COAD01 CROH01 RHEU01)
weights=$(cat ${TWAS_rep}/snp_weight_list.txt)

for i in $(seq 1 8);do
  pheno_i=$(echo ${pheno} | cut -f ${i} -d ' ')
  gwas_i=$(echo ${gwas} | cut -f ${i} -d ' ')

  echo "predictors group" > /users/k1806347/brc_scratch/Analyses/GeRS_comparison/UKBB_outcomes_for_prediction/${pheno_i}/Association_withPRS_and_GeRSs/UKBB.w_hm3.AllTissue.${gwas_i}.EUR-GeRSs_PP4.EUR-PRSs.pt_clump.predictor_groups

  for weight in ${weights}; do
    echo ${UKBB_output}/GeRS_for_comparison/1KG_ref_withCOLOC/EUR/${weight}/UKBB.w_hm3.EUR.${weight}.${gwas_i}.fiprofile GeRS >> /users/k1806347/brc_scratch/Analyses/GeRS_comparison/UKBB_outcomes_for_prediction/${pheno_i}/Association_withPRS_and_GeRSs/UKBB.w_hm3.AllTissue.${gwas_i}.EUR-GeRSs_PP4.EUR-PRSs.pt_clump.predictor_groups
  done

    echo ${UKBB_output}/PRS_for_comparison/1KG_ref/pt_clump/${gwas_i}/UKBB.subset.w_hm3.${gwas_i}.profiles PRS >> /users/k1806347/brc_scratch/Analyses/GeRS_comparison/UKBB_outcomes_for_prediction/${pheno_i}/Association_withPRS_and_GeRSs/UKBB.w_hm3.AllTissue.${gwas_i}.EUR-GeRSs_PP4.EUR-PRSs.pt_clump.predictor_groups
done

# Derive and evaluate models
pheno=$(echo Depression Intelligence BMI Height T2D CAD IBD RheuArth)
gwas=$(echo DEPR06 COLL01 BODY03 HEIG03 DIAB05 COAD01 CROH01 RHEU01)
prev=$(echo 0.15 NA NA NA 0.05 0.03 0.013 0.00164 0.005)

# 1KG reference
for i in $(seq 1 8);do
  pheno_i=$(echo ${pheno} | cut -f ${i} -d ' ')
  pheno_file_i=$(echo ${pheno_file} | cut -f ${i} -d ' ')
  gwas_i=$(echo ${gwas} | cut -f ${i} -d ' ')
  prev_i=$(echo ${prev} | cut -f ${i} -d ' ')

sbatch --mem 10G -n 4 -p brc,shared /users/k1806347/brc_scratch/Software/Rscript.sh /users/k1806347/brc_scratch/Software/MyGit/GenoPred/Scripts/Model_builder/Model_builder_V2_nested.R \
    --pheno ${UKBB_output}/Phenotype/PRS_comp_subset/UKBB.${pheno_i}.txt \
    --keep /users/k1806347/brc_scratch/Analyses/PRS_comparison/UKBB_outcomes_for_prediction/ukb18177_glanville_post_qc_id_list.UpdateIDs.fam \
    --out /users/k1806347/brc_scratch/Analyses/GeRS_comparison/UKBB_outcomes_for_prediction/${pheno_i}/Association_withPRS_and_GeRSs/UKBB.w_hm3.AllTissue.${gwas_i}.EUR-GeRSs_PP4.EUR-PRSs.pt_clump \
    --n_core 4 \
    --compare_predictors F \
    --assoc T \
    --outcome_pop_prev ${prev_i} \
    --predictors /users/k1806347/brc_scratch/Analyses/GeRS_comparison/UKBB_outcomes_for_prediction/${pheno_i}/Association_withPRS_and_GeRSs/UKBB.w_hm3.AllTissue.${gwas_i}.EUR-GeRSs_PP4.EUR-PRSs.pt_clump.predictor_groups
done
GeRS TissueSpecific + PRS
##############################
# Evaluating predictive utility of GeRS and PRS individually and in combination
##############################
. /users/k1806347/brc_scratch/Software/MyGit/GenoPred/config_used/Target_scoring.config

# Create a file listing the predictors files
pheno=$(echo Depression Intelligence BMI Height T2D CAD IBD RheuArth)
gwas=$(echo DEPR06 COLL01 BODY03 HEIG03 DIAB05 COAD01 CROH01 RHEU01)
weights=$(cat ${TWAS_rep}/snp_weight_list.txt)

for i in $(seq 1 8);do
  pheno_i=$(echo ${pheno} | cut -f ${i} -d ' ')
  gwas_i=$(echo ${gwas} | cut -f ${i} -d ' ')

  echo "predictors group" > /users/k1806347/brc_scratch/Analyses/GeRS_comparison/UKBB_outcomes_for_prediction/${pheno_i}/Association_withPRS_and_GeRSs/UKBB.w_hm3.AllTissue.TissueSpecific.${gwas_i}.EUR-GeRSs.EUR-PRSs.pt_clump.predictor_groups

  for weight in ${weights}; do
    echo ${UKBB_output}/GeRS_for_comparison/1KG_ref/EUR/${weight}/UKBB.w_hm3.EUR.TissueSpecific.${weight}.${gwas_i}.fiprofile GeRS >> /users/k1806347/brc_scratch/Analyses/GeRS_comparison/UKBB_outcomes_for_prediction/${pheno_i}/Association_withPRS_and_GeRSs/UKBB.w_hm3.AllTissue.TissueSpecific.${gwas_i}.EUR-GeRSs.EUR-PRSs.pt_clump.predictor_groups
  done

    echo ${UKBB_output}/PRS_for_comparison/1KG_ref/pt_clump/${gwas_i}/UKBB.subset.w_hm3.${gwas_i}.profiles PRS >> /users/k1806347/brc_scratch/Analyses/GeRS_comparison/UKBB_outcomes_for_prediction/${pheno_i}/Association_withPRS_and_GeRSs/UKBB.w_hm3.AllTissue.TissueSpecific.${gwas_i}.EUR-GeRSs.EUR-PRSs.pt_clump.predictor_groups
done

# Derive and evaluate models
pheno=$(echo Depression Intelligence BMI Height T2D CAD IBD RheuArth)
gwas=$(echo DEPR06 COLL01 BODY03 HEIG03 DIAB05 COAD01 CROH01 RHEU01)
prev=$(echo 0.15 NA NA NA 0.05 0.03 0.013 0.00164 0.005)

# 1KG reference
for i in $(seq 1 8);do
  pheno_i=$(echo ${pheno} | cut -f ${i} -d ' ')
  pheno_file_i=$(echo ${pheno_file} | cut -f ${i} -d ' ')
  gwas_i=$(echo ${gwas} | cut -f ${i} -d ' ')
  prev_i=$(echo ${prev} | cut -f ${i} -d ' ')

sbatch --mem 10G -n 4 -p brc,shared /users/k1806347/brc_scratch/Software/Rscript.sh /users/k1806347/brc_scratch/Software/MyGit/GenoPred/Scripts/Model_builder/Model_builder_V2_nested.R \
    --pheno ${UKBB_output}/Phenotype/PRS_comp_subset/UKBB.${pheno_i}.txt \
    --keep /users/k1806347/brc_scratch/Analyses/PRS_comparison/UKBB_outcomes_for_prediction/ukb18177_glanville_post_qc_id_list.UpdateIDs.fam \
    --out /users/k1806347/brc_scratch/Analyses/GeRS_comparison/UKBB_outcomes_for_prediction/${pheno_i}/Association_withPRS_and_GeRSs/UKBB.w_hm3.AllTissue.TissueSpecific.${gwas_i}.EUR-GeRSs.EUR-PRSs.pt_clump \
    --n_core 4 \
    --compare_predictors F \
    --assoc T \
    --outcome_pop_prev ${prev_i} \
    --predictors /users/k1806347/brc_scratch/Analyses/GeRS_comparison/UKBB_outcomes_for_prediction/${pheno_i}/Association_withPRS_and_GeRSs/UKBB.w_hm3.AllTissue.TissueSpecific.${gwas_i}.EUR-GeRSs.EUR-PRSs.pt_clump.predictor_groups
done
GeRS + PRScs
##############################
# Evaluating predictive utility of GeRS and PRScs individually and in combination
##############################
. /users/k1806347/brc_scratch/Software/MyGit/GenoPred/config_used/Target_scoring.config

# Make required directories
for pheno_i in $(echo Depression Intelligence BMI Height T2D CAD IBD RheuArth);do
mkdir -p /users/k1806347/brc_scratch/Analyses/GeRS_comparison/UKBB_outcomes_for_prediction/${pheno_i}/Association_withPRS_and_GeRSs
done

# Create a file listing the predictors files
pheno=$(echo Depression Intelligence BMI Height T2D CAD IBD RheuArth)
gwas=$(echo DEPR06 COLL01 BODY03 HEIG03 DIAB05 COAD01 CROH01 RHEU01)
weights=$(cat ${TWAS_rep}/snp_weight_list.txt)

for i in $(seq 1 8);do
  pheno_i=$(echo ${pheno} | cut -f ${i} -d ' ')
  gwas_i=$(echo ${gwas} | cut -f ${i} -d ' ')

  echo "predictors group" > /users/k1806347/brc_scratch/Analyses/GeRS_comparison/UKBB_outcomes_for_prediction/${pheno_i}/Association_withPRS_and_GeRSs/UKBB.w_hm3.AllTissue.${gwas_i}.EUR-GeRSs.EUR-PRSs.PRScs.predictor_groups

  for weight in ${weights}; do
    echo ${UKBB_output}/GeRS_for_comparison/1KG_ref/EUR/${weight}/UKBB.w_hm3.EUR.${weight}.${gwas_i}.fiprofile GeRS >> /users/k1806347/brc_scratch/Analyses/GeRS_comparison/UKBB_outcomes_for_prediction/${pheno_i}/Association_withPRS_and_GeRSs/UKBB.w_hm3.AllTissue.${gwas_i}.EUR-GeRSs.EUR-PRSs.PRScs.predictor_groups
  done

    echo ${UKBB_output}/PRS_for_comparison/1KG_ref/PRScs/${gwas_i}/UKBB.subset.w_hm3.${gwas_i}.PRScs_profiles PRS >> /users/k1806347/brc_scratch/Analyses/GeRS_comparison/UKBB_outcomes_for_prediction/${pheno_i}/Association_withPRS_and_GeRSs/UKBB.w_hm3.AllTissue.${gwas_i}.EUR-GeRSs.EUR-PRSs.PRScs.predictor_groups
done

# Derive and evaluate models
pheno=$(echo Depression Intelligence BMI Height T2D CAD IBD RheuArth)
gwas=$(echo DEPR06 COLL01 BODY03 HEIG03 DIAB05 COAD01 CROH01 RHEU01)
prev=$(echo 0.15 NA NA NA 0.05 0.03 0.013 0.00164 0.005)

# 1KG reference
for i in $(seq 1 8);do
  pheno_i=$(echo ${pheno} | cut -f ${i} -d ' ')
  pheno_file_i=$(echo ${pheno_file} | cut -f ${i} -d ' ')
  gwas_i=$(echo ${gwas} | cut -f ${i} -d ' ')
  prev_i=$(echo ${prev} | cut -f ${i} -d ' ')

sbatch --mem 10G -n 4 -p brc,shared /users/k1806347/brc_scratch/Software/Rscript.sh /users/k1806347/brc_scratch/Software/MyGit/GenoPred/Scripts/Model_builder/Model_builder_V2_nested.R \
    --pheno ${UKBB_output}/Phenotype/PRS_comp_subset/UKBB.${pheno_i}.txt \
    --keep /users/k1806347/brc_scratch/Analyses/PRS_comparison/UKBB_outcomes_for_prediction/ukb18177_glanville_post_qc_id_list.UpdateIDs.fam \
    --out /users/k1806347/brc_scratch/Analyses/GeRS_comparison/UKBB_outcomes_for_prediction/${pheno_i}/Association_withPRS_and_GeRSs/UKBB.w_hm3.AllTissue.${gwas_i}.EUR-GeRSs.EUR-PRSs.PRScs \
    --n_core 4 \
    --compare_predictors F \
    --assoc T \
    --outcome_pop_prev ${prev_i} \
    --predictors /users/k1806347/brc_scratch/Analyses/GeRS_comparison/UKBB_outcomes_for_prediction/${pheno_i}/Association_withPRS_and_GeRSs/UKBB.w_hm3.AllTissue.${gwas_i}.EUR-GeRSs.EUR-PRSs.PRScs.predictor_groups
done
Functionally agnostic polygenic score
##############################
# Evaluating predictive utility of pT + clump PRSs across multiple pTs individually and in combination
##############################
. /users/k1806347/brc_scratch/Software/MyGit/GenoPred/config_used/Target_scoring.config

# Make required directories
for pheno_i in $(echo Depression Intelligence BMI Height T2D CAD IBD MultiScler RheuArth);do
mkdir -p /users/k1806347/brc_scratch/Analyses/GeRS_comparison/UKBB_outcomes_for_prediction/${pheno_i}/Association_withPRSs
done

# Create a file listing the predictors files
pheno=$(echo Depression Intelligence BMI Height T2D CAD IBD MultiScler RheuArth)
gwas=$(echo DEPR06 COLL01 BODY03 HEIG03 DIAB05 COAD01 CROH01 SCLE02 RHEU01)

for i in $(seq 1 9);do
pheno_i=$(echo ${pheno} | cut -f ${i} -d ' ')
gwas_i=$(echo ${gwas} | cut -f ${i} -d ' ')

cat > /users/k1806347/brc_scratch/Analyses/GeRS_comparison/UKBB_outcomes_for_prediction/${pheno_i}/Association_withPRSs/UKBB.w_hm3.${gwas_i}.EUR-PRSs.predictor_groups <<EOF
predictors
${UKBB_output}/PRS_for_comparison/1KG_ref/pt_clump/${gwas_i}/UKBB.subset.w_hm3.${gwas_i}.profiles
EOF

done

# Derive and evaluate models
pheno=$(echo Depression Intelligence BMI Height T2D CAD IBD MultiScler RheuArth)
gwas=$(echo DEPR06 COLL01 BODY03 HEIG03 DIAB05 COAD01 CROH01 SCLE02 RHEU01)
prev=$(echo 0.15 NA NA NA 0.05 0.03 0.013 0.00164 0.005)

# pT + clump (sparse)
for i in $(seq 1 9);do
  pheno_i=$(echo ${pheno} | cut -f ${i} -d ' ')
  pheno_file_i=$(echo ${pheno_file} | cut -f ${i} -d ' ')
  gwas_i=$(echo ${gwas} | cut -f ${i} -d ' ')
  prev_i=$(echo ${prev} | cut -f ${i} -d ' ')

sbatch --mem 10G -n 2 -p brc,shared /users/k1806347/brc_scratch/Software/Rscript.sh /users/k1806347/brc_scratch/Software/MyGit/GenoPred/Scripts/Model_builder/Model_builder_V2_nested.R \
    --pheno ${UKBB_output}/Phenotype/PRS_comp_subset/UKBB.${pheno_i}.txt \
    --keep /users/k1806347/brc_scratch/Analyses/PRS_comparison/UKBB_outcomes_for_prediction/ukb18177_glanville_post_qc_id_list.UpdateIDs.fam \
    --out /users/k1806347/brc_scratch/Analyses/GeRS_comparison/UKBB_outcomes_for_prediction/${pheno_i}/Association_withPRSs/UKBB.w_hm3.${gwas_i}.EUR-PRSs \
    --n_core 2 \
    --compare_predictors T \
    --assoc T \
    --outcome_pop_prev ${prev_i} \
    --predictors /users/k1806347/brc_scratch/Analyses/GeRS_comparison/UKBB_outcomes_for_prediction/${pheno_i}/Association_withPRSs/UKBB.w_hm3.${gwas_i}.EUR-PRSs.predictor_groups
done
TWAS gene stratified polygenic score
. /users/k1806347/brc_scratch/Software/MyGit/GenoPred/config_used/Target_scoring.config

# Make required directories
for pheno_i in $(echo Depression Intelligence BMI Height T2D CAD IBD RheuArth);do
mkdir -p /users/k1806347/brc_scratch/Analyses/GeRS_comparison/UKBB_outcomes_for_prediction/${pheno_i}/Association_withPRSs
done

# Create a file listing the predictors files
pheno=$(echo Depression Intelligence BMI Height T2D CAD IBD RheuArth)
gwas=$(echo DEPR06 COLL01 BODY03 HEIG03 DIAB05 COAD01 CROH01 RHEU01)
weights=$(cat ${TWAS_rep}/snp_weight_list.txt)

for i in $(seq 1 8);do
  pheno_i=$(echo ${pheno} | cut -f ${i} -d ' ')
  gwas_i=$(echo ${gwas} | cut -f ${i} -d ' ')

  echo "predictors group" > /users/k1806347/brc_scratch/Analyses/GeRS_comparison/UKBB_outcomes_for_prediction/${pheno_i}/Association_withPRSs/UKBB.w_hm3.${gwas_i}.EUR-PRSs-TWAS_gene_stratified.predictor_groups

  for weight in ${weights}; do
    echo ${UKBB_output}/GeRS_for_comparison/1KG_ref/EUR/${weight}/UKBB.w_hm3.EUR.${weight}.${gwas_i}.fiprofile GeRS >> /users/k1806347/brc_scratch/Analyses/GeRS_comparison/UKBB_outcomes_for_prediction/${pheno_i}/Association_withPRSs/UKBB.w_hm3.${gwas_i}.EUR-PRSs-TWAS_gene_stratified.predictor_groups
  done

    echo ${UKBB_output}/PRS_for_comparison/1KG_ref/pt_clump_stratified_TWAS_Gene/${gwas_i}/UKBB.subset.w_hm3.${gwas_i}.profiles strat_PRS >> /users/k1806347/brc_scratch/Analyses/GeRS_comparison/UKBB_outcomes_for_prediction/${pheno_i}/Association_withPRSs/UKBB.w_hm3.${gwas_i}.EUR-PRSs-TWAS_gene_stratified.predictor_groups
done

# Derive and evaluate models
pheno=$(echo Depression Intelligence BMI Height T2D CAD IBD RheuArth)
gwas=$(echo DEPR06 COLL01 BODY03 HEIG03 DIAB05 COAD01 CROH01 RHEU01)
prev=$(echo 0.15 NA NA NA 0.05 0.03 0.013 0.00164 0.005)

# 1KG reference
for i in $(seq 1 8);do
  pheno_i=$(echo ${pheno} | cut -f ${i} -d ' ')
  pheno_file_i=$(echo ${pheno_file} | cut -f ${i} -d ' ')
  gwas_i=$(echo ${gwas} | cut -f ${i} -d ' ')
  prev_i=$(echo ${prev} | cut -f ${i} -d ' ')

sbatch --mem 10G -n 2 -p brc,shared /users/k1806347/brc_scratch/Software/Rscript.sh /users/k1806347/brc_scratch/Software/MyGit/GenoPred/Scripts/Model_builder/Model_builder_V2_nested.R \
    --pheno ${UKBB_output}/Phenotype/PRS_comp_subset/UKBB.${pheno_i}.txt \
    --keep /users/k1806347/brc_scratch/Analyses/PRS_comparison/UKBB_outcomes_for_prediction/ukb18177_glanville_post_qc_id_list.UpdateIDs.fam \
    --out /users/k1806347/brc_scratch/Analyses/GeRS_comparison/UKBB_outcomes_for_prediction/${pheno_i}/Association_withPRSs/UKBB.w_hm3.${gwas_i}.EUR-PRSs-TWAS_gene_stratified \
    --n_core 2 \
    --compare_predictors F \
    --assoc F \
    --outcome_pop_prev ${prev_i} \
    --predictors /users/k1806347/brc_scratch/Analyses/GeRS_comparison/UKBB_outcomes_for_prediction/${pheno_i}/Association_withPRSs/UKBB.w_hm3.${gwas_i}.EUR-PRSs-TWAS_gene_stratified.predictor_groups
done
3.9.2 TEDS
Single-pT vs. Multi-pT
##############################
# Evaluating predictive utility of GeRS across multiple pTs individually and in combination
##############################
. /users/k1806347/brc_scratch/Software/MyGit/GenoPred/config_used/Target_scoring.config

# Make required directories
for pheno_i in $(echo Height21 BMI21 GCSE ADHD);do
mkdir -p /users/k1806347/brc_scratch/Analyses/GeRS_comparison/TEDS_outcomes_for_prediction/${pheno_i}/Association_withGeRSs
done

# Create a file listing the predictors files
pheno=$(echo Height21 BMI21 GCSE ADHD)
gwas=$(echo HEIG03 BODY11 EDUC03 ADHD04)
weights=$(cat ${TWAS_rep}/snp_weight_list.txt)

for i in $(seq 1 4);do
for weight in ${weights};do
pheno_i=$(echo ${pheno} | cut -f ${i} -d ' ')
gwas_i=$(echo ${gwas} | cut -f ${i} -d ' ')

cat > /users/k1806347/brc_scratch/Analyses/GeRS_comparison/TEDS_outcomes_for_prediction/${pheno_i}/Association_withGeRSs/TEDS.w_hm3.${weight}.${gwas_i}.EUR-GeRSs.predictor_groups <<EOF
predictors
${TEDS_output_dir}/FunctionallyInformedPolygenicScores/EUR/${weight}/TEDS.w_hm3.EUR.${weight}.${gwas_i}.fiprofile
EOF

done
done

# Derive and evaluate models
pheno=$(echo Height21 BMI21 GCSE ADHD)
gwas=$(echo HEIG03 BODY11 EDUC03 ADHD04)
prev=$(echo NA NA NA NA)
weights=$(cat ${TWAS_rep}/snp_weight_list.txt)

# 1KG reference
for i in $(seq 1 4);do
for weight in ${weights};do
  pheno_i=$(echo ${pheno} | cut -f ${i} -d ' ')
  gwas_i=$(echo ${gwas} | cut -f ${i} -d ' ')
  prev_i=$(echo ${prev} | cut -f ${i} -d ' ')

sbatch --mem 10G -n 2 -p brc,shared /users/k1806347/brc_scratch/Software/Rscript.sh /users/k1806347/brc_scratch/Software/MyGit/GenoPred/Scripts/Model_builder/Model_builder_V2_nested.R \
    --pheno ${TEDS_output_dir}/Phenotypic/Derived_outcomes/TEDS_${pheno_i}.txt \
      --keep /users/k1806347/brc_scratch/Data/TEDS/Projected_PCs/Ancestry_idenitfier/TEDS.w_hm3.AllAncestry.EUR.keep \
    --out /users/k1806347/brc_scratch/Analyses/GeRS_comparison/TEDS_outcomes_for_prediction/${pheno_i}/Association_withGeRSs/TEDS.w_hm3.${weight}.${gwas_i}.EUR-GeRSs \
    --n_core 2 \
    --compare_predictors T \
    --assoc T \
    --outcome_pop_prev ${prev_i} \
    --predictors /users/k1806347/brc_scratch/Analyses/GeRS_comparison/TEDS_outcomes_for_prediction/${pheno_i}/Association_withGeRSs/TEDS.w_hm3.${weight}.${gwas_i}.EUR-GeRSs.predictor_groups
done
sleep 60
done
Single-tissue vs. Multi-tissue
##############################
# Evaluating predictive utility of GeRS across multiple tissues individually and in combination
##############################
. /users/k1806347/brc_scratch/Software/MyGit/GenoPred/config_used/Target_scoring.config

# Create a file listing the predictors files
pheno=$(echo Height21 BMI21 GCSE ADHD)
gwas=$(echo HEIG03 BODY11 EDUC03 ADHD04)
weights=$(cat ${TWAS_rep}/snp_weight_list.txt)

for i in $(seq 1 4);do
  pheno_i=$(echo ${pheno} | cut -f ${i} -d ' ')
  gwas_i=$(echo ${gwas} | cut -f ${i} -d ' ')

  echo "predictors group" > /users/k1806347/brc_scratch/Analyses/GeRS_comparison/TEDS_outcomes_for_prediction/${pheno_i}/Association_withGeRSs/TEDS.w_hm3.AllTissue.${gwas_i}.EUR-GeRSs.predictor_groups

  for weight in ${weights}; do
    echo ${TEDS_output_dir}/FunctionallyInformedPolygenicScores/EUR/${weight}/TEDS.w_hm3.EUR.${weight}.${gwas_i}.fiprofile ${weight} >> /users/k1806347/brc_scratch/Analyses/GeRS_comparison/TEDS_outcomes_for_prediction/${pheno_i}/Association_withGeRSs/TEDS.w_hm3.AllTissue.${gwas_i}.EUR-GeRSs.predictor_groups
  done

done

# Derive and evaluate models
pheno=$(echo Height21 BMI21 GCSE ADHD)
gwas=$(echo HEIG03 BODY11 EDUC03 ADHD04)
prev=$(echo NA NA NA NA)

# 1KG reference
for i in $(seq 1 4);do
  pheno_i=$(echo ${pheno} | cut -f ${i} -d ' ')
  gwas_i=$(echo ${gwas} | cut -f ${i} -d ' ')
  prev_i=$(echo ${prev} | cut -f ${i} -d ' ')

sbatch --mem 10G -n 2 -p brc,shared /users/k1806347/brc_scratch/Software/Rscript.sh /users/k1806347/brc_scratch/Software/MyGit/GenoPred/Scripts/Model_builder/Model_builder_V2_nested.R \
    --pheno ${TEDS_output_dir}/Phenotypic/Derived_outcomes/TEDS_${pheno_i}.txt \
      --keep /users/k1806347/brc_scratch/Data/TEDS/Projected_PCs/Ancestry_idenitfier/TEDS.w_hm3.AllAncestry.EUR.keep \
    --out /users/k1806347/brc_scratch/Analyses/GeRS_comparison/TEDS_outcomes_for_prediction/${pheno_i}/Association_withGeRSs/TEDS.w_hm3.AllTissue.${gwas_i}.EUR-GeRSs \
    --n_core 2 \
    --compare_predictors F \
    --assoc T \
    --outcome_pop_prev ${prev_i} \
    --predictors /users/k1806347/brc_scratch/Analyses/GeRS_comparison/TEDS_outcomes_for_prediction/${pheno_i}/Association_withGeRSs/TEDS.w_hm3.AllTissue.${gwas_i}.EUR-GeRSs.predictor_groups
done
Multi-tissue per pT
##############################
# Evaluating predictive utility of GeRS across multiple tissues for each pT seperately
##############################
. /users/k1806347/brc_scratch/Software/MyGit/GenoPred/config_used/Target_scoring.config

# Split the GeRS files by pT
module add apps/R
R

source('/users/k1806347/brc_scratch/Software/MyGit/GenoPred/config_used/Target_scoring.config')

gwas<-c('HEIG03','BODY11','EDUC03','ADHD04')

weights<-read.table('~/brc_scratch/Data/TWAS_sumstats/FUSION/snp_weight_list.txt', stringsAsFactors=F)$V1

library(data.table)

for(gwas_i in gwas){
print(gwas_i)
  for(weights_i in weights){

    GeRS<-fread(paste0(TEDS_output_dir,'/FunctionallyInformedPolygenicScores/EUR/',weights_i,'/TEDS.w_hm3.EUR.',weights_i,'.',gwas_i,'.fiprofile'))

    GeRS_pT<-gsub('.*_','',names(GeRS)[-1:-2])

    for(pT_i in GeRS_pT){
      write.table(GeRS[,c('FID','IID',paste0(gwas_i,'_',pT_i)), with=F], paste0(TEDS_output_dir,'/FunctionallyInformedPolygenicScores/EUR/',weights_i,'/TEDS.w_hm3.EUR.',weights_i,'.',gwas_i,'.pT_',pT_i,'.fiprofile'),col.names=T, row.names=F, quote=F)
    }
  }
}

q()
n

# Create a file listing the predictors files
pheno=$(echo Height21 BMI21 GCSE ADHD)
gwas=$(echo HEIG03 BODY11 EDUC03 ADHD04)
weights=$(cat ${TWAS_rep}/snp_weight_list.txt)
pT=$(echo 1e-06 1e-05 1e-04 0.001 0.01 0.05 0.1 0.5 1)

for i in $(seq 1 4);do
  pheno_i=$(echo ${pheno} | cut -f ${i} -d ' ')
  gwas_i=$(echo ${gwas} | cut -f ${i} -d ' ')

  echo "predictors group" > /users/k1806347/brc_scratch/Analyses/GeRS_comparison/TEDS_outcomes_for_prediction/${pheno_i}/Association_withGeRSs/TEDS.w_hm3.AllTissue.${gwas_i}.EUR-GeRSs.per_PT.predictor_groups

  for pT_i in ${pT};do
    for weight in ${weights}; do
        if [ -f ${TEDS_output_dir}/FunctionallyInformedPolygenicScores/EUR/${weight}/TEDS.w_hm3.EUR.${weight}.${gwas_i}.pT_${pT_i}.fiprofile ]; then

        echo ${TEDS_output_dir}/FunctionallyInformedPolygenicScores/EUR/${weight}/TEDS.w_hm3.EUR.${weight}.${gwas_i}.pT_${pT_i}.fiprofile ${pT_i} >> /users/k1806347/brc_scratch/Analyses/GeRS_comparison/TEDS_outcomes_for_prediction/${pheno_i}/Association_withGeRSs/TEDS.w_hm3.AllTissue.${gwas_i}.EUR-GeRSs.per_PT.predictor_groups

        fi
    done
  done

done

# Derive and evaluate models
pheno=$(echo Height21 BMI21 GCSE ADHD)
gwas=$(echo HEIG03 BODY11 EDUC03 ADHD04)
prev=$(echo NA NA NA NA)

# 1KG reference
for i in $(seq 1 4);do
  pheno_i=$(echo ${pheno} | cut -f ${i} -d ' ')
  pheno_file_i=$(echo ${pheno_file} | cut -f ${i} -d ' ')
  gwas_i=$(echo ${gwas} | cut -f ${i} -d ' ')
  prev_i=$(echo ${prev} | cut -f ${i} -d ' ')

sbatch --mem 10G -n 2 -p brc,shared /users/k1806347/brc_scratch/Software/Rscript.sh /users/k1806347/brc_scratch/Software/MyGit/GenoPred/Scripts/Model_builder/Model_builder_V2_nested.R \
    --pheno ${TEDS_output_dir}/Phenotypic/Derived_outcomes/TEDS_${pheno_i}.txt \
      --keep /users/k1806347/brc_scratch/Data/TEDS/Projected_PCs/Ancestry_idenitfier/TEDS.w_hm3.AllAncestry.EUR.keep \
    --out /users/k1806347/brc_scratch/Analyses/GeRS_comparison/TEDS_outcomes_for_prediction/${pheno_i}/Association_withGeRSs/TEDS.w_hm3.AllTissue.${gwas_i}.EUR-GeRSs.per_PT \
    --n_core 2 \
    --compare_predictors F \
    --assoc T \
    --outcome_pop_prev ${prev_i} \
    --predictors /users/k1806347/brc_scratch/Analyses/GeRS_comparison/TEDS_outcomes_for_prediction/${pheno_i}/Association_withGeRSs/TEDS.w_hm3.AllTissue.${gwas_i}.EUR-GeRSs.per_PT.predictor_groups

done
Single-tissue vs. Multi-tissue (PP4+clump)
##############################
# Evaluating predictive utility of GeRS across multiple tissues individually and in combination
##############################
. /users/k1806347/brc_scratch/Software/MyGit/GenoPred/config_used/Target_scoring.config

# Create a file listing the predictors files
pheno=$(echo Height21 BMI21 GCSE ADHD)
gwas=$(echo HEIG03 BODY11 EDUC03 ADHD04)
weights=$(cat ${TWAS_rep}/snp_weight_list.txt)

for i in $(seq 1 4);do
  pheno_i=$(echo ${pheno} | cut -f ${i} -d ' ')
  gwas_i=$(echo ${gwas} | cut -f ${i} -d ' ')

  echo "predictors group" > /users/k1806347/brc_scratch/Analyses/GeRS_comparison/TEDS_outcomes_for_prediction/${pheno_i}/Association_withGeRSs/TEDS.w_hm3.AllTissue.${gwas_i}.EUR-GeRSs_PP4.predictor_groups

  for weight in ${weights}; do
    echo ${TEDS_output_dir}/FunctionallyInformedPolygenicScores_withCOLOC/EUR/${weight}/TEDS.w_hm3.EUR.${weight}.${gwas_i}.fiprofile ${weight} >> /users/k1806347/brc_scratch/Analyses/GeRS_comparison/TEDS_outcomes_for_prediction/${pheno_i}/Association_withGeRSs/TEDS.w_hm3.AllTissue.${gwas_i}.EUR-GeRSs_PP4.predictor_groups
  done

done

# Derive and evaluate models
pheno=$(echo Height21 BMI21 GCSE ADHD)
gwas=$(echo HEIG03 BODY11 EDUC03 ADHD04)
prev=$(echo NA NA NA NA)

# 1KG reference
for i in $(seq 1 4);do
  pheno_i=$(echo ${pheno} | cut -f ${i} -d ' ')
  gwas_i=$(echo ${gwas} | cut -f ${i} -d ' ')
  prev_i=$(echo ${prev} | cut -f ${i} -d ' ')

sbatch --mem 10G -n 2 -p brc,shared /users/k1806347/brc_scratch/Software/Rscript.sh /users/k1806347/brc_scratch/Software/MyGit/GenoPred/Scripts/Model_builder/Model_builder_V2_nested.R \
    --pheno ${TEDS_output_dir}/Phenotypic/Derived_outcomes/TEDS_${pheno_i}.txt \
      --keep /users/k1806347/brc_scratch/Data/TEDS/Projected_PCs/Ancestry_idenitfier/TEDS.w_hm3.AllAncestry.EUR.keep \
    --out /users/k1806347/brc_scratch/Analyses/GeRS_comparison/TEDS_outcomes_for_prediction/${pheno_i}/Association_withGeRSs/TEDS.w_hm3.AllTissue.${gwas_i}.EUR-GeRSs_PP4 \
    --n_core 2 \
    --compare_predictors F \
    --assoc T \
    --outcome_pop_prev ${prev_i} \
    --predictors /users/k1806347/brc_scratch/Analyses/GeRS_comparison/TEDS_outcomes_for_prediction/${pheno_i}/Association_withGeRSs/TEDS.w_hm3.AllTissue.${gwas_i}.EUR-GeRSs_PP4.predictor_groups
done
Single-tissue vs. Multi-tissue (Tissue Specific)
##############################
# Evaluating predictive utility of GeRS across multiple tissues individually and in combination
##############################
. /users/k1806347/brc_scratch/Software/MyGit/GenoPred/config_used/Target_scoring.config

# Create a file listing the predictors files
pheno=$(echo Height21 BMI21 GCSE ADHD)
gwas=$(echo HEIG03 BODY11 EDUC03 ADHD04)
weights=$(cat ${TWAS_rep}/snp_weight_list.txt)

for i in $(seq 1 4);do
  pheno_i=$(echo ${pheno} | cut -f ${i} -d ' ')
  gwas_i=$(echo ${gwas} | cut -f ${i} -d ' ')

  echo "predictors group" > /users/k1806347/brc_scratch/Analyses/GeRS_comparison/TEDS_outcomes_for_prediction/${pheno_i}/Association_withGeRSs/TEDS.w_hm3.AllTissue.TissueSpecific.${gwas_i}.EUR-GeRSs.predictor_groups

  for weight in ${weights}; do
    echo ${TEDS_output_dir}/FunctionallyInformedPolygenicScores/EUR/${weight}/TEDS.w_hm3.EUR.TissueSpecific.${weight}.${gwas_i}.fiprofile ${weight} >> /users/k1806347/brc_scratch/Analyses/GeRS_comparison/TEDS_outcomes_for_prediction/${pheno_i}/Association_withGeRSs/TEDS.w_hm3.AllTissue.TissueSpecific.${gwas_i}.EUR-GeRSs.predictor_groups
  done

done

# Derive and evaluate models
pheno=$(echo Height21 BMI21 GCSE ADHD)
gwas=$(echo HEIG03 BODY11 EDUC03 ADHD04)
prev=$(echo NA NA NA NA)

# 1KG reference
for i in $(seq 1 4);do
  pheno_i=$(echo ${pheno} | cut -f ${i} -d ' ')
  gwas_i=$(echo ${gwas} | cut -f ${i} -d ' ')
  prev_i=$(echo ${prev} | cut -f ${i} -d ' ')

sbatch --mem 10G -n 2 -p brc,shared /users/k1806347/brc_scratch/Software/Rscript.sh /users/k1806347/brc_scratch/Software/MyGit/GenoPred/Scripts/Model_builder/Model_builder_V2_nested.R \
    --pheno ${TEDS_output_dir}/Phenotypic/Derived_outcomes/TEDS_${pheno_i}.txt \
      --keep /users/k1806347/brc_scratch/Data/TEDS/Projected_PCs/Ancestry_idenitfier/TEDS.w_hm3.AllAncestry.EUR.keep \
    --out /users/k1806347/brc_scratch/Analyses/GeRS_comparison/TEDS_outcomes_for_prediction/${pheno_i}/Association_withGeRSs/TEDS.w_hm3.AllTissue.TissueSpecific.${gwas_i}.EUR-GeRSs \
    --n_core 2 \
    --compare_predictors F \
    --assoc T \
    --outcome_pop_prev ${prev_i} \
    --predictors /users/k1806347/brc_scratch/Analyses/GeRS_comparison/TEDS_outcomes_for_prediction/${pheno_i}/Association_withGeRSs/TEDS.w_hm3.AllTissue.TissueSpecific.${gwas_i}.EUR-GeRSs.predictor_groups
done
Single-tissue vs. Multi-tissue (colocalised)
##############################
# Evaluating predictive utility of GeRS across multiple tissues individually and in combination
##############################
. /users/k1806347/brc_scratch/Software/MyGit/GenoPred/config_used/Target_scoring.config

# Create a file listing the predictors files
pheno=$(echo Height21 BMI21 GCSE ADHD)
gwas=$(echo HEIG03 BODY11 EDUC03 ADHD04)
weights=$(cat ${TWAS_rep}/snp_weight_list.txt)

for i in $(seq 1 4);do
  pheno_i=$(echo ${pheno} | cut -f ${i} -d ' ')
  gwas_i=$(echo ${gwas} | cut -f ${i} -d ' ')

  echo "predictors group" > /users/k1806347/brc_scratch/Analyses/GeRS_comparison/TEDS_outcomes_for_prediction/${pheno_i}/Association_withGeRSs/TEDS.w_hm3.AllTissue.${gwas_i}.EUR-GeRSs_pT_withColoc.predictor_groups

  for weight in ${weights}; do
    echo ${TEDS_output_dir}/FunctionallyInformedPolygenicScores_pT_withColoc/EUR/${weight}/TEDS.w_hm3.EUR.${weight}.${gwas_i}.fiprofile ${weight} >> /users/k1806347/brc_scratch/Analyses/GeRS_comparison/TEDS_outcomes_for_prediction/${pheno_i}/Association_withGeRSs/TEDS.w_hm3.AllTissue.${gwas_i}.EUR-GeRSs_pT_withColoc.predictor_groups
  done

done

# Derive and evaluate models
pheno=$(echo Height21 BMI21 GCSE ADHD)
gwas=$(echo HEIG03 BODY11 EDUC03 ADHD04)
prev=$(echo NA NA NA NA)

# 1KG reference
for i in $(seq 1 4);do
  pheno_i=$(echo ${pheno} | cut -f ${i} -d ' ')
  gwas_i=$(echo ${gwas} | cut -f ${i} -d ' ')
  prev_i=$(echo ${prev} | cut -f ${i} -d ' ')

sbatch --mem 10G -n 2 -p brc,shared /users/k1806347/brc_scratch/Software/Rscript.sh /users/k1806347/brc_scratch/Software/MyGit/GenoPred/Scripts/Model_builder/Model_builder_V2_nested.R \
    --pheno ${TEDS_output_dir}/Phenotypic/Derived_outcomes/TEDS_${pheno_i}.txt \
      --keep /users/k1806347/brc_scratch/Data/TEDS/Projected_PCs/Ancestry_idenitfier/TEDS.w_hm3.AllAncestry.EUR.keep \
    --out /users/k1806347/brc_scratch/Analyses/GeRS_comparison/TEDS_outcomes_for_prediction/${pheno_i}/Association_withGeRSs/TEDS.w_hm3.AllTissue.${gwas_i}.EUR-GeRSs_pT_withColoc \
    --n_core 2 \
    --compare_predictors F \
    --assoc T \
    --outcome_pop_prev ${prev_i} \
    --predictors /users/k1806347/brc_scratch/Analyses/GeRS_comparison/TEDS_outcomes_for_prediction/${pheno_i}/Association_withGeRSs/TEDS.w_hm3.AllTissue.${gwas_i}.EUR-GeRSs_pT_withColoc.predictor_groups
done
Multi-tissue per pT (colocalised)
##############################
# Evaluating predictive utility of GeRS across multiple tissues for each pT seperately
##############################
. /users/k1806347/brc_scratch/Software/MyGit/GenoPred/config_used/Target_scoring.config

# Split the GeRS files by pT
module add apps/R
R

source('/users/k1806347/brc_scratch/Software/MyGit/GenoPred/config_used/Target_scoring.config')

gwas<-c('HEIG03','BODY11','EDUC03','ADHD04')

weights<-read.table('~/brc_scratch/Data/TWAS_sumstats/FUSION/snp_weight_list.txt', stringsAsFactors=F)$V1

library(data.table)

for(gwas_i in gwas){
print(gwas_i)
  for(weights_i in weights){
    if(file.exists(paste0(TEDS_output_dir,'/FunctionallyInformedPolygenicScores_pT_withColoc/EUR/',weights_i,'/TEDS.w_hm3.EUR.',weights_i,'.',gwas_i,'.fiprofile')) == T){
      GeRS<-fread(paste0(TEDS_output_dir,'/FunctionallyInformedPolygenicScores_pT_withColoc/EUR/',weights_i,'/TEDS.w_hm3.EUR.',weights_i,'.',gwas_i,'.fiprofile'))

      GeRS_pT<-gsub('.*_','',names(GeRS)[-1:-2])

      for(pT_i in GeRS_pT){
        write.table(GeRS[,c('FID','IID',paste0(gwas_i,'_',pT_i)), with=F], paste0(TEDS_output_dir,'/FunctionallyInformedPolygenicScores_pT_withColoc/EUR/',weights_i,'/TEDS.w_hm3.EUR.',weights_i,'.',gwas_i,'.pT_',pT_i,'.fiprofile'),col.names=T, row.names=F, quote=F)
      }
    }
  }
}

q()
n

# Create a file listing the predictors files
pheno=$(echo Height21 BMI21 GCSE ADHD)
gwas=$(echo HEIG03 BODY11 EDUC03 ADHD04)
weights=$(cat ${TWAS_rep}/snp_weight_list.txt)
pT=$(echo 1e-06 1e-05 1e-04 0.001 0.01 0.05 0.1 0.5 1)

for i in $(seq 1 4);do
  pheno_i=$(echo ${pheno} | cut -f ${i} -d ' ')
  gwas_i=$(echo ${gwas} | cut -f ${i} -d ' ')

  echo "predictors group" > /users/k1806347/brc_scratch/Analyses/GeRS_comparison/TEDS_outcomes_for_prediction/${pheno_i}/Association_withGeRSs/TEDS.w_hm3.AllTissue.${gwas_i}.EUR-GeRSs_pT_withColoc.per_PT.predictor_groups

  for pT_i in ${pT};do
    for weight in ${weights}; do
        if [ -f ${TEDS_output_dir}/FunctionallyInformedPolygenicScores_pT_withColoc/EUR/${weight}/TEDS.w_hm3.EUR.${weight}.${gwas_i}.pT_${pT_i}.fiprofile ]; then

        echo ${TEDS_output_dir}/FunctionallyInformedPolygenicScores_pT_withColoc/EUR/${weight}/TEDS.w_hm3.EUR.${weight}.${gwas_i}.pT_${pT_i}.fiprofile ${pT_i} >> /users/k1806347/brc_scratch/Analyses/GeRS_comparison/TEDS_outcomes_for_prediction/${pheno_i}/Association_withGeRSs/TEDS.w_hm3.AllTissue.${gwas_i}.EUR-GeRSs_pT_withColoc.per_PT.predictor_groups

        fi
    done
  done

done

# Derive and evaluate models
pheno=$(echo Height21 BMI21 GCSE ADHD)
gwas=$(echo HEIG03 BODY11 EDUC03 ADHD04)
prev=$(echo NA NA NA NA)

# 1KG reference
for i in $(seq 1 4);do
  pheno_i=$(echo ${pheno} | cut -f ${i} -d ' ')
  pheno_file_i=$(echo ${pheno_file} | cut -f ${i} -d ' ')
  gwas_i=$(echo ${gwas} | cut -f ${i} -d ' ')
  prev_i=$(echo ${prev} | cut -f ${i} -d ' ')

sbatch --mem 10G -n 2 -p brc,shared /users/k1806347/brc_scratch/Software/Rscript.sh /users/k1806347/brc_scratch/Software/MyGit/GenoPred/Scripts/Model_builder/Model_builder_V2_nested.R \
    --pheno ${TEDS_output_dir}/Phenotypic/Derived_outcomes/TEDS_${pheno_i}.txt \
      --keep /users/k1806347/brc_scratch/Data/TEDS/Projected_PCs/Ancestry_idenitfier/TEDS.w_hm3.AllAncestry.EUR.keep \
    --out /users/k1806347/brc_scratch/Analyses/GeRS_comparison/TEDS_outcomes_for_prediction/${pheno_i}/Association_withGeRSs/TEDS.w_hm3.AllTissue.${gwas_i}.EUR-GeRSs_pT_withColoc.per_PT \
    --n_core 2 \
    --compare_predictors F \
    --assoc T \
    --outcome_pop_prev ${prev_i} \
    --predictors /users/k1806347/brc_scratch/Analyses/GeRS_comparison/TEDS_outcomes_for_prediction/${pheno_i}/Association_withGeRSs/TEDS.w_hm3.AllTissue.${gwas_i}.EUR-GeRSs_pT_withColoc.per_PT.predictor_groups

done
GeRS + PRS
##############################
# Evaluating predictive utility of GeRS and PRS individually and in combination
##############################
. /users/k1806347/brc_scratch/Software/MyGit/GenoPred/config_used/Target_scoring.config

# Make required directories
for pheno_i in $(echo Height21 BMI21 GCSE ADHD);do
mkdir -p /users/k1806347/brc_scratch/Analyses/GeRS_comparison/TEDS_outcomes_for_prediction/${pheno_i}/Association_withPRS_and_GeRSs
done

# Create a file listing the predictors files
pheno=$(echo Height21 BMI21 GCSE ADHD)
gwas=$(echo HEIG03 BODY11 EDUC03 ADHD04)
weights=$(cat ${TWAS_rep}/snp_weight_list.txt)

for i in $(seq 1 4);do
  pheno_i=$(echo ${pheno} | cut -f ${i} -d ' ')
  gwas_i=$(echo ${gwas} | cut -f ${i} -d ' ')

  echo "predictors group" > /users/k1806347/brc_scratch/Analyses/GeRS_comparison/TEDS_outcomes_for_prediction/${pheno_i}/Association_withPRS_and_GeRSs/TEDS.w_hm3.AllTissue.${gwas_i}.EUR-GeRSs.EUR-PRSs.pt_clump.predictor_groups

  for weight in ${weights}; do
    echo ${TEDS_output_dir}/FunctionallyInformedPolygenicScores/EUR/${weight}/TEDS.w_hm3.EUR.${weight}.${gwas_i}.fiprofile GeRS >> /users/k1806347/brc_scratch/Analyses/GeRS_comparison/TEDS_outcomes_for_prediction/${pheno_i}/Association_withPRS_and_GeRSs/TEDS.w_hm3.AllTissue.${gwas_i}.EUR-GeRSs.EUR-PRSs.pt_clump.predictor_groups
  done

    echo ${TEDS_output_dir}/PolygenicScores/EUR/${gwas_i}/TEDS.w_hm3.${gwas_i}.EUR.profiles PRS >> /users/k1806347/brc_scratch/Analyses/GeRS_comparison/TEDS_outcomes_for_prediction/${pheno_i}/Association_withPRS_and_GeRSs/TEDS.w_hm3.AllTissue.${gwas_i}.EUR-GeRSs.EUR-PRSs.pt_clump.predictor_groups
done

# Derive and evaluate models
pheno=$(echo Height21 BMI21 GCSE ADHD)
gwas=$(echo HEIG03 BODY11 EDUC03 ADHD04)
prev=$(echo NA NA NA NA)

# 1KG reference
for i in $(seq 1 4);do
  pheno_i=$(echo ${pheno} | cut -f ${i} -d ' ')
  gwas_i=$(echo ${gwas} | cut -f ${i} -d ' ')
  prev_i=$(echo ${prev} | cut -f ${i} -d ' ')

sbatch --mem 10G -n 2 -p brc,shared /users/k1806347/brc_scratch/Software/Rscript.sh /users/k1806347/brc_scratch/Software/MyGit/GenoPred/Scripts/Model_builder/Model_builder_V2_nested.R \
    --pheno ${TEDS_output_dir}/Phenotypic/Derived_outcomes/TEDS_${pheno_i}.txt \
      --keep /users/k1806347/brc_scratch/Data/TEDS/Projected_PCs/Ancestry_idenitfier/TEDS.w_hm3.AllAncestry.EUR.keep \
    --out /users/k1806347/brc_scratch/Analyses/GeRS_comparison/TEDS_outcomes_for_prediction/${pheno_i}/Association_withPRS_and_GeRSs/TEDS.w_hm3.AllTissue.${gwas_i}.EUR-GeRSs.EUR-PRSs.pt_clump \
    --n_core 2 \
    --compare_predictors F \
    --assoc T \
    --outcome_pop_prev ${prev_i} \
    --predictors /users/k1806347/brc_scratch/Analyses/GeRS_comparison/TEDS_outcomes_for_prediction/${pheno_i}/Association_withPRS_and_GeRSs/TEDS.w_hm3.AllTissue.${gwas_i}.EUR-GeRSs.EUR-PRSs.pt_clump.predictor_groups
done
GeRS + PRS (PP4+clump)
##############################
# Evaluating predictive utility of GeRS and PRS individually and in combination
##############################
. /users/k1806347/brc_scratch/Software/MyGit/GenoPred/config_used/Target_scoring.config

# Make required directories
for pheno_i in $(echo Height21 BMI21 GCSE ADHD);do
mkdir -p /users/k1806347/brc_scratch/Analyses/GeRS_comparison/TEDS_outcomes_for_prediction/${pheno_i}/Association_withPRS_and_GeRSs
done

# Create a file listing the predictors files
pheno=$(echo Height21 BMI21 GCSE ADHD)
gwas=$(echo HEIG03 BODY11 EDUC03 ADHD04)
weights=$(cat ${TWAS_rep}/snp_weight_list.txt)

for i in $(seq 1 4);do
  pheno_i=$(echo ${pheno} | cut -f ${i} -d ' ')
  gwas_i=$(echo ${gwas} | cut -f ${i} -d ' ')

  echo "predictors group" > /users/k1806347/brc_scratch/Analyses/GeRS_comparison/TEDS_outcomes_for_prediction/${pheno_i}/Association_withPRS_and_GeRSs/TEDS.w_hm3.AllTissue.${gwas_i}.EUR-GeRSs_PP4.EUR-PRSs.pt_clump.predictor_groups

  for weight in ${weights}; do
    echo ${TEDS_output_dir}/FunctionallyInformedPolygenicScores_withCOLOC/EUR/${weight}/TEDS.w_hm3.EUR.${weight}.${gwas_i}.fiprofile GeRS >> /users/k1806347/brc_scratch/Analyses/GeRS_comparison/TEDS_outcomes_for_prediction/${pheno_i}/Association_withPRS_and_GeRSs/TEDS.w_hm3.AllTissue.${gwas_i}.EUR-GeRSs_PP4.EUR-PRSs.pt_clump.predictor_groups
  done

    echo ${TEDS_output_dir}/PolygenicScores/EUR/${gwas_i}/TEDS.w_hm3.${gwas_i}.EUR.profiles PRS >> /users/k1806347/brc_scratch/Analyses/GeRS_comparison/TEDS_outcomes_for_prediction/${pheno_i}/Association_withPRS_and_GeRSs/TEDS.w_hm3.AllTissue.${gwas_i}.EUR-GeRSs_PP4.EUR-PRSs.pt_clump.predictor_groups
done

# Derive and evaluate models
pheno=$(echo Height21 BMI21 GCSE ADHD)
gwas=$(echo HEIG03 BODY11 EDUC03 ADHD04)
prev=$(echo NA NA NA NA)

# 1KG reference
for i in $(seq 1 4);do
  pheno_i=$(echo ${pheno} | cut -f ${i} -d ' ')
  gwas_i=$(echo ${gwas} | cut -f ${i} -d ' ')
  prev_i=$(echo ${prev} | cut -f ${i} -d ' ')

sbatch --mem 10G -n 2 -p brc,shared /users/k1806347/brc_scratch/Software/Rscript.sh /users/k1806347/brc_scratch/Software/MyGit/GenoPred/Scripts/Model_builder/Model_builder_V2_nested.R \
    --pheno ${TEDS_output_dir}/Phenotypic/Derived_outcomes/TEDS_${pheno_i}.txt \
      --keep /users/k1806347/brc_scratch/Data/TEDS/Projected_PCs/Ancestry_idenitfier/TEDS.w_hm3.AllAncestry.EUR.keep \
    --out /users/k1806347/brc_scratch/Analyses/GeRS_comparison/TEDS_outcomes_for_prediction/${pheno_i}/Association_withPRS_and_GeRSs/TEDS.w_hm3.AllTissue.${gwas_i}.EUR-GeRSs_PP4.EUR-PRSs.pt_clump \
    --n_core 2 \
    --compare_predictors F \
    --assoc T \
    --outcome_pop_prev ${prev_i} \
    --predictors /users/k1806347/brc_scratch/Analyses/GeRS_comparison/TEDS_outcomes_for_prediction/${pheno_i}/Association_withPRS_and_GeRSs/TEDS.w_hm3.AllTissue.${gwas_i}.EUR-GeRSs_PP4.EUR-PRSs.pt_clump.predictor_groups
done
GeRS + PRS (Tissue Specific)
##############################
# Evaluating predictive utility of GeRS and PRS individually and in combination
##############################
. /users/k1806347/brc_scratch/Software/MyGit/GenoPred/config_used/Target_scoring.config

# Make required directories
for pheno_i in $(echo Height21 BMI21 GCSE ADHD);do
mkdir -p /users/k1806347/brc_scratch/Analyses/GeRS_comparison/TEDS_outcomes_for_prediction/${pheno_i}/Association_withPRS_and_GeRSs
done

# Create a file listing the predictors files
pheno=$(echo Height21 BMI21 GCSE ADHD)
gwas=$(echo HEIG03 BODY11 EDUC03 ADHD04)
weights=$(cat ${TWAS_rep}/snp_weight_list.txt)

for i in $(seq 1 4);do
  pheno_i=$(echo ${pheno} | cut -f ${i} -d ' ')
  gwas_i=$(echo ${gwas} | cut -f ${i} -d ' ')

  echo "predictors group" > /users/k1806347/brc_scratch/Analyses/GeRS_comparison/TEDS_outcomes_for_prediction/${pheno_i}/Association_withPRS_and_GeRSs/TEDS.w_hm3.AllTissue.TissueSpecific.${gwas_i}.EUR-GeRSs.EUR-PRSs.pt_clump.predictor_groups

  for weight in ${weights}; do
    echo ${TEDS_output_dir}/FunctionallyInformedPolygenicScores/EUR/${weight}/TEDS.w_hm3.EUR.TissueSpecific.${weight}.${gwas_i}.fiprofile GeRS >> /users/k1806347/brc_scratch/Analyses/GeRS_comparison/TEDS_outcomes_for_prediction/${pheno_i}/Association_withPRS_and_GeRSs/TEDS.w_hm3.AllTissue.TissueSpecific.${gwas_i}.EUR-GeRSs.EUR-PRSs.pt_clump.predictor_groups
  done

    echo ${TEDS_output_dir}/PolygenicScores/EUR/${gwas_i}/TEDS.w_hm3.${gwas_i}.EUR.profiles PRS >> /users/k1806347/brc_scratch/Analyses/GeRS_comparison/TEDS_outcomes_for_prediction/${pheno_i}/Association_withPRS_and_GeRSs/TEDS.w_hm3.AllTissue.TissueSpecific.${gwas_i}.EUR-GeRSs.EUR-PRSs.pt_clump.predictor_groups
done

# Derive and evaluate models
pheno=$(echo Height21 BMI21 GCSE ADHD)
gwas=$(echo HEIG03 BODY11 EDUC03 ADHD04)
prev=$(echo NA NA NA NA)

# 1KG reference
for i in $(seq 1 4);do
  pheno_i=$(echo ${pheno} | cut -f ${i} -d ' ')
  gwas_i=$(echo ${gwas} | cut -f ${i} -d ' ')
  prev_i=$(echo ${prev} | cut -f ${i} -d ' ')

sbatch --mem 10G -n 2 -p brc,shared /users/k1806347/brc_scratch/Software/Rscript.sh /users/k1806347/brc_scratch/Software/MyGit/GenoPred/Scripts/Model_builder/Model_builder_V2_nested.R \
    --pheno ${TEDS_output_dir}/Phenotypic/Derived_outcomes/TEDS_${pheno_i}.txt \
      --keep /users/k1806347/brc_scratch/Data/TEDS/Projected_PCs/Ancestry_idenitfier/TEDS.w_hm3.AllAncestry.EUR.keep \
    --out /users/k1806347/brc_scratch/Analyses/GeRS_comparison/TEDS_outcomes_for_prediction/${pheno_i}/Association_withPRS_and_GeRSs/TEDS.w_hm3.AllTissue.TissueSpecific.${gwas_i}.EUR-GeRSs.EUR-PRSs.pt_clump \
    --n_core 2 \
    --compare_predictors F \
    --assoc T \
    --outcome_pop_prev ${prev_i} \
    --predictors /users/k1806347/brc_scratch/Analyses/GeRS_comparison/TEDS_outcomes_for_prediction/${pheno_i}/Association_withPRS_and_GeRSs/TEDS.w_hm3.AllTissue.TissueSpecific.${gwas_i}.EUR-GeRSs.EUR-PRSs.pt_clump.predictor_groups
done
GeRS + PRScs
##############################
# Evaluating predictive utility of GeRS and PRS individually and in combination
##############################
. /users/k1806347/brc_scratch/Software/MyGit/GenoPred/config_used/Target_scoring.config

# Make required directories
for pheno_i in $(echo Height21 BMI21 GCSE ADHD);do
mkdir -p /users/k1806347/brc_scratch/Analyses/GeRS_comparison/TEDS_outcomes_for_prediction/${pheno_i}/Association_withPRS_and_GeRSs
done

# Create a file listing the predictors files
pheno=$(echo Height21 BMI21 GCSE ADHD)
gwas=$(echo HEIG03 BODY11 EDUC03 ADHD04)
weights=$(cat ${TWAS_rep}/snp_weight_list.txt)

for i in $(seq 1 4);do
  pheno_i=$(echo ${pheno} | cut -f ${i} -d ' ')
  gwas_i=$(echo ${gwas} | cut -f ${i} -d ' ')

  echo "predictors group" > /users/k1806347/brc_scratch/Analyses/GeRS_comparison/TEDS_outcomes_for_prediction/${pheno_i}/Association_withPRS_and_GeRSs/TEDS.w_hm3.AllTissue.${gwas_i}.EUR-GeRSs.EUR-PRSs.PRScs.predictor_groups

  for weight in ${weights}; do
    echo ${TEDS_output_dir}/FunctionallyInformedPolygenicScores/EUR/${weight}/TEDS.w_hm3.EUR.${weight}.${gwas_i}.fiprofile GeRS >> /users/k1806347/brc_scratch/Analyses/GeRS_comparison/TEDS_outcomes_for_prediction/${pheno_i}/Association_withPRS_and_GeRSs/TEDS.w_hm3.AllTissue.${gwas_i}.EUR-GeRSs.EUR-PRSs.PRScs.predictor_groups
  done

    echo ${TEDS_output_dir}/PolygenicScores_PRScs/EUR/${gwas_i}/TEDS.w_hm3.${gwas_i}.EUR.PRScs_profiles PRS >> /users/k1806347/brc_scratch/Analyses/GeRS_comparison/TEDS_outcomes_for_prediction/${pheno_i}/Association_withPRS_and_GeRSs/TEDS.w_hm3.AllTissue.${gwas_i}.EUR-GeRSs.EUR-PRSs.PRScs.predictor_groups
done

# Derive and evaluate models
pheno=$(echo Height21 BMI21 GCSE ADHD)
gwas=$(echo HEIG03 BODY11 EDUC03 ADHD04)
prev=$(echo NA NA NA NA)

# 1KG reference
for i in $(seq 1 4);do
  pheno_i=$(echo ${pheno} | cut -f ${i} -d ' ')
  gwas_i=$(echo ${gwas} | cut -f ${i} -d ' ')
  prev_i=$(echo ${prev} | cut -f ${i} -d ' ')

sbatch --mem 10G -n 2 -p brc,shared /users/k1806347/brc_scratch/Software/Rscript.sh /users/k1806347/brc_scratch/Software/MyGit/GenoPred/Scripts/Model_builder/Model_builder_V2_nested.R \
    --pheno ${TEDS_output_dir}/Phenotypic/Derived_outcomes/TEDS_${pheno_i}.txt \
      --keep /users/k1806347/brc_scratch/Data/TEDS/Projected_PCs/Ancestry_idenitfier/TEDS.w_hm3.AllAncestry.EUR.keep \
    --out /users/k1806347/brc_scratch/Analyses/GeRS_comparison/TEDS_outcomes_for_prediction/${pheno_i}/Association_withPRS_and_GeRSs/TEDS.w_hm3.AllTissue.${gwas_i}.EUR-GeRSs.EUR-PRSs.PRScs \
    --n_core 2 \
    --compare_predictors F \
    --assoc T \
    --outcome_pop_prev ${prev_i} \
    --predictors /users/k1806347/brc_scratch/Analyses/GeRS_comparison/TEDS_outcomes_for_prediction/${pheno_i}/Association_withPRS_and_GeRSs/TEDS.w_hm3.AllTissue.${gwas_i}.EUR-GeRSs.EUR-PRSs.PRScs.predictor_groups
done
pT + clump comparison
##############################
# Evaluating predictive utility of pT + clump PRSs across multiple pTs individually and in combination
##############################

# Make required directories
for pheno_i in $(echo Height21 BMI21 GCSE ADHD);do
mkdir -p /users/k1806347/brc_scratch/Analyses/GeRS_comparison/TEDS_outcomes_for_prediction/${pheno_i}/Association_withPRSs
done

# Create a file listing the predictors files
pheno=$(echo Height21 BMI21 GCSE ADHD)
gwas=$(echo HEIG03 BODY11 EDUC03 ADHD04)

for i in $(seq 1 4);do
pheno_i=$(echo ${pheno} | cut -f ${i} -d ' ')
gwas_i=$(echo ${gwas} | cut -f ${i} -d ' ')

cat > /users/k1806347/brc_scratch/Analyses/GeRS_comparison/TEDS_outcomes_for_prediction/${pheno_i}/Association_withPRSs/TEDS.w_hm3.${gwas_i}.EUR-PRSs.predictor_groups <<EOF
predictors
/users/k1806347/brc_scratch/Data/TEDS/PolygenicScores/EUR/${gwas_i}/TEDS.w_hm3.${gwas_i}.EUR.profiles
EOF

done

pheno=$(echo Height21 BMI21 GCSE ADHD)
gwas=$(echo HEIG03 BODY11 EDUC03 ADHD04)
prev=$(echo NA NA NA NA)

# pT+clump (sparse)
for i in $(seq 1 4);do
  pheno_i=$(echo ${pheno} | cut -f ${i} -d ' ')
  gwas_i=$(echo ${gwas} | cut -f ${i} -d ' ')
  prev_i=$(echo ${prev} | cut -f ${i} -d ' ')

sbatch --mem 10G -n 2 -p brc,shared /users/k1806347/brc_scratch/Software/Rscript.sh /users/k1806347/brc_scratch/Software/MyGit/GenoPred/Scripts/Model_builder/Model_builder_V2_nested.R \
    --pheno /users/k1806347/brc_scratch/Data/TEDS/Phenotypic/Derived_outcomes/TEDS_${pheno_i}.txt \
      --keep /users/k1806347/brc_scratch/Data/TEDS/Projected_PCs/Ancestry_idenitfier/TEDS.w_hm3.AllAncestry.EUR.keep \
    --out /users/k1806347/brc_scratch/Analyses/GeRS_comparison/TEDS_outcomes_for_prediction/${pheno_i}/Association_withPRSs/TEDS.w_hm3.${gwas_i}.EUR-PRSs \
    --n_core 2 \
    --compare_predictors T \
    --assoc T \
    --outcome_pop_prev ${prev_i} \
    --predictors /users/k1806347/brc_scratch/Analyses/GeRS_comparison/TEDS_outcomes_for_prediction/${pheno_i}/Association_withPRSs/TEDS.w_hm3.${gwas_i}.EUR-PRSs.predictor_groups
done
TWAS gene stratified polygenic score
. /users/k1806347/brc_scratch/Software/MyGit/GenoPred/config_used/Target_scoring.config

# Make required directories
for pheno_i in $(echo Height21 BMI21 GCSE ADHD);do
mkdir -p /users/k1806347/brc_scratch/Analyses/GeRS_comparison/TEDS_outcomes_for_prediction/${pheno_i}/Association_withPRSs
done

# Create a file listing the predictors files
pheno=$(echo Height21 BMI21 GCSE ADHD)
gwas=$(echo HEIG03 BODY11 EDUC03 ADHD04)
weights=$(cat ${TWAS_rep}/snp_weight_list.txt)

for i in $(seq 1 4);do
  pheno_i=$(echo ${pheno} | cut -f ${i} -d ' ')
  gwas_i=$(echo ${gwas} | cut -f ${i} -d ' ')

  echo "predictors group" > /users/k1806347/brc_scratch/Analyses/GeRS_comparison/TEDS_outcomes_for_prediction/${pheno_i}/Association_withPRSs/TEDS.w_hm3.${gwas_i}.EUR-PRSs-TWAS_gene_stratified.predictor_groups

  for weight in ${weights}; do
    echo ${TEDS_output_dir}/FunctionallyInformedPolygenicScores/EUR/${weight}/TEDS.w_hm3.EUR.${weight}.${gwas_i}.fiprofile GeRS >> /users/k1806347/brc_scratch/Analyses/GeRS_comparison/TEDS_outcomes_for_prediction/${pheno_i}/Association_withPRSs/TEDS.w_hm3.${gwas_i}.EUR-PRSs-TWAS_gene_stratified.predictor_groups
  done

    echo ${TEDS_output_dir}/PolygenicScores_stratified_TWAS_Gene/${gwas_i}/TEDS.subset.w_hm3.${gwas_i}.profiles strat_PRS >> /users/k1806347/brc_scratch/Analyses/GeRS_comparison/TEDS_outcomes_for_prediction/${pheno_i}/Association_withPRSs/TEDS.w_hm3.${gwas_i}.EUR-PRSs-TWAS_gene_stratified.predictor_groups
done

# Derive and evaluate models
pheno=$(echo Height21 BMI21 GCSE ADHD)
gwas=$(echo HEIG03 BODY11 EDUC03 ADHD04)
prev=$(echo NA NA NA NA)

# 1KG reference
for i in $(seq 1 4);do
  pheno_i=$(echo ${pheno} | cut -f ${i} -d ' ')
  pheno_file_i=$(echo ${pheno_file} | cut -f ${i} -d ' ')
  gwas_i=$(echo ${gwas} | cut -f ${i} -d ' ')
  prev_i=$(echo ${prev} | cut -f ${i} -d ' ')

sbatch --mem 10G -n 2 -p brc,shared /users/k1806347/brc_scratch/Software/Rscript.sh /users/k1806347/brc_scratch/Software/MyGit/GenoPred/Scripts/Model_builder/Model_builder_V2_nested.R \
    --pheno ${TEDS_output_dir}/Phenotypic/Derived_outcomes/TEDS_${pheno_i}.txt \
      --keep /users/k1806347/brc_scratch/Data/TEDS/Projected_PCs/Ancestry_idenitfier/TEDS.w_hm3.AllAncestry.EUR.keep \
    --out /users/k1806347/brc_scratch/Analyses/GeRS_comparison/TEDS_outcomes_for_prediction/${pheno_i}/Association_withPRSs/TEDS.w_hm3.${gwas_i}.EUR-PRSs-TWAS_gene_stratified \
    --n_core 2 \
    --compare_predictors F \
    --assoc T \
    --outcome_pop_prev ${prev_i} \
    --predictors /users/k1806347/brc_scratch/Analyses/GeRS_comparison/TEDS_outcomes_for_prediction/${pheno_i}/Association_withPRSs/TEDS.w_hm3.${gwas_i}.EUR-PRSs-TWAS_gene_stratified.predictor_groups
done
3.10 Estimate proportion of SNP-based heritability explained by GeRS, PRS and stratified PRS
3.10.1 UK Biobank
Estimate using GeRS
pheno<-c('Depression','Intelligence','BMI','Height','T2D','CAD','IBD','RheuArth')
gwas<-c('DEPR06','COLL01','BODY03','HEIG03','DIAB05','COAD01','CROH01','RHEU01')

prev=c(0.15,NA,NA,NA,0.05,0.03,0.013,0.00164,0.005)

gwas_desc<-read.csv("/users/k1806347/brc_scratch/Data/GWAS_sumstats/UKBB_phenotype_GWAS_descrip.csv")

library(avengeme)

GeRS_res<-list()
nsnp_logs<-list()
for(i in 1:length(gwas)){
  res_i<-read.table(paste0('/users/k1806347/brc_scratch/Analyses/GeRS_comparison/UKBB_outcomes_for_prediction/',pheno[i],'/Association_withGeRSs/UKBB.w_hm3.AllTissue.',gwas[i],'.EUR-GeRSs.per_PT.pred_eval.txt'), header=T, stringsAsFactors=F)

  res_i<-res_i[1:dim(res_i)[1]-1,]
  res_i$Indep_Z<-res_i$R/res_i$SE

  GeRS_res[[gwas[i]]]<-res_i

  nsnp_log<-read.table(paste0('/users/k1806347/brc_scratch/Data/1KG/Phase3/Score_files_for_poylygenic_stratified_TWAS_Gene/',gwas[i],'/1KGPhase3.w_hm3.',gwas[i],'.NSNP_per_pT'), header=T)

  nsnp_logs[[gwas[i]]]<-nsnp_log
}

mod_res_all<-NULL
for(i in 1:length(gwas)){
  if(is.na(prev[i])){
    targ_N<-GeRS_res[[gwas[i]]]$N[1]

    mod_res<-estimatePolygenicModel(p=GeRS_res[[gwas[i]]]$Indep_Z,
                           nsnp=nsnp_logs[[gwas[i]]]$NSNP[length(nsnp_logs[[gwas[i]]]$NSNP)],
                           n=c(gwas_desc$N[gwas_desc$Code == gwas[i]], targ_N),
                           pupper = c(0,1e-06,1e-05,1e-04,0.001,0.01,0.05,0.1,0.5,1),
                           binary = c(FALSE, FALSE),
                           prevalence = c(NA, NA),
                           sampling = c(NA, NA),
                           fixvg2pi02 = T,
                           alpha = 0.05)

    mod_res_all<-rbind(mod_res_all,data.frame(Phenotype=pheno[i],
                                              GWAS=gwas[i],
                                                                          nsnp=nsnp_logs[[gwas[i]]]$NSNP[length(nsnp_logs[[gwas[i]]]$NSNP)],
                                              vg_est=mod_res$vg[1],
                                              vg_lowCI=mod_res$vg[2],
                                              vg_highCI=mod_res$vg[3],
                                              pi0_est=mod_res$pi0[1],
                                              pi0_lowCI=mod_res$pi0[2],
                                              pi0_highCI=mod_res$pi0[3]))

  } else {
    targ_N<-GeRS_res[[gwas[i]]]$N[1]
    targ_N_Ca<-GeRS_res[[gwas[i]]]$Ncase[1]
    targ_N_Co<-GeRS_res[[gwas[i]]]$Ncont[1]

    mod_res<-estimatePolygenicModel(p=GeRS_res[[gwas[i]]]$Indep_Z,
                           nsnp=nsnp_logs[[gwas[i]]]$NSNP[length(nsnp_logs[[gwas[i]]]$NSNP)],
                           n=c(gwas_desc$N[gwas_desc$Code == gwas[i]], targ_N),
                           pupper = c(0,1e-06,1e-05,1e-04,0.001,0.01,0.05,0.1,0.5,1),
                           binary = c(T, T),
                           prevalence = prev[i],
                           sampling = c(gwas_desc$Ncase[gwas_desc$Code == gwas[i]]/(gwas_desc$Ncase[gwas_desc$Code == gwas[i]]+gwas_desc$Ncontrol[gwas_desc$Code == gwas[i]]), targ_N_Ca/(targ_N_Ca+targ_N_Co)),
                           fixvg2pi02 = T,
                           alpha = 0.05)

    mod_res_all<-rbind(mod_res_all,data.frame(Phenotype=pheno[i],
                                              GWAS=gwas[i],
                                                                          nsnp=nsnp_logs[[gwas[i]]]$NSNP[length(nsnp_logs[[gwas[i]]]$NSNP)],
                                              vg_est=mod_res$vg[1],
                                              vg_lowCI=mod_res$vg[2],
                                              vg_highCI=mod_res$vg[3],
                                              pi0_est=mod_res$pi0[1],
                                              pi0_lowCI=mod_res$pi0[2],
                                              pi0_highCI=mod_res$pi0[3]))

  }
}

write.csv(mod_res_all, '/users/k1806347/brc_scratch/Analyses/GeRS_comparison/UKBB_outcomes_for_prediction/GeRS_AVENGME_res.csv', row.names=F)
Estimate using GeRS (colocalised)
pheno<-c('Depression','Intelligence','BMI','Height','T2D','CAD','IBD','RheuArth')
gwas<-c('DEPR06','COLL01','BODY03','HEIG03','DIAB05','COAD01','CROH01','RHEU01')

prev=c(0.15,NA,NA,NA,0.05,0.03,0.013,0.00164,0.005)

gwas_desc<-read.csv("/users/k1806347/brc_scratch/Data/GWAS_sumstats/UKBB_phenotype_GWAS_descrip.csv")

library(avengeme)

GeRS_res<-list()
nsnp_logs<-list()
for(i in 1:length(gwas)){
  res_i<-read.table(paste0('/users/k1806347/brc_scratch/Analyses/GeRS_comparison/UKBB_outcomes_for_prediction/',pheno[i],'/Association_withGeRSs/UKBB.w_hm3.AllTissue.',gwas[i],'.EUR-GeRSs_pT_withColoc.per_PT.pred_eval.txt'), header=T, stringsAsFactors=F)

  res_i<-res_i[1:dim(res_i)[1]-1,]
  res_i$Indep_Z<-res_i$R/res_i$SE

  GeRS_res[[gwas[i]]]<-res_i

  nsnp_log<-read.table(paste0('/users/k1806347/brc_scratch/Data/1KG/Phase3/Score_files_for_poylygenic_stratified_TWAS_Gene/',gwas[i],'/1KGPhase3.w_hm3.',gwas[i],'.NSNP_per_pT'), header=T)

  nsnp_logs[[gwas[i]]]<-nsnp_log
}

mod_res_all<-NULL
for(i in 1:length(gwas)){
  if(is.na(prev[i])){
    targ_N<-GeRS_res[[gwas[i]]]$N[1]

    mod_res<-estimatePolygenicModel(p=GeRS_res[[gwas[i]]]$Indep_Z,
                           nsnp=nsnp_logs[[gwas[i]]]$NSNP[length(nsnp_logs[[gwas[i]]]$NSNP)],
                           n=c(gwas_desc$N[gwas_desc$Code == gwas[i]], targ_N),
                           pupper = c(0,1e-06,1e-05,1e-04,0.001,0.01,0.05,0.1,0.5,1),
                           binary = c(FALSE, FALSE),
                           prevalence = c(NA, NA),
                           sampling = c(NA, NA),
                           fixvg2pi02 = T,
                           alpha = 0.05)

    mod_res_all<-rbind(mod_res_all,data.frame(Phenotype=pheno[i],
                                              GWAS=gwas[i],
                                                                          nsnp=nsnp_logs[[gwas[i]]]$NSNP[length(nsnp_logs[[gwas[i]]]$NSNP)],
                                              vg_est=mod_res$vg[1],
                                              vg_lowCI=mod_res$vg[2],
                                              vg_highCI=mod_res$vg[3],
                                              pi0_est=mod_res$pi0[1],
                                              pi0_lowCI=mod_res$pi0[2],
                                              pi0_highCI=mod_res$pi0[3]))

  } else {
    targ_N<-GeRS_res[[gwas[i]]]$N[1]
    targ_N_Ca<-GeRS_res[[gwas[i]]]$Ncase[1]
    targ_N_Co<-GeRS_res[[gwas[i]]]$Ncont[1]

    mod_res<-estimatePolygenicModel(p=GeRS_res[[gwas[i]]]$Indep_Z,
                           nsnp=nsnp_logs[[gwas[i]]]$NSNP[length(nsnp_logs[[gwas[i]]]$NSNP)],
                           n=c(gwas_desc$N[gwas_desc$Code == gwas[i]], targ_N),
                           pupper = c(0,1e-06,1e-05,1e-04,0.001,0.01,0.05,0.1,0.5,1),
                           binary = c(T, T),
                           prevalence = prev[i],
                           sampling = c(gwas_desc$Ncase[gwas_desc$Code == gwas[i]]/(gwas_desc$Ncase[gwas_desc$Code == gwas[i]]+gwas_desc$Ncontrol[gwas_desc$Code == gwas[i]]), targ_N_Ca/(targ_N_Ca+targ_N_Co)),
                           fixvg2pi02 = T,
                           alpha = 0.05)

    mod_res_all<-rbind(mod_res_all,data.frame(Phenotype=pheno[i],
                                              GWAS=gwas[i],
                                                                          nsnp=nsnp_logs[[gwas[i]]]$NSNP[length(nsnp_logs[[gwas[i]]]$NSNP)],
                                              vg_est=mod_res$vg[1],
                                              vg_lowCI=mod_res$vg[2],
                                              vg_highCI=mod_res$vg[3],
                                              pi0_est=mod_res$pi0[1],
                                              pi0_lowCI=mod_res$pi0[2],
                                              pi0_highCI=mod_res$pi0[3]))

  }
}

write.csv(mod_res_all, '/users/k1806347/brc_scratch/Analyses/GeRS_comparison/UKBB_outcomes_for_prediction/GeRS_coloc_AVENGME_res.csv', row.names=F)
Estimate using PRS
pheno<-c('Depression','Intelligence','BMI','Height','T2D','CAD','IBD','RheuArth')
gwas<-c('DEPR06','COLL01','BODY03','HEIG03','DIAB05','COAD01','CROH01','RHEU01')

prev=c(0.15,NA,NA,NA,0.05,0.03,0.013,0.00164,0.005)

gwas_desc<-read.csv("/users/k1806347/brc_scratch/Data/GWAS_sumstats/UKBB_phenotype_GWAS_descrip.csv")

library(avengeme)

PRS_res<-list()
nsnp_logs<-list()
for(i in 1:length(gwas)){
  res_i<-read.table(paste0('/users/k1806347/brc_scratch/Analyses/GeRS_comparison/UKBB_outcomes_for_prediction/',pheno[i],'/Association_withPRSs/UKBB.w_hm3.',gwas[i],'.EUR-PRSs.pred_eval.txt'), header=T, stringsAsFactors=F)

  res_i<-res_i[1:dim(res_i)[1]-1,]
  res_i$Indep_Z<-res_i$R/res_i$SE

  PRS_res[[gwas[i]]]<-res_i

  nsnp_log<-read.table(paste0('/users/k1806347/brc_scratch/Data/1KG/Phase3/Score_files_for_polygenic/pt_clump/',gwas[i],'/1KGPhase3.w_hm3.',gwas[i],'.NSNP_per_pT'), header=T)

  nsnp_logs[[gwas[i]]]<-nsnp_log
}

mod_res_all<-NULL
for(i in 1:length(gwas)){
  if(is.na(prev[i])){
    targ_N<-PRS_res[[gwas[i]]]$N[1]

    mod_res<-estimatePolygenicModel(p=PRS_res[[gwas[i]]]$Indep_Z,
                           nsnp=nsnp_logs[[gwas[i]]]$NSNP[length(nsnp_logs[[gwas[i]]]$NSNP)],
                           n=c(gwas_desc$N[gwas_desc$Code == gwas[i]], targ_N),
                           pupper = c(0,1e-8,1e-06,1e-04,1e-02,0.1,0.2,0.3,0.4,0.5,1),
                           binary = c(FALSE, FALSE),
                           prevalence = c(NA, NA),
                           sampling = c(NA, NA),
                           fixvg2pi02 = T,
                           alpha = 0.05)

    mod_res_all<-rbind(mod_res_all,data.frame(Phenotype=pheno[i],
                                              GWAS=gwas[i],
                                                                          nsnp=nsnp_logs[[gwas[i]]]$NSNP[length(nsnp_logs[[gwas[i]]]$NSNP)],
                                              vg_est=mod_res$vg[1],
                                              vg_lowCI=mod_res$vg[2],
                                              vg_highCI=mod_res$vg[3],
                                              pi0_est=mod_res$pi0[1],
                                              pi0_lowCI=mod_res$pi0[2],
                                              pi0_highCI=mod_res$pi0[3]))

  } else {
    targ_N<-PRS_res[[gwas[i]]]$N[1]
    targ_N_Ca<-PRS_res[[gwas[i]]]$Ncase[1]
    targ_N_Co<-PRS_res[[gwas[i]]]$Ncont[1]

    mod_res<-estimatePolygenicModel(p=PRS_res[[gwas[i]]]$Indep_Z,
                           nsnp=nsnp_logs[[gwas[i]]]$NSNP[length(nsnp_logs[[gwas[i]]]$NSNP)],
                           n=c(gwas_desc$N[gwas_desc$Code == gwas[i]], targ_N),
                           pupper = c(0,1e-8,1e-06,1e-04,1e-02,0.1,0.2,0.3,0.4,0.5,1),
                           binary = c(T, T),
                           prevalence = prev[i],
                           sampling = c(gwas_desc$Ncase[gwas_desc$Code == gwas[i]]/(gwas_desc$Ncase[gwas_desc$Code == gwas[i]]+gwas_desc$Ncontrol[gwas_desc$Code == gwas[i]]), targ_N_Ca/(targ_N_Ca+targ_N_Co)),
                           fixvg2pi02 = T,
                           alpha = 0.05)

    mod_res_all<-rbind(mod_res_all,data.frame(Phenotype=pheno[i],
                                              GWAS=gwas[i],
                                                                          nsnp=nsnp_logs[[gwas[i]]]$NSNP[length(nsnp_logs[[gwas[i]]]$NSNP)],
                                              vg_est=mod_res$vg[1],
                                              vg_lowCI=mod_res$vg[2],
                                              vg_highCI=mod_res$vg[3],
                                              pi0_est=mod_res$pi0[1],
                                              pi0_lowCI=mod_res$pi0[2],
                                              pi0_highCI=mod_res$pi0[3]))

  }
}

write.csv(mod_res_all, '/users/k1806347/brc_scratch/Analyses/GeRS_comparison/UKBB_outcomes_for_prediction/PRS_AVENGME_res.csv', row.names=F)
3.10.2 TEDS
Estimate using GeRS
pheno<-c('Height21','BMI21','GCSE','ADHD')

gwas<-c('HEIG03','BODY11','EDUC03','ADHD04')

prev=c(NA,NA,NA,NA)

gwas_desc<-read.csv("/users/k1806347/brc_scratch/Data/GWAS_sumstats/TEDS_phenotype_GWAS_descrip.csv")

library(avengeme)

GeRS_res<-list()
nsnp_logs<-list()
for(i in 1:length(gwas)){
  res_i<-read.table(paste0('/users/k1806347/brc_scratch/Analyses/GeRS_comparison/TEDS_outcomes_for_prediction/',pheno[i],'/Association_withGeRSs/TEDS.w_hm3.AllTissue.',gwas[i],'.EUR-GeRSs.per_PT.pred_eval.txt'), header=T, stringsAsFactors=F)

  res_i<-res_i[1:dim(res_i)[1]-1,]
  res_i$Indep_Z<-res_i$R/res_i$SE

  GeRS_res[[gwas[i]]]<-res_i

  nsnp_log<-read.table(paste0('/users/k1806347/brc_scratch/Data/1KG/Phase3/Score_files_for_poylygenic_stratified_TWAS_Gene/',gwas[i],'/1KGPhase3.w_hm3.',gwas[i],'.NSNP_per_pT'), header=T)

  nsnp_logs[[gwas[i]]]<-nsnp_log
}

mod_res_all<-NULL
for(i in 1:length(gwas)){
  if(is.na(prev[i])){
    targ_N<-GeRS_res[[gwas[i]]]$N[1]

    mod_res<-estimatePolygenicModel(p=GeRS_res[[gwas[i]]]$Indep_Z,
                           nsnp=nsnp_logs[[gwas[i]]]$NSNP[length(nsnp_logs[[gwas[i]]]$NSNP)],
                           n=c(gwas_desc$N[gwas_desc$Code == gwas[i]], targ_N),
                           pupper = c(0,1e-06,1e-05,1e-04,0.001,0.01,0.05,0.1,0.5,1),
                           binary = c(FALSE, FALSE),
                           prevalence = c(NA, NA),
                           sampling = c(NA, NA),
                           fixvg2pi02 = T,
                           alpha = 0.05)

    mod_res_all<-rbind(mod_res_all,data.frame(Phenotype=pheno[i],
                                              GWAS=gwas[i],
                                                                          nsnp=nsnp_logs[[gwas[i]]]$NSNP[length(nsnp_logs[[gwas[i]]]$NSNP)],
                                              vg_est=mod_res$vg[1],
                                              vg_lowCI=mod_res$vg[2],
                                              vg_highCI=mod_res$vg[3],
                                              pi0_est=mod_res$pi0[1],
                                              pi0_lowCI=mod_res$pi0[2],
                                              pi0_highCI=mod_res$pi0[3]))

  } else {
    targ_N<-GeRS_res[[gwas[i]]]$N[1]
    targ_N_Ca<-GeRS_res[[gwas[i]]]$Ncase[1]
    targ_N_Co<-GeRS_res[[gwas[i]]]$Ncont[1]

    mod_res<-estimatePolygenicModel(p=GeRS_res[[gwas[i]]]$Indep_Z,
                           nsnp=nsnp_logs[[gwas[i]]]$NSNP[length(nsnp_logs[[gwas[i]]]$NSNP)],
                           n=c(gwas_desc$N[gwas_desc$Code == gwas[i]], targ_N),
                           pupper = c(0,1e-06,1e-05,1e-04,0.001,0.01,0.05,0.1,0.5,1),
                           binary = c(T, T),
                           prevalence = prev[i],
                           sampling = c(gwas_desc$Ncase[gwas_desc$Code == gwas[i]]/(gwas_desc$Ncase[gwas_desc$Code == gwas[i]]+gwas_desc$Ncontrol[gwas_desc$Code == gwas[i]]), targ_N_Ca/(targ_N_Ca+targ_N_Co)),
                           fixvg2pi02 = T,
                           alpha = 0.05)

    mod_res_all<-rbind(mod_res_all,data.frame(Phenotype=pheno[i],
                                              GWAS=gwas[i],
                                                                          nsnp=nsnp_logs[[gwas[i]]]$NSNP[length(nsnp_logs[[gwas[i]]]$NSNP)],
                                              vg_est=mod_res$vg[1],
                                              vg_lowCI=mod_res$vg[2],
                                              vg_highCI=mod_res$vg[3],
                                              pi0_est=mod_res$pi0[1],
                                              pi0_lowCI=mod_res$pi0[2],
                                              pi0_highCI=mod_res$pi0[3]))

  }
}

write.csv(mod_res_all, '/users/k1806347/brc_scratch/Analyses/GeRS_comparison/TEDS_outcomes_for_prediction/GeRS_AVENGME_res.csv', row.names=F)
Estimate using GeRS (colocalised)
pheno<-c('Height21','BMI21','GCSE','ADHD')

gwas<-c('HEIG03','BODY11','EDUC03','ADHD04')

prev=c(NA,NA,NA,NA)

gwas_desc<-read.csv("/users/k1806347/brc_scratch/Data/GWAS_sumstats/TEDS_phenotype_GWAS_descrip.csv")

library(avengeme)

GeRS_res<-list()
nsnp_logs<-list()
for(i in 1:length(gwas)){
  res_i<-read.table(paste0('/users/k1806347/brc_scratch/Analyses/GeRS_comparison/TEDS_outcomes_for_prediction/',pheno[i],'/Association_withGeRSs/TEDS.w_hm3.AllTissue.',gwas[i],'.EUR-GeRSs_pT_withColoc.per_PT.pred_eval.txt'), header=T, stringsAsFactors=F)

  res_i<-res_i[1:dim(res_i)[1]-1,]
  res_i$Indep_Z<-res_i$R/res_i$SE

  GeRS_res[[gwas[i]]]<-res_i

  nsnp_log<-read.table(paste0('/users/k1806347/brc_scratch/Data/1KG/Phase3/Score_files_for_poylygenic_stratified_TWAS_Gene/',gwas[i],'/1KGPhase3.w_hm3.',gwas[i],'.NSNP_per_pT'), header=T)

  nsnp_logs[[gwas[i]]]<-nsnp_log
}

mod_res_all<-NULL
for(i in 1:length(gwas)){
  if(is.na(prev[i])){
    targ_N<-GeRS_res[[gwas[i]]]$N[1]

    mod_res<-estimatePolygenicModel(p=GeRS_res[[gwas[i]]]$Indep_Z,
                           nsnp=nsnp_logs[[gwas[i]]]$NSNP[length(nsnp_logs[[gwas[i]]]$NSNP)],
                           n=c(gwas_desc$N[gwas_desc$Code == gwas[i]], targ_N),
                           pupper = c(0,1e-06,1e-05,1e-04,0.001,0.01,0.05,0.1,0.5,1),
                           binary = c(FALSE, FALSE),
                           prevalence = c(NA, NA),
                           sampling = c(NA, NA),
                           fixvg2pi02 = T,
                           alpha = 0.05)

    mod_res_all<-rbind(mod_res_all,data.frame(Phenotype=pheno[i],
                                              GWAS=gwas[i],
                                                                          nsnp=nsnp_logs[[gwas[i]]]$NSNP[length(nsnp_logs[[gwas[i]]]$NSNP)],
                                              vg_est=mod_res$vg[1],
                                              vg_lowCI=mod_res$vg[2],
                                              vg_highCI=mod_res$vg[3],
                                              pi0_est=mod_res$pi0[1],
                                              pi0_lowCI=mod_res$pi0[2],
                                              pi0_highCI=mod_res$pi0[3]))

  } else {
    targ_N<-GeRS_res[[gwas[i]]]$N[1]
    targ_N_Ca<-GeRS_res[[gwas[i]]]$Ncase[1]
    targ_N_Co<-GeRS_res[[gwas[i]]]$Ncont[1]

    mod_res<-estimatePolygenicModel(p=GeRS_res[[gwas[i]]]$Indep_Z,
                           nsnp=nsnp_logs[[gwas[i]]]$NSNP[length(nsnp_logs[[gwas[i]]]$NSNP)],
                           n=c(gwas_desc$N[gwas_desc$Code == gwas[i]], targ_N),
                           pupper = c(0,1e-06,1e-05,1e-04,0.001,0.01,0.05,0.1,0.5,1),
                           binary = c(T, T),
                           prevalence = prev[i],
                           sampling = c(gwas_desc$Ncase[gwas_desc$Code == gwas[i]]/(gwas_desc$Ncase[gwas_desc$Code == gwas[i]]+gwas_desc$Ncontrol[gwas_desc$Code == gwas[i]]), targ_N_Ca/(targ_N_Ca+targ_N_Co)),
                           fixvg2pi02 = T,
                           alpha = 0.05)

    mod_res_all<-rbind(mod_res_all,data.frame(Phenotype=pheno[i],
                                              GWAS=gwas[i],
                                                                          nsnp=nsnp_logs[[gwas[i]]]$NSNP[length(nsnp_logs[[gwas[i]]]$NSNP)],
                                              vg_est=mod_res$vg[1],
                                              vg_lowCI=mod_res$vg[2],
                                              vg_highCI=mod_res$vg[3],
                                              pi0_est=mod_res$pi0[1],
                                              pi0_lowCI=mod_res$pi0[2],
                                              pi0_highCI=mod_res$pi0[3]))

  }
}

write.csv(mod_res_all, '/users/k1806347/brc_scratch/Analyses/GeRS_comparison/TEDS_outcomes_for_prediction/GeRS_coloc_AVENGME_res.csv', row.names=F)
Estimate using PRS
pheno<-c('Height21','BMI21','GCSE','ADHD')

gwas<-c('HEIG03','BODY11','EDUC03','ADHD04')

prev=c(NA,NA,NA,NA)

gwas_desc<-read.csv("/users/k1806347/brc_scratch/Data/GWAS_sumstats/TEDS_phenotype_GWAS_descrip.csv")

library(avengeme)

PRS_res<-list()
nsnp_logs<-list()
for(i in 1:length(gwas)){
  res_i<-read.table(paste0('/users/k1806347/brc_scratch/Analyses/GeRS_comparison/TEDS_outcomes_for_prediction/',pheno[i],'/Association_withPRSs/TEDS.w_hm3.',gwas[i],'.EUR-PRSs.pred_eval.txt'), header=T, stringsAsFactors=F)

  res_i<-res_i[1:dim(res_i)[1]-1,]
  res_i$Indep_Z<-res_i$R/res_i$SE

  PRS_res[[gwas[i]]]<-res_i

  nsnp_log<-read.table(paste0('/users/k1806347/brc_scratch/Data/1KG/Phase3/Score_files_for_poylygenic/',gwas[i],'/1KGPhase3.w_hm3.',gwas[i],'.NSNP_per_pT'), header=T)

  nsnp_logs[[gwas[i]]]<-nsnp_log
}

mod_res_all<-NULL
for(i in 1:length(gwas)){
  if(is.na(prev[i])){
    targ_N<-PRS_res[[gwas[i]]]$N[1]

    mod_res<-estimatePolygenicModel(p=PRS_res[[gwas[i]]]$Indep_Z,
                           nsnp=nsnp_logs[[gwas[i]]]$NSNP[length(nsnp_logs[[gwas[i]]]$NSNP)],
                           n=c(gwas_desc$N[gwas_desc$Code == gwas[i]], targ_N),
                           pupper = c(0,1e-8,1e-06,1e-04,1e-02,0.1,0.2,0.3,0.4,0.5,1),
                           binary = c(FALSE, FALSE),
                           prevalence = c(NA, NA),
                           sampling = c(NA, NA),
                           fixvg2pi02 = T,
                           alpha = 0.05)

    mod_res_all<-rbind(mod_res_all,data.frame(Phenotype=pheno[i],
                                              GWAS=gwas[i],
                                                                          nsnp=nsnp_logs[[gwas[i]]]$NSNP[length(nsnp_logs[[gwas[i]]]$NSNP)],
                                              vg_est=mod_res$vg[1],
                                              vg_lowCI=mod_res$vg[2],
                                              vg_highCI=mod_res$vg[3],
                                              pi0_est=mod_res$pi0[1],
                                              pi0_lowCI=mod_res$pi0[2],
                                              pi0_highCI=mod_res$pi0[3]))

  } else {
    targ_N<-PRS_res[[gwas[i]]]$N[1]
    targ_N_Ca<-PRS_res[[gwas[i]]]$Ncase[1]
    targ_N_Co<-PRS_res[[gwas[i]]]$Ncont[1]

    mod_res<-estimatePolygenicModel(p=PRS_res[[gwas[i]]]$Indep_Z,
                           nsnp=nsnp_logs[[gwas[i]]]$NSNP[length(nsnp_logs[[gwas[i]]]$NSNP)],
                           n=c(gwas_desc$N[gwas_desc$Code == gwas[i]], targ_N),
                           pupper = c(0,1e-8,1e-06,1e-04,1e-02,0.1,0.2,0.3,0.4,0.5,1),
                           binary = c(T, T),
                           prevalence = prev[i],
                           sampling = c(gwas_desc$Ncase[gwas_desc$Code == gwas[i]]/(gwas_desc$Ncase[gwas_desc$Code == gwas[i]]+gwas_desc$Ncontrol[gwas_desc$Code == gwas[i]]), targ_N_Ca/(targ_N_Ca+targ_N_Co)),
                           fixvg2pi02 = T,
                           alpha = 0.05)

    mod_res_all<-rbind(mod_res_all,data.frame(Phenotype=pheno[i],
                                              GWAS=gwas[i],
                                                                          nsnp=nsnp_logs[[gwas[i]]]$NSNP[length(nsnp_logs[[gwas[i]]]$NSNP)],
                                              vg_est=mod_res$vg[1],
                                              vg_lowCI=mod_res$vg[2],
                                              vg_highCI=mod_res$vg[3],
                                              pi0_est=mod_res$pi0[1],
                                              pi0_lowCI=mod_res$pi0[2],
                                              pi0_highCI=mod_res$pi0[3]))

  }
}

write.csv(mod_res_all, '/users/k1806347/brc_scratch/Analyses/GeRS_comparison/TEDS_outcomes_for_prediction/PRS_AVENGME_res.csv', row.names=F)
4 Results
4.1 UK Biobank
Plot per pT GeRS results
#####
# Compare results across pTs for each phenotype
#####
pheno<-c('Depression','Intelligence','BMI','Height','T2D','CAD','IBD','RheuArth')
gwas<-c('DEPR06','COLL01','BODY03','HEIG03','DIAB05','COAD01','CROH01','RHEU01')
weights=read.table('/users/k1806347/brc_scratch/Data/TWAS_sumstats/FUSION/snp_weight_list.txt', header=F)$V1

weights_clean<-gsub('_',' ',weights)
weights_clean<-gsub('CMC.BRAIN.RNASEQ','CMC DLPFC',weights_clean)
weights_clean<-gsub('SPLICING','Splicing',weights_clean)
weights_clean<-gsub('NTR.BLOOD.RNAARR','NTR Blood',weights_clean)
weights_clean<-gsub('YFS.BLOOD.RNAARR','YFS Blood',weights_clean)
weights_clean<-gsub('METSIM.ADIPOSE.RNASEQ','METSIM Adipose',weights_clean)
weights_clean[!grepl('CMC|NTR|YFS|METSIM', weights)]<-paste0('GTEx ',weights_clean[!grepl('CMC|NTR|YFS|METSIM', weights)])
#to add gtex to each of the snp weights which don't have CMC NTR or YFS in front
weights_clean<-gsub('Brain', '', weights_clean)
weights_clean <- gsub('Anterior cingulate cortex', 'ACC', weights_clean)
weights_clean <- gsub('basal ganglia', '', weights_clean)
weights_clean <- gsub('BA9', '', weights_clean)
weights_clean <- gsub('BA24', '', weights_clean)
weights_clean <- gsub('  ', ' ', weights_clean)
weights_clean_short<-substr(weights_clean, start = 1, stop = 15)  #start the name at the first character and stop at the 25th
weights_clean_short[nchar(weights_clean) > 15]<-paste0(weights_clean_short[nchar(weights_clean) > 15], "...")

res<-NULL
res_best<-NULL
for(i in 1:length(gwas)){
  for(weight in 1:length(weights)){
    res_i<-read.table(paste0('/users/k1806347/brc_scratch/Analyses/GeRS_comparison/UKBB_outcomes_for_prediction/',pheno[i],'/Association_withGeRSs/UKBB.w_hm3.',weights[weight],'.',gwas[i],'.EUR-GeRSs.pred_eval.txt'), header=T, stringsAsFactors=F)

    res_i$Phenotype<-pheno[i]
    res_i$Weight<-weights[weight]

    if(sum(grepl('R2l',names(res_i)))>0){
        res_i<-res_i[,c('Phenotype','Weight','Model','R','SE','P','R2l')]
        names(res_i)<-c('Phenotype','Weight','Model','R','SE','P','R2')
        res_i$Binary<-T
    } else {
        res_i<-res_i[,c('Phenotype','Weight','Model','R','SE','P','R2o')]
        names(res_i)<-c('Phenotype','Weight','Model','R','SE','P','R2')
        res_i$Binary<-F
    }

    res_i$Model<-gsub('_group','',gsub(paste0(gwas[i],'.'),'',res_i$Model))
    res_i$Model<-factor(res_i$Model, levels=res_i$Model)

    res_i_best<-res_i[res_i$R == max(res_i$R),]

    res<-rbind(res, res_i)
    res_best<-rbind(res_best, res_i_best)
  }
}

res_brief<-res[,c('Phenotype','Weight','Model','R','SE','P')]
res_best_brief<-res_best[,c('Phenotype','Weight','Model','R','SE','P')]

write.csv(res_brief, '/mnt/lustre/users/k1806347/Analyses/GeRS_comparison/UKBB_outcomes_for_prediction/GeRS_per_pT.csv', row.names=F, quote=F)
write.csv(res_best_brief, '/mnt/lustre/users/k1806347/Analyses/GeRS_comparison/UKBB_outcomes_for_prediction/GeRS_best_pT.csv', row.names=F, quote=F)

library(ggplot2)
library(cowplot)

res$Model<-gsub('e.0','*x*10^-', res$Model)
res$Model<-factor(res$Model, levels=unique(res$Model))
res$P[res$P < 1e-300]<-0
res$P<-format(res$P, scientific = TRUE, digits = 1)
res$P<-gsub('e-','*x*10^-',res$P)
res$P[res$P == ' 0e+00']<-paste0("'<1'*x*10^-300")

res_plot<-list()
for(i in 1:length(gwas)){
  # Extract result for 5 most predictive tissue
  tmp<-res_best[res_best$Phenotype == pheno[i],]
  tmp<-tmp[order(-tmp$R2),]
  tmp<-tmp[1:3,]
  best_weights<-tmp$Weight

  res_tmp<-res[res$Phenotype == pheno[i] & (res$Weight %in% best_weights),]
  ylim_max<-max(res_tmp$R2)
  ylim_max<-ylim_max+ylim_max*1.5
  if(res[res$Phenotype == pheno[i],]$Binary[1] == T){
    ylab<-'Liability R-squared'
  } else {
    ylab<-'R-squared'
  }

  res_plot_tmp<-list()
  for(weight in best_weights){
    weights_index<-which(weights == weight)
    print(weight)
  res_plot_tmp[[as.character(weights[weights_index])]]<-ggplot(res[res$Phenotype == pheno[i] & res$Weight == weights[weights_index],], aes(x=Model, y=R2)) +
                                    geom_bar(stat="identity", position=position_dodge(), fill='#3399FF') +
                                    labs(y=ylab, x='pT', title=paste0('\n\n',weights_clean_short[weights_index])) +
                                    theme_half_open() +
                                    ylim(0,ylim_max) +
                                    geom_text(data=res[res$Phenotype == pheno[i] & res$Weight == weights[weights_index],], aes(x=Model, y=R2, label=P), vjust=0.5, hjust= -0.15, angle=90, size=4, parse=T) +
                                    theme(axis.text.x = element_text(angle = 55, vjust = 1, hjust=1), plot.title = element_text(hjust = 0.5, size=12)) +
                                    background_grid(major = 'y', minor = 'y') +
                                    scale_x_discrete(labels = parse(text = as.character(res[res$Phenotype == pheno[i] & res$Weight == weights[weights_index],]$Model))) +
                                    coord_cartesian(clip='off')

  }
  res_plot[[pheno[i]]]<-plot_grid(plotlist=res_plot_tmp, nrow = 1)
}

png('/mnt/lustre/users/k1806347/Analyses/GeRS_comparison/UKBB_outcomes_for_prediction/GeRS_per_pT_UKBB.png', units='px', res=300, width=3000, height=7000)
  plot_grid(plotlist=res_plot, ncol = 1, labels = paste0(pheno))
dev.off()

#######
# Recreate plots using R on the y axis and full SNP-weight set names
#######

res_plot<-list()
for(i in 1:length(gwas)){
  # Extract result for 5 most predictive tissue
  tmp<-res_best[res_best$Phenotype == pheno[i],]
  tmp<-tmp[order(-tmp$R),]
  tmp<-tmp[1:3,]
  best_weights<-tmp$Weight

  res_tmp<-res[res$Phenotype == pheno[i] & (res$Weight %in% best_weights),]
  ylim_max<-max(res_tmp$R)
  ylim_max<-ylim_max+ylim_max*1.5
  if(min(res_tmp$R) < 0){
    ylim_min<-min(res_tmp$R)
    ylim_min<-ylim_min-max(res_tmp$SE)
  } else {
    ylim_min<-NA
  }

  res_plot_tmp<-list()
  for(weight in best_weights){
    weights_index<-which(weights == weight)
    print(weight)
  res_plot_tmp[[as.character(weights[weights_index])]]<-ggplot(res[res$Phenotype == pheno[i] & res$Weight == weights[weights_index],], aes(x=Model, y=R)) +
                                    geom_bar(stat="identity", position=position_dodge(), fill='#3399FF') +
                                    geom_errorbar(aes(ymin=R-SE, ymax=R+SE), width=.2, position=position_dodge(.9)) +
                                    labs(y='Correlation', x='pT', title=paste0('\n\n',weights_clean[weights_index])) +
                                    theme_half_open() +
                                    ylim(ylim_min,ylim_max) +
                                    geom_text(data=res[res$Phenotype == pheno[i] & res$Weight == weights[weights_index],], aes(x=Model, y=R+SE, label=P), vjust=0.3, hjust= -0.15, angle=90, size=4, parse=T) +
                                    theme(axis.text.x = element_text(angle = 55, vjust = 1, hjust=1), plot.title = element_text(hjust = 0.4, size=12)) +
                                    background_grid(major = 'y', minor = 'y') +
                                    scale_x_discrete(labels = parse(text = as.character(res[res$Phenotype == pheno[i] & res$Weight == weights[weights_index],]$Model))) +
                                    coord_cartesian(clip='off')

  }
  res_plot[[pheno[i]]]<-plot_grid(plotlist=res_plot_tmp, nrow = 1)
}

png('/mnt/lustre/users/k1806347/Analyses/GeRS_comparison/UKBB_outcomes_for_prediction/GeRS_per_pT_UKBB_R.png', units='px', res=300, width=3000, height=7000)
  plot_grid(plotlist=res_plot, ncol = 1, labels = paste0(pheno))
dev.off()
Plot comparison results
#####
# Compare results from each approach
#####
pheno<-c('Depression','Intelligence','BMI','Height','T2D','CAD','IBD','RheuArth')
gwas<-c('DEPR06','COLL01','BODY03','HEIG03','DIAB05','COAD01','CROH01','RHEU01')

res<-list()
for(i in 1:length(gwas)){
res_1<-read.table(paste0('/users/k1806347/brc_scratch/Analyses/GeRS_comparison/UKBB_outcomes_for_prediction/',pheno[i],'/Association_withGeRSs/UKBB.w_hm3.AllTissue.',gwas[i],'.EUR-GeRSs.per_PT.pred_comp.txt'), header=T, stringsAsFactors=F)
res_1<-res_1[res_1$Model_1 == 'All',]
res_1<-res_1[res_1$Model_2 != 'All',]
res_2<-read.table(paste0('/users/k1806347/brc_scratch/Analyses/GeRS_comparison/UKBB_outcomes_for_prediction/',pheno[i],'/Association_withGeRSs/UKBB.w_hm3.AllTissue.',gwas[i],'.EUR-GeRSs.pred_comp.txt'), header=T, stringsAsFactors=F)
res_2<-res_2[res_2$Model_1 == 'All',]
res_2<-res_2[res_2$Model_2 != 'All',]
res_3<-read.table(paste0('/users/k1806347/brc_scratch/Analyses/GeRS_comparison/UKBB_outcomes_for_prediction/',pheno[i],'/Association_withPRS_and_GeRSs/UKBB.w_hm3.AllTissue.',gwas[i],'.EUR-GeRSs.EUR-PRSs.pt_clump.pred_comp.txt'), header=T, stringsAsFactors=F)
res_4<-read.table(paste0('/users/k1806347/brc_scratch/Analyses/GeRS_comparison/UKBB_outcomes_for_prediction/',pheno[i],'/Association_withPRSs/UKBB.w_hm3.',gwas[i],'.EUR-PRSs-TWAS_gene_stratified.pred_comp.txt'), header=T, stringsAsFactors=F)
res_5<-read.table(paste0('/users/k1806347/brc_scratch/Analyses/GeRS_comparison/UKBB_outcomes_for_prediction/',pheno[i],'/Association_withPRS_and_GeRSs/UKBB.w_hm3.AllTissue.',gwas[i],'.EUR-GeRSs.EUR-PRSs.PRScs.pred_comp.txt'), header=T, stringsAsFactors=F)

res[[pheno[i]]]<-data.frame(Test=c('GeRS_multi_pT','GeRS_multi_tissue','PRS_and_GeRS','Strat_PRS','PRScs_and_GeRS'),
                        do.call(rbind,list( res_1[res_1$Model_2_R == max(res_1$Model_2_R),],
                                                    res_2[res_2$Model_2_R == max(res_2$Model_2_R),],
                                                    res_3[8,],
                                                    res_4[8,],
                                                    res_5[8,])))
}

res_table<-do.call(rbind, res)

# Calculate percentage difference
res_table$R_diff_perc<-res_table$R_diff/res_table$Model_1_R*100

res_table$Phenotype<-gsub('\\..*','',rownames(res_table))
res_table<-res_table[,c('Phenotype',names(res_table)[-length(names(res_table))])]
write.csv(res_table, '/mnt/lustre/users/k1806347/Analyses/GeRS_comparison/UKBB_outcomes_for_prediction/GeRS_tests_summary.csv', row.names=F, quote=F)

####
# Plot the R2 when using PRS only, and using PRS + multi-tissue GeRS
####

# Organise the results
res_plot<-list()
for(i in 1:length(gwas)){
  tmp_res<-res[[pheno[i]]]

  tmp_res$R_diff_pval_num<-tmp_res$R_diff_pval

  tmp_res$R_diff_pval<-format(tmp_res$R_diff_pval, scientific = TRUE, digits = 2)
  tmp_res$R_diff_pval<-gsub('e-','*x*10^-',tmp_res$R_diff_pval)

  tmp_res_Model_1<-tmp_res[,grepl('Test|Model_1|R_diff',names(tmp_res))]
  names(tmp_res_Model_1)<-c('Test','Model','R','R_diff','R_diff_pval','R_diff_pval_num')
  tmp_res_Model_2<-tmp_res[,grepl('Test|Model_2|R_diff',names(tmp_res))]
  names(tmp_res_Model_2)<-c('Test','Model','R','R_diff','R_diff_pval','R_diff_pval_num')
  tmp_res_Model_2$R_diff<-NA
  tmp_res_Model_2$R_diff_pval<-NA

  tmp_res_plot<-rbind(tmp_res_Model_1,tmp_res_Model_2)
  tmp_res_plot$Phenotype<-pheno[i]

  res_plot[[pheno[i]]]<-tmp_res_plot
}

# Combine results for each phenotype and prepare for plotting
All_res_plot<-do.call(rbind, res_plot)

All_res_plot$Test<-factor(All_res_plot$Test, levels=res[[1]]$Test)
All_res_plot$Phenotype<-factor(All_res_plot$Phenotype, level=unique(All_res_plot$Phenotype))
All_res_plot<-All_res_plot[order(All_res_plot$Phenotype,All_res_plot$Test),]

All_res_plot$Val_Label_1<-NA
All_res_plot$Val_Label_1[!is.na(All_res_plot$R_diff)]<-paste0('Diff == ',round(All_res_plot$R_diff[!is.na(All_res_plot$R_diff)],3))

All_res_plot$Val_Label_2<-NA
All_res_plot$Val_Label_2[!is.na(All_res_plot$R_diff)]<-paste0('italic(p) == ',All_res_plot$R_diff_pval[!is.na(All_res_plot$R_diff)])

All_res_plot$Model[!All_res_plot$Model == 'All' & All_res_plot$Test == 'GeRS_multi_pT']<-'GeRS Best pT   '
All_res_plot$Model[All_res_plot$Model == 'All' & All_res_plot$Test == 'GeRS_multi_pT']<-'GeRS Multi pT'

All_res_plot$Model[!All_res_plot$Model == 'All' & All_res_plot$Test == 'GeRS_multi_tissue']<-'GeRS Best Tissue   '
All_res_plot$Model[All_res_plot$Model == 'All' & All_res_plot$Test == 'GeRS_multi_tissue']<-'GeRS Multi Tissue'

All_res_plot$Model[!All_res_plot$Model == 'All' & All_res_plot$Test == 'PRS_and_GeRS']<-'PRS only   '
All_res_plot$Model[All_res_plot$Model == 'All' & All_res_plot$Test == 'PRS_and_GeRS']<-'PRS + GeRS'

All_res_plot$Model[!All_res_plot$Model == 'All' & All_res_plot$Test == 'Strat_PRS']<-'Strat_PRS only'
All_res_plot$Model[All_res_plot$Model == 'All' & All_res_plot$Test == 'Strat_PRS']<-'Strat_PRS + GeRS'

All_res_plot$Model[!All_res_plot$Model == 'All' & All_res_plot$Test == 'PRScs_and_GeRS']<-'PRScs only   '
All_res_plot$Model[All_res_plot$Model == 'All' & All_res_plot$Test == 'PRScs_and_GeRS']<-'PRScs + GeRS'

All_res_plot$Model<-factor(All_res_plot$Model, levels=c("GeRS Best pT   ","GeRS Multi pT", "GeRS Best Tissue   ","GeRS Multi Tissue","PRS only   ","PRS + GeRS", "Strat_PRS only", "Strat_PRS + GeRS","PRScs only   ","PRScs + GeRS"))

library(ggplot2)
library(cowplot)

# Plot results
Plot_1<-ggplot(All_res_plot[All_res_plot$Test == 'GeRS_multi_pT',], aes(x=Phenotype, y=R, fill=Model)) +
          geom_bar(stat="identity", position=position_dodge()) +
          geom_text(aes(y=R+0.04), label=All_res_plot[All_res_plot$Test == 'GeRS_multi_pT',]$Val_Label_1, parse=T, vjust=-0.5, hjust=0) +
          geom_text(aes(y=R+0.04), label=All_res_plot[All_res_plot$Test == 'GeRS_multi_pT',]$Val_Label_2, parse=T, vjust=1, hjust=0) +
          labs(y='Correlation', x='') +
              ylim(NA,0.6) +
          theme_half_open() +
          theme(legend.title=element_blank(),legend.position="top") +
          background_grid(major = 'x', minor = 'x') +
          coord_flip()

Plot_2<-ggplot(All_res_plot[All_res_plot$Test == 'GeRS_multi_tissue',], aes(x=Phenotype, y=R, fill=Model)) +
          geom_bar(stat="identity", position=position_dodge()) +
          geom_text(aes(y=R+0.04), label=All_res_plot[All_res_plot$Test == 'GeRS_multi_tissue',]$Val_Label_1, parse=T, vjust=-0.5, hjust=0) +
          geom_text(aes(y=R+0.04), label=All_res_plot[All_res_plot$Test == 'GeRS_multi_tissue',]$Val_Label_2, parse=T, vjust=1, hjust=0) +
          labs(y='Correlation', x='') +
          ylim(NA,0.6) +
          theme_half_open() +
          theme(legend.title=element_blank(),legend.position="top") +
          background_grid(major = 'x', minor = 'x') +
          coord_flip()

Plot_3<-ggplot(All_res_plot[All_res_plot$Test == 'PRS_and_GeRS',], aes(x=Phenotype, y=R, fill=Model)) +
          geom_bar(stat="identity", position=position_dodge()) +
          geom_text(aes(y=R+0.04), label=All_res_plot[All_res_plot$Test == 'PRS_and_GeRS',]$Val_Label_1, parse=T, vjust=-0.5, hjust=0) +
          geom_text(aes(y=R+0.04), label=All_res_plot[All_res_plot$Test == 'PRS_and_GeRS',]$Val_Label_2, parse=T, vjust=1, hjust=0) +
          labs(y='Correlation', x='') +
          ylim(NA,0.6) +
          theme_half_open() +
          theme(legend.title=element_blank(),legend.position="top") +
          background_grid(major = 'x', minor = 'x') +
          coord_flip()

Plot_4<-ggplot(All_res_plot[All_res_plot$Test == 'Strat_PRS',], aes(x=Phenotype, y=R, fill=Model)) +
          geom_bar(stat="identity", position=position_dodge()) +
          geom_text(aes(y=R+0.04), label=All_res_plot[All_res_plot$Test == 'Strat_PRS',]$Val_Label_1, parse=T, vjust=-0.5, hjust=0) +
          geom_text(aes(y=R+0.04), label=All_res_plot[All_res_plot$Test == 'Strat_PRS',]$Val_Label_2, parse=T, vjust=1, hjust=0) +
          labs(y='Correlation', x='') +
          ylim(NA,0.6) +
          theme_half_open() +
          theme(legend.title=element_blank(),legend.position="top") +
          background_grid(major = 'x', minor = 'x') +
          coord_flip()

Plot_5<-ggplot(All_res_plot[All_res_plot$Test == 'PRScs_and_GeRS',], aes(x=Phenotype, y=R, fill=Model)) +
          geom_bar(stat="identity", position=position_dodge()) +
          geom_text(aes(y=R+0.04), label=All_res_plot[All_res_plot$Test == 'PRScs_and_GeRS',]$Val_Label_1, parse=T, vjust=-0.5, hjust=0) +
          geom_text(aes(y=R+0.04), label=All_res_plot[All_res_plot$Test == 'PRScs_and_GeRS',]$Val_Label_2, parse=T, vjust=1, hjust=0) +
          labs(y='Correlation', x='') +
          ylim(NA,0.6) +
          theme_half_open() +
          theme(legend.title=element_blank(),legend.position="top") +
          background_grid(major = 'x', minor = 'x') +
          coord_flip()

png('/mnt/lustre/users/k1806347/Analyses/GeRS_comparison/UKBB_outcomes_for_prediction/GeRS_tests_summary_UKBB.png', units='px', res=300, width=3000, height=3500)
  plot_grid(Plot_1,Plot_2,Plot_3, Plot_5, labels = "AUTO")
dev.off()

####
# Recreate in black and white
####


# Plot results
Plot_1<-ggplot(All_res_plot[All_res_plot$Test == 'GeRS_multi_pT',], aes(x=Phenotype, y=R, fill=Model)) +
          geom_bar(stat="identity", position=position_dodge()) +
          scale_fill_grey() +
          geom_text(aes(y=R+0.04), label=All_res_plot[All_res_plot$Test == 'GeRS_multi_pT',]$Val_Label_1, parse=T, vjust=-0.5, hjust=0) +
          geom_text(aes(y=R+0.04), label=All_res_plot[All_res_plot$Test == 'GeRS_multi_pT',]$Val_Label_2, parse=T, vjust=1, hjust=0) +
          labs(y='Correlation', x='') +
              ylim(NA,0.6) +
          theme_half_open() +
          theme(legend.title=element_blank(),legend.position="top") +
          background_grid(major = 'x', minor = 'x') +
          coord_flip()

Plot_2<-ggplot(All_res_plot[All_res_plot$Test == 'GeRS_multi_tissue',], aes(x=Phenotype, y=R, fill=Model)) +
          geom_bar(stat="identity", position=position_dodge()) +
          scale_fill_grey() +
          geom_text(aes(y=R+0.04), label=All_res_plot[All_res_plot$Test == 'GeRS_multi_tissue',]$Val_Label_1, parse=T, vjust=-0.5, hjust=0) +
          geom_text(aes(y=R+0.04), label=All_res_plot[All_res_plot$Test == 'GeRS_multi_tissue',]$Val_Label_2, parse=T, vjust=1, hjust=0) +
          labs(y='Correlation', x='') +
          ylim(NA,0.6) +
          theme_half_open() +
          theme(legend.title=element_blank(),legend.position="top") +
          background_grid(major = 'x', minor = 'x') +
          coord_flip()

Plot_3<-ggplot(All_res_plot[All_res_plot$Test == 'PRS_and_GeRS',], aes(x=Phenotype, y=R, fill=Model)) +
          geom_bar(stat="identity", position=position_dodge()) +
          scale_fill_grey() +
          geom_text(aes(y=R+0.04), label=All_res_plot[All_res_plot$Test == 'PRS_and_GeRS',]$Val_Label_1, parse=T, vjust=-0.5, hjust=0) +
          geom_text(aes(y=R+0.04), label=All_res_plot[All_res_plot$Test == 'PRS_and_GeRS',]$Val_Label_2, parse=T, vjust=1, hjust=0) +
          labs(y='Correlation', x='') +
          ylim(NA,0.6) +
          theme_half_open() +
          theme(legend.title=element_blank(),legend.position="top") +
          background_grid(major = 'x', minor = 'x') +
          coord_flip()

Plot_4<-ggplot(All_res_plot[All_res_plot$Test == 'Strat_PRS',], aes(x=Phenotype, y=R, fill=Model)) +
          geom_bar(stat="identity", position=position_dodge()) +
          scale_fill_grey() +
          geom_text(aes(y=R+0.04), label=All_res_plot[All_res_plot$Test == 'Strat_PRS',]$Val_Label_1, parse=T, vjust=-0.5, hjust=0) +
          geom_text(aes(y=R+0.04), label=All_res_plot[All_res_plot$Test == 'Strat_PRS',]$Val_Label_2, parse=T, vjust=1, hjust=0) +
          labs(y='Correlation', x='') +
          ylim(NA,0.6) +
          theme_half_open() +
          theme(legend.title=element_blank(),legend.position="top") +
          background_grid(major = 'x', minor = 'x') +
          coord_flip()

Plot_5<-ggplot(All_res_plot[All_res_plot$Test == 'PRScs_and_GeRS',], aes(x=Phenotype, y=R, fill=Model)) +
          geom_bar(stat="identity", position=position_dodge()) +
          scale_fill_grey() +
          geom_text(aes(y=R+0.04), label=All_res_plot[All_res_plot$Test == 'PRScs_and_GeRS',]$Val_Label_1, parse=T, vjust=-0.5, hjust=0) +
          geom_text(aes(y=R+0.04), label=All_res_plot[All_res_plot$Test == 'PRScs_and_GeRS',]$Val_Label_2, parse=T, vjust=1, hjust=0) +
          labs(y='Correlation', x='') +
          ylim(NA,0.6) +
          theme_half_open() +
          theme(legend.title=element_blank(),legend.position="top") +
          background_grid(major = 'x', minor = 'x') +
          coord_flip()

png('/mnt/lustre/users/k1806347/Analyses/GeRS_comparison/UKBB_outcomes_for_prediction/GeRS_tests_summary_UKBB_bw.png', units='px', res=300, width=3000, height=3500)
  plot_grid(Plot_1,Plot_2,Plot_3, Plot_5, labels = "AUTO")
dev.off()

####
# Recreate plot higlighting significant results
####
# Note. I am not going to add error bars as this information is not output with the results files used here. This would either require the difficult job of pulling SE from the pred_eval file or editing the model_builder script and re-running all analyses. There is also quite a lot going on in this figure already as well.

All_res_plot$Sig<-'NS'
All_res_plot$Sig[All_res_plot$R_diff_pval_num < 0.05 & All_res_plot$R_diff > 0]<-'Pos'
All_res_plot$Sig[All_res_plot$R_diff_pval_num < 0.05 & All_res_plot$R_diff < 0]<-'Neg'
All_res_plot$Sig<-factor(All_res_plot$Sig, levels=c('NS','Pos','Neg'))

scale_colour_op <- function(...){
    ggplot2:::manual_scale(
        'colour',
        values = setNames(c("#000000", "#009933","#FF0000"), c('NS', 'Pos', 'Neg')),
        ...
    )
}

# Plot results
Plot_1<-ggplot(All_res_plot[All_res_plot$Test == 'GeRS_multi_pT',], aes(x=Phenotype, y=R, fill=Model)) +
          geom_bar(stat="identity", position=position_dodge()) +
          geom_text(aes(y=R+0.04, colour=Sig), label=All_res_plot[All_res_plot$Test == 'GeRS_multi_pT',]$Val_Label_1, parse=T, vjust=-0.5, hjust=0,show.legend = FALSE) +
          geom_text(aes(y=R+0.04, colour=Sig), label=All_res_plot[All_res_plot$Test == 'GeRS_multi_pT',]$Val_Label_2, parse=T, vjust=1, hjust=0,show.legend = FALSE) +
          scale_colour_op() +
          labs(y='Correlation', x='') +
          ylim(NA,0.6) +
          theme_half_open() +
          theme(legend.title=element_blank(),legend.position="top") +
          background_grid(major = 'x', minor = 'x') +
          coord_flip()

Plot_2<-ggplot(All_res_plot[All_res_plot$Test == 'GeRS_multi_tissue',], aes(x=Phenotype, y=R, fill=Model)) +
          geom_bar(stat="identity", position=position_dodge()) +
          geom_text(aes(y=R+0.04, colour=Sig), label=All_res_plot[All_res_plot$Test == 'GeRS_multi_tissue',]$Val_Label_1, parse=T, vjust=-0.5, hjust=0,show.legend = FALSE) +
          geom_text(aes(y=R+0.04, colour=Sig), label=All_res_plot[All_res_plot$Test == 'GeRS_multi_tissue',]$Val_Label_2, parse=T, vjust=1, hjust=0,show.legend = FALSE) +
          scale_colour_op() +
          labs(y='Correlation', x='') +
          ylim(NA,0.6) +
          theme_half_open() +
          theme(legend.title=element_blank(),legend.position="top") +
          background_grid(major = 'x', minor = 'x') +
          coord_flip()

Plot_3<-ggplot(All_res_plot[All_res_plot$Test == 'PRS_and_GeRS',], aes(x=Phenotype, y=R, fill=Model)) +
          geom_bar(stat="identity", position=position_dodge()) +
          geom_text(aes(y=R+0.04, colour=Sig), label=All_res_plot[All_res_plot$Test == 'PRS_and_GeRS',]$Val_Label_1, parse=T, vjust=-0.5, hjust=0,show.legend = FALSE) +
          geom_text(aes(y=R+0.04, colour=Sig), label=All_res_plot[All_res_plot$Test == 'PRS_and_GeRS',]$Val_Label_2, parse=T, vjust=1, hjust=0,show.legend = FALSE) +
          scale_colour_op() +
          labs(y='Correlation', x='') +
          ylim(NA,0.6) +
          theme_half_open() +
          theme(legend.title=element_blank(),legend.position="top") +
          background_grid(major = 'x', minor = 'x') +
          coord_flip()

Plot_4<-ggplot(All_res_plot[All_res_plot$Test == 'Strat_PRS',], aes(x=Phenotype, y=R, fill=Model)) +
          geom_bar(stat="identity", position=position_dodge()) +
          geom_text(aes(y=R+0.04, colour=Sig), label=All_res_plot[All_res_plot$Test == 'Strat_PRS',]$Val_Label_1, parse=T, vjust=-0.5, hjust=0,show.legend = FALSE) +
          geom_text(aes(y=R+0.04, colour=Sig), label=All_res_plot[All_res_plot$Test == 'Strat_PRS',]$Val_Label_2, parse=T, vjust=1, hjust=0,show.legend = FALSE) +
          scale_colour_op() +
          labs(y='Correlation', x='') +
          ylim(NA,0.6) +
          theme_half_open() +
          theme(legend.title=element_blank(),legend.position="top") +
          background_grid(major = 'x', minor = 'x') +
          coord_flip()

Plot_5<-ggplot(All_res_plot[All_res_plot$Test == 'PRScs_and_GeRS',], aes(x=Phenotype, y=R, fill=Model)) +
          geom_bar(stat="identity", position=position_dodge()) +
          geom_text(aes(y=R+0.04, colour=Sig), label=All_res_plot[All_res_plot$Test == 'PRScs_and_GeRS',]$Val_Label_1, parse=T, vjust=-0.5, hjust=0,show.legend = FALSE) +
          geom_text(aes(y=R+0.04, colour=Sig), label=All_res_plot[All_res_plot$Test == 'PRScs_and_GeRS',]$Val_Label_2, parse=T, vjust=1, hjust=0,show.legend = FALSE) +
          scale_colour_op() +
          labs(y='Correlation', x='') +
          ylim(NA,0.6) +
          theme_half_open() +
          theme(legend.title=element_blank(),legend.position="top") +
          background_grid(major = 'x', minor = 'x') +
          coord_flip()

png('/mnt/lustre/users/k1806347/Analyses/GeRS_comparison/UKBB_outcomes_for_prediction/GeRS_tests_summary_UKBB.png', units='px', res=300, width=3000, height=3500)
  plot_grid(Plot_1,Plot_2,Plot_3, Plot_5, labels = "AUTO")
dev.off()
Plot Rheumatoid Arthritis sensitivity analysis
# Read in the pT+clump (with MHC clump) results
res_3<-read.table('/users/k1806347/brc_scratch/Analyses/GeRS_comparison/UKBB_outcomes_for_prediction/RheuArth/Association_withPRS_and_GeRSs/UKBB.w_hm3.AllTissue.RHEU01.EUR-GeRSs.EUR-PRSs.pt_clump.pred_comp.txt', header=T, stringsAsFactors=F)
res_4<-read.table('/users/k1806347/brc_scratch/Analyses/GeRS_comparison/UKBB_outcomes_for_prediction/RheuArth/Association_withPRS_and_GeRSs/UKBB.w_hm3.AllTissue.RHEU01.noMHCClump.EUR-GeRSs.EUR-PRSs.pt_clump.pred_comp.txt', header=T, stringsAsFactors=F)
res_5<-read.table(paste0('/users/k1806347/brc_scratch/Analyses/GeRS_comparison/UKBB_outcomes_for_prediction/RheuArth/Association_withPRS_and_GeRSs/UKBB.w_hm3.AllTissue.RHEU01.EUR-GeRSs.EUR-PRSs.PRScs.pred_comp.txt'), header=T, stringsAsFactors=F)

res_table<-data.frame(Test=c('PRS_and_GeRS','PRS_noMHCClump_and_GeRS','PRScs_and_GeRS'),
                        do.call(rbind,list( res_3[8,],
                                                    res_4[8,],
                                                    res_5[8,])))

# Calculate percentage difference
res_table$R_diff_perc<-res_table$R_diff/res_table$Model_1_R*100

res_table$Phenotype<-'RheuArth'
res_table<-res_table[,c('Phenotype',names(res_table)[-length(names(res_table))])]

write.csv(res_table, '/mnt/lustre/users/k1806347/Analyses/GeRS_comparison/UKBB_outcomes_for_prediction/GeRS_tests_RheuArth_withnoMHCClump.csv', row.names=F, quote=F)
Show Rheumatoid Arthritis TWAS results
library(data.table)

source('/users/k1806347/brc_scratch/Software/MyGit/GenoPred/config_used/Pipeline_prep.config')

res<-fread(paste0(TWAS_rep,'/RHEU01/RHEU01_res_GW.txt'))

# Sort by abs(TWAS.Z
res<-res[order(-abs(res$TWAS.Z)),]
res<-res[,c('FILE','CHR','P0','P1','PANEL','ID','TWAS.Z','TWAS.P')]
res$FILE<-gsub('.*/','',res$FILE)

# Restrict to top 10% of TWAS.Z
res<-res[abs(res$TWAS.Z) >= quantile(abs(res$TWAS.Z), probs=0.99,na.rm=T),]

res$TWAS.P<-as.character(res$TWAS.P)
res$TWAS.P[res$TWAS.P == '0']<-'<1e-320'

write.csv(res, '/mnt/lustre/users/k1806347/Analyses/GeRS_comparison/UKBB_outcomes_for_prediction/Top_TWAS_res_RheuArth.csv', row.names=F, quote=F)
Plot comparison results (PP4+clump)
#####
# Compare results from each approach
#####

pheno<-c('Depression','Intelligence','BMI','Height','T2D','CAD','IBD','RheuArth')
gwas<-c('DEPR06','COLL01','BODY03','HEIG03','DIAB05','COAD01','CROH01','RHEU01')

res<-list()
for(i in 1:length(gwas)){
res_2<-read.table(paste0('/users/k1806347/brc_scratch/Analyses/GeRS_comparison/UKBB_outcomes_for_prediction/',pheno[i],'/Association_withGeRSs/UKBB.w_hm3.AllTissue.',gwas[i],'.EUR-GeRSs_PP4.pred_comp.txt'), header=T, stringsAsFactors=F)
res_2<-res_2[res_2$Model_1 == 'All',]
res_2<-res_2[res_2$Model_2 != 'All',]
res_3<-read.table(paste0('/users/k1806347/brc_scratch/Analyses/GeRS_comparison/UKBB_outcomes_for_prediction/',pheno[i],'/Association_withPRS_and_GeRSs/UKBB.w_hm3.AllTissue.',gwas[i],'.EUR-GeRSs_PP4.EUR-PRSs.pt_clump.pred_comp.txt'), header=T, stringsAsFactors=F)

res[[pheno[i]]]<-data.frame(Test=c('GeRS_multi_tissue','PRS_and_GeRS'),
                        do.call(rbind,list( res_2[res_2$Model_2_R == max(res_2$Model_2_R),],
                                                    res_3[8,])))
}

res_table<-do.call(rbind, res)
res_table$Phenotype<-gsub('\\..*','',rownames(res_table))
res_table<-res_table[,c('Phenotype',names(res_table)[-length(names(res_table))])]
write.csv(res_table, '/mnt/lustre/users/k1806347/Analyses/GeRS_comparison/UKBB_outcomes_for_prediction/GeRS_PP4_tests_summary.csv', row.names=F, quote=F)

####
# Plot the R2 when using PRS only, and using PRS + multi-tissue GeRS
####

# Organise the results
res_plot<-list()
for(i in 1:length(gwas)){
tmp_res<-res[[pheno[i]]]

tmp_res$R_diff_pval<-format(tmp_res$R_diff_pval, scientific = TRUE, digits = 2)
tmp_res$R_diff_pval<-gsub('e-','*x*10^-',tmp_res$R_diff_pval)

tmp_res_Model_1<-tmp_res[,grepl('Test|Model_1|R_diff',names(tmp_res))]
names(tmp_res_Model_1)<-c('Test','Model','R','R_diff','R_diff_pval')
tmp_res_Model_2<-tmp_res[,grepl('Test|Model_2|R_diff',names(tmp_res))]
names(tmp_res_Model_2)<-c('Test','Model','R','R_diff','R_diff_pval')
tmp_res_Model_2$R_diff<-NA
tmp_res_Model_2$R_diff_pval<-NA

tmp_res_plot<-rbind(tmp_res_Model_1,tmp_res_Model_2)
tmp_res_plot$Phenotype<-pheno[i]

res_plot[[pheno[i]]]<-tmp_res_plot
}

# Combine results for each phenotype and prepare for plotting
All_res_plot<-do.call(rbind, res_plot)

All_res_plot$Test<-factor(All_res_plot$Test, levels=res[[1]]$Test)
All_res_plot$Phenotype<-factor(All_res_plot$Phenotype, level=unique(All_res_plot$Phenotype))
All_res_plot<-All_res_plot[order(All_res_plot$Phenotype,All_res_plot$Test),]

All_res_plot$Val_Label_1<-NA
All_res_plot$Val_Label_1[!is.na(All_res_plot$R_diff)]<-paste0('Diff == ',round(All_res_plot$R_diff[!is.na(All_res_plot$R_diff)],3))

All_res_plot$Val_Label_2<-NA
All_res_plot$Val_Label_2[!is.na(All_res_plot$R_diff)]<-paste0('italic(p) == ',All_res_plot$R_diff_pval[!is.na(All_res_plot$R_diff)])

All_res_plot$Model[!All_res_plot$Model == 'All' & All_res_plot$Test == 'GeRS_multi_tissue']<-'GeRS PP4 Best Tissue   '
All_res_plot$Model[All_res_plot$Model == 'All' & All_res_plot$Test == 'GeRS_multi_tissue']<-'GeRS PP4 Multi Tissue'

All_res_plot$Model[!All_res_plot$Model == 'All' & All_res_plot$Test == 'PRS_and_GeRS']<-'PRS only   '
All_res_plot$Model[All_res_plot$Model == 'All' & All_res_plot$Test == 'PRS_and_GeRS']<-'PRS + GeRS PP4'

All_res_plot$Model<-factor(All_res_plot$Model, levels=c("GeRS PP4 Best Tissue   ","GeRS PP4 Multi Tissue","PRS only   ","PRS + GeRS PP4"))

library(ggplot2)
library(cowplot)

# Plot results
Plot_2<-ggplot(All_res_plot[All_res_plot$Test == 'GeRS_multi_tissue',], aes(x=Phenotype, y=R, fill=Model)) +
          geom_bar(stat="identity", position=position_dodge()) +
          geom_text(aes(y=R+0.04), label=All_res_plot[All_res_plot$Test == 'GeRS_multi_tissue',]$Val_Label_1, parse=T, vjust=-0.5, hjust=0) +
          geom_text(aes(y=R+0.04), label=All_res_plot[All_res_plot$Test == 'GeRS_multi_tissue',]$Val_Label_2, parse=T, vjust=1, hjust=0) +
          labs(y='Correlation', x='') +
          ylim(NA,0.6) +
          theme_half_open() +
          theme(legend.title=element_blank(),legend.position="top") +
          background_grid(major = 'x', minor = 'x') +
          coord_flip()

Plot_3<-ggplot(All_res_plot[All_res_plot$Test == 'PRS_and_GeRS',], aes(x=Phenotype, y=R, fill=Model)) +
          geom_bar(stat="identity", position=position_dodge()) +
          geom_text(aes(y=R+0.04), label=All_res_plot[All_res_plot$Test == 'PRS_and_GeRS',]$Val_Label_1, parse=T, vjust=-0.5, hjust=0) +
          geom_text(aes(y=R+0.04), label=All_res_plot[All_res_plot$Test == 'PRS_and_GeRS',]$Val_Label_2, parse=T, vjust=1, hjust=0) +
          labs(y='Correlation', x='') +
          ylim(NA,0.6) +
          theme_half_open() +
          theme(legend.title=element_blank(),legend.position="top") +
          background_grid(major = 'x', minor = 'x') +
          coord_flip()

png('/mnt/lustre/users/k1806347/Analyses/GeRS_comparison/UKBB_outcomes_for_prediction/GeRS_PP4_tests_summary_UKBB.png', units='px', res=300, width=3500, height=2000)
  plot_grid(Plot_2,Plot_3, labels = "AUTO")
dev.off()
Plot comparison results (Tissue Specific)
#####
# Compare results from each approach
#####

pheno<-c('Depression','Intelligence','BMI','Height','T2D','CAD','IBD','RheuArth')
gwas<-c('DEPR06','COLL01','BODY03','HEIG03','DIAB05','COAD01','CROH01','RHEU01')

res<-list()
for(i in 1:length(gwas)){
res_2<-read.table(paste0('/users/k1806347/brc_scratch/Analyses/GeRS_comparison/UKBB_outcomes_for_prediction/',pheno[i],'/Association_withGeRSs/UKBB.w_hm3.AllTissue.TissueSpecific.',gwas[i],'.EUR-GeRSs.pred_comp.txt'), header=T, stringsAsFactors=F)
res_2<-res_2[res_2$Model_1 == 'All',]
res_2<-res_2[res_2$Model_2 != 'All',]
res_3<-read.table(paste0('/users/k1806347/brc_scratch/Analyses/GeRS_comparison/UKBB_outcomes_for_prediction/',pheno[i],'/Association_withPRS_and_GeRSs/UKBB.w_hm3.AllTissue.TissueSpecific.',gwas[i],'.EUR-GeRSs.EUR-PRSs.pt_clump.pred_comp.txt'), header=T, stringsAsFactors=F)

res[[pheno[i]]]<-data.frame(Test=c('GeRS_multi_tissue','PRS_and_GeRS'),
                        do.call(rbind,list( res_2[res_2$Model_2_R == max(res_2$Model_2_R),],
                                                    res_3[8,])))
}

res_table<-do.call(rbind, res)
res_table$Phenotype<-gsub('\\..*','',rownames(res_table))
res_table<-res_table[,c('Phenotype',names(res_table)[-length(names(res_table))])]
write.csv(res_table, '/mnt/lustre/users/k1806347/Analyses/GeRS_comparison/UKBB_outcomes_for_prediction/GeRS_TissueSpecific_tests_summary.csv', row.names=F, quote=F)

####
# Plot the R2 when using PRS only, and using PRS + multi-tissue GeRS
####

# Organise the results
res_plot<-list()
for(i in 1:length(gwas)){
tmp_res<-res[[pheno[i]]]

tmp_res$R_diff_pval<-format(tmp_res$R_diff_pval, scientific = TRUE, digits = 2)
tmp_res$R_diff_pval<-gsub('e-','*x*10^-',tmp_res$R_diff_pval)

tmp_res_Model_1<-tmp_res[,grepl('Test|Model_1|R_diff',names(tmp_res))]
names(tmp_res_Model_1)<-c('Test','Model','R','R_diff','R_diff_pval')
tmp_res_Model_2<-tmp_res[,grepl('Test|Model_2|R_diff',names(tmp_res))]
names(tmp_res_Model_2)<-c('Test','Model','R','R_diff','R_diff_pval')
tmp_res_Model_2$R_diff<-NA
tmp_res_Model_2$R_diff_pval<-NA

tmp_res_plot<-rbind(tmp_res_Model_1,tmp_res_Model_2)
tmp_res_plot$Phenotype<-pheno[i]

res_plot[[pheno[i]]]<-tmp_res_plot
}

# Combine results for each phenotype and prepare for plotting
All_res_plot<-do.call(rbind, res_plot)

All_res_plot$Test<-factor(All_res_plot$Test, levels=res[[1]]$Test)
All_res_plot$Phenotype<-factor(All_res_plot$Phenotype, level=unique(All_res_plot$Phenotype))
All_res_plot<-All_res_plot[order(All_res_plot$Phenotype,All_res_plot$Test),]

All_res_plot$Val_Label_1<-NA
All_res_plot$Val_Label_1[!is.na(All_res_plot$R_diff)]<-paste0('Diff == ',round(All_res_plot$R_diff[!is.na(All_res_plot$R_diff)],3))

All_res_plot$Val_Label_2<-NA
All_res_plot$Val_Label_2[!is.na(All_res_plot$R_diff)]<-paste0('italic(p) == ',All_res_plot$R_diff_pval[!is.na(All_res_plot$R_diff)])

All_res_plot$Model[!All_res_plot$Model == 'All' & All_res_plot$Test == 'GeRS_multi_tissue']<-'GeRS TissueSpecific\nBest Tissue   '
All_res_plot$Model[All_res_plot$Model == 'All' & All_res_plot$Test == 'GeRS_multi_tissue']<-'GeRS TissueSpecific\nMulti Tissue'

All_res_plot$Model[!All_res_plot$Model == 'All' & All_res_plot$Test == 'PRS_and_GeRS']<-'PRS only   '
All_res_plot$Model[All_res_plot$Model == 'All' & All_res_plot$Test == 'PRS_and_GeRS']<-'PRS + GeRS TissueSpecific'

All_res_plot$Model<-factor(All_res_plot$Model, levels=c("GeRS TissueSpecific\nBest Tissue   ","GeRS TissueSpecific\nMulti Tissue","PRS only   ","PRS + GeRS TissueSpecific"))

library(ggplot2)
library(cowplot)

# Plot results
Plot_2<-ggplot(All_res_plot[All_res_plot$Test == 'GeRS_multi_tissue',], aes(x=Phenotype, y=R, fill=Model)) +
          geom_bar(stat="identity", position=position_dodge()) +
          geom_text(aes(y=R+0.04), label=All_res_plot[All_res_plot$Test == 'GeRS_multi_tissue',]$Val_Label_1, parse=T, vjust=-0.5, hjust=0) +
          geom_text(aes(y=R+0.04), label=All_res_plot[All_res_plot$Test == 'GeRS_multi_tissue',]$Val_Label_2, parse=T, vjust=1, hjust=0) +
          labs(y='Correlation', x='') +
          ylim(NA,0.6) +
          theme_half_open() +
          theme(legend.title=element_blank(),legend.position="top") +
          background_grid(major = 'x', minor = 'x') +
          coord_flip()

Plot_3<-ggplot(All_res_plot[All_res_plot$Test == 'PRS_and_GeRS',], aes(x=Phenotype, y=R, fill=Model)) +
          geom_bar(stat="identity", position=position_dodge()) +
          geom_text(aes(y=R+0.04), label=All_res_plot[All_res_plot$Test == 'PRS_and_GeRS',]$Val_Label_1, parse=T, vjust=-0.5, hjust=0) +
          geom_text(aes(y=R+0.04), label=All_res_plot[All_res_plot$Test == 'PRS_and_GeRS',]$Val_Label_2, parse=T, vjust=1, hjust=0) +
          labs(y='Correlation', x='') +
          ylim(NA,0.6) +
          theme_half_open() +
          theme(legend.title=element_blank(),legend.position="top") +
          background_grid(major = 'x', minor = 'x') +
          coord_flip()

png('/mnt/lustre/users/k1806347/Analyses/GeRS_comparison/UKBB_outcomes_for_prediction/GeRS_TissueSpecific_tests_summary_UKBB.png', units='px', res=300, width=3500, height=2000)
  plot_grid(Plot_2,Plot_3, labels = "AUTO")
dev.off()
Compare stratified PRS to multi-tissue GeRS
# Plot the results of the stratified PRS against Multi-tissue GeRS
# And look at the variance exaplained by each tissue
pheno<-c('Depression','Intelligence','BMI','Height','T2D','CAD','IBD','RheuArth')
gwas<-c('DEPR06','COLL01','BODY03','HEIG03','DIAB05','COAD01','CROH01','RHEU01')

res<-list()
crossTissue<-list()

for(i in 1:length(gwas)){
res_GeRS<-read.table(paste0('/users/k1806347/brc_scratch/Analyses/GeRS_comparison/UKBB_outcomes_for_prediction/',pheno[i],'/Association_withGeRSs/UKBB.w_hm3.AllTissue.',gwas[i],'.EUR-GeRSs.pred_eval.txt'), header=T, stringsAsFactors=F)

res_GeRS<-res_GeRS[dim(res_GeRS)[1],]

res_GeRS_coloc<-read.table(paste0('/users/k1806347/brc_scratch/Analyses/GeRS_comparison/UKBB_outcomes_for_prediction/',pheno[i],'/Association_withGeRSs/UKBB.w_hm3.AllTissue.',gwas[i],'.EUR-GeRSs_pT_withColoc.pred_eval.txt'), header=T, stringsAsFactors=F)

res_GeRS_coloc<-res_GeRS_coloc[dim(res_GeRS_coloc)[1],]

res_stratPRS<-read.table(paste0('/users/k1806347/brc_scratch/Analyses/GeRS_comparison/UKBB_outcomes_for_prediction/',pheno[i],'/Association_withPRSs/UKBB.w_hm3.',gwas[i],'.EUR-PRSs-TWAS_gene_stratified.pred_eval.txt'), header=T, stringsAsFactors=F)

res_stratPRS<-res_stratPRS[2,]

res_GWPRS<-read.table(paste0('/users/k1806347/brc_scratch/Analyses/GeRS_comparison/UKBB_outcomes_for_prediction/',pheno[i],'/Association_withPRSs/UKBB.w_hm3.',gwas[i],'.EUR-PRSs.pred_eval.txt'), header=T, stringsAsFactors=F)
res_GWPRS<-res_GWPRS[dim(res_GWPRS)[1],]

res_all<-do.call(rbind, list(res_GeRS, res_GeRS_coloc, res_stratPRS, res_GWPRS))
res_all$Method<-c('GeRS',"GeRS (coloc)","PRS (Gene)",'PRS')
res_all$Phenotype<-pheno[i]

res_all<-res_all[,c('Model','R','SE','P','N','Method','Phenotype')]

res[[pheno[i]]]<-res_all
}

res_table<-do.call(rbind, res)
res_table<-res_table[,c('Phenotype','Method','R','SE')]

write.csv(res_table, '/mnt/lustre/users/k1806347/Analyses/GeRS_comparison/UKBB_outcomes_for_prediction/StratPRS_comp_summary.csv', row.names=F, quote=F)

library(ggplot2)
library(cowplot)
# Plot comparison across PRS, stratified PRS and GeRS
res_table$Phenotype<-factor(res_table$Phenotype, level=unique(res_table$Phenotype))

png('/mnt/lustre/users/k1806347/Analyses/GeRS_comparison/UKBB_outcomes_for_prediction/StratPRS_comp_UKBB.png', units='px', res=300, width=1500, height=1000)

ggplot(res_table, aes(x=Phenotype, y=R, fill=Method)) +
          geom_bar(stat="identity", position=position_dodge(0.9)) +
          geom_errorbar(aes(ymin=R-SE, ymax=R+SE), width=.2,
                 position=position_dodge(0.9)) +
          labs(y="Correlation (SE)", x='') +
              ylim(0,0.4) +
          theme_half_open() +
          theme(axis.text.x = element_text(angle = 45, hjust = 1), legend.position="top", legend.justification = c(0.5, 0), legend.title=element_blank()) +
          guides(fill=guide_legend(title.hjust =0.5)) +
          background_grid(major = 'y', minor = 'y')

dev.off()

# Make black and white version
png('/mnt/lustre/users/k1806347/Analyses/GeRS_comparison/UKBB_outcomes_for_prediction/StratPRS_comp_UKBB_bw.png', units='px', res=300, width=1500, height=1000)

ggplot(res_table, aes(x=Phenotype, y=R, fill=Method)) +
          geom_bar(stat="identity", position=position_dodge(0.9)) +
          scale_fill_grey() +
          geom_errorbar(aes(ymin=R-SE, ymax=R+SE), width=.2,
                 position=position_dodge(0.9)) +
          labs(y="Correlation (SE)", x='') +
              ylim(0,0.4) +
          theme_half_open() +
          theme(axis.text.x = element_text(angle = 45, hjust = 1), legend.position="top", legend.justification = c(0.5, 0), legend.title=element_blank()) +
          guides(fill=guide_legend(title.hjust =0.5)) +
          background_grid(major = 'y', minor = 'y')

dev.off()

# Make the plot without the coloc result
png('/mnt/lustre/users/k1806347/Analyses/GeRS_comparison/UKBB_outcomes_for_prediction/StratPRS_comp_nocoloc_UKBB.png', units='px', res=300, width=1500, height=1000)

ggplot(res_table[(res_table$Method %in% c('GeRS','PRS',"PRS (Gene)")),], aes(x=Phenotype, y=R, fill=Method)) +
          geom_bar(stat="identity", position=position_dodge(0.9)) +
          geom_errorbar(aes(ymin=R-SE, ymax=R+SE), width=.2,
                 position=position_dodge(0.9)) +
          labs(y="Correlation (SE)", x='') +
              ylim(0,0.4) +
          theme_half_open() +
          theme(axis.text.x = element_text(angle = 45, hjust = 1), legend.position="top", legend.justification = c(0.5, 0), legend.title=element_blank()) +
          guides(fill=guide_legend(title.hjust =0.5)) +
          background_grid(major = 'y', minor = 'y')

dev.off()

# Make the plot with just PRS and GeRS
png('/mnt/lustre/users/k1806347/Analyses/GeRS_comparison/UKBB_outcomes_for_prediction/StratPRS_comp_justPRSGeRS_UKBB.png', units='px', res=300, width=1500, height=1000)

ggplot(res_table[(res_table$Method %in% c('GeRS','PRS')),], aes(x=Phenotype, y=R, fill=Method)) +
          geom_bar(stat="identity", position=position_dodge(0.9)) +
          geom_errorbar(aes(ymin=R-SE, ymax=R+SE), width=.2,
                 position=position_dodge(0.9)) +
          labs(y="Correlation (SE)", x='') +
              ylim(0,0.4) +
          theme_half_open() +
          theme(axis.text.x = element_text(angle = 45, hjust = 1), legend.position="top", legend.justification = c(0.5, 0), legend.title=element_blank()) +
          guides(fill=guide_legend(title.hjust =0.5)) +
          background_grid(major = 'y', minor = 'y')

dev.off()
Compare GeRS to PP4 and TissueSpecific GeRS
# Plot the results of the stratified PRS against Multi-tissue GeRS
# And look at the variance exaplained by each tissue
pheno<-c('Depression','Intelligence','BMI','Height','T2D','CAD','IBD','RheuArth')
gwas<-c('DEPR06','COLL01','BODY03','HEIG03','DIAB05','COAD01','CROH01','RHEU01')

res<-list()
crossTissue<-list()

for(i in 1:length(gwas)){
res_GeRS<-read.table(paste0('/users/k1806347/brc_scratch/Analyses/GeRS_comparison/UKBB_outcomes_for_prediction/',pheno[i],'/Association_withGeRSs/UKBB.w_hm3.AllTissue.',gwas[i],'.EUR-GeRSs.pred_eval.txt'), header=T, stringsAsFactors=F)

res_GeRS_all<-res_GeRS[dim(res_GeRS)[1],]
res_GeRS<-res_GeRS[-dim(res_GeRS)[1],]
res_GeRS_best<-res_GeRS[which(res_GeRS$R == max(res_GeRS$R)),]

res_GeRS_coloc<-read.table(paste0('/users/k1806347/brc_scratch/Analyses/GeRS_comparison/UKBB_outcomes_for_prediction/',pheno[i],'/Association_withGeRSs/UKBB.w_hm3.AllTissue.',gwas[i],'.EUR-GeRSs_pT_withColoc.pred_eval.txt'), header=T, stringsAsFactors=F)

res_GeRS_coloc_all<-res_GeRS_coloc[dim(res_GeRS_coloc)[1],]
res_GeRS_coloc<-res_GeRS_coloc[-dim(res_GeRS_coloc)[1],]
res_GeRS_coloc_best<-res_GeRS_coloc[which(res_GeRS_coloc$R == max(res_GeRS_coloc$R)),]

res_GeRS_TS<-read.table(paste0('/users/k1806347/brc_scratch/Analyses/GeRS_comparison/UKBB_outcomes_for_prediction/',pheno[i],'/Association_withGeRSs/UKBB.w_hm3.AllTissue.TissueSpecific.',gwas[i],'.EUR-GeRSs.pred_eval.txt'), header=T, stringsAsFactors=F)

res_GeRS_TS_all<-res_GeRS_TS[dim(res_GeRS_TS)[1],]
res_GeRS_TS<-res_GeRS_TS[-dim(res_GeRS_TS)[1],]
res_GeRS_TS_best<-res_GeRS_TS[which(res_GeRS_TS$R == max(res_GeRS_TS$R)),]

res_all<-do.call(rbind, list(res_GeRS_best,res_GeRS_all,res_GeRS_coloc_best,res_GeRS_coloc_all,res_GeRS_TS_best, res_GeRS_TS_all))
res_all$Method<-c("GeRS (best)","GeRS (all)","GeRS coloc (best)","GeRS coloc (all)","GeRS TS (best)","GeRS TS (all)")

res_all$Phenotype<-pheno[i]

res_all<-res_all[,c('Model','R','SE','P','N','Method','Phenotype')]

res[[pheno[i]]]<-res_all
}

res_table<-do.call(rbind, res)
res_table<-res_table[,c('Phenotype','Method','R','SE')]

write.csv(res_table, '/mnt/lustre/users/k1806347/Analyses/GeRS_comparison/UKBB_outcomes_for_prediction/GeRS_coloc_TissueSpecific_comp_summary.csv', row.names=F, quote=F)

library(ggplot2)
library(cowplot)
# Plot comparison across GeRS
res_table$Phenotype<-factor(res_table$Phenotype, level=unique(res_table$Phenotype))

res_table$Method<-factor(res_table$Method, levels=c("GeRS (best)","GeRS (all)","GeRS coloc (best)","GeRS coloc (all)","GeRS TS (best)","GeRS TS (all)"))

png('/mnt/lustre/users/k1806347/Analyses/GeRS_comparison/UKBB_outcomes_for_prediction/GeRS_coloc_TissueSpecific_comp_UKBB.png', units='px', res=300, width=2000, height=1000)

ggplot(res_table, aes(x=Phenotype, y=R, fill=Method)) +
          geom_bar(stat="identity", position=position_dodge(0.9)) +
          geom_errorbar(aes(ymin=R-SE, ymax=R+SE), width=.2,
                 position=position_dodge(0.9)) +
          labs(y="Correlation (SE)", x='') +
              ylim(0,0.3) +
          theme_half_open() +
          theme(axis.text.x = element_text(angle = 45, hjust = 1), legend.position="top", legend.justification = c(0.5, 0), legend.title=element_blank()) +
          guides(fill=guide_legend(title.hjust =0.5)) +
          background_grid(major = 'y', minor = 'y')

dev.off()
Plot GeRS across tissues
pheno<-c('Depression','Intelligence','BMI','Height','T2D','CAD','IBD','RheuArth')
gwas<-c('DEPR06','COLL01','BODY03','HEIG03','DIAB05','COAD01','CROH01','RHEU01')

crossTissue<-list()

for(i in 1:length(gwas)){
res_GeRS<-read.table(paste0('/users/k1806347/brc_scratch/Analyses/GeRS_comparison/UKBB_outcomes_for_prediction/',pheno[i],'/Association_withGeRSs/UKBB.w_hm3.AllTissue.',gwas[i],'.EUR-GeRSs.pred_eval.txt'), header=T, stringsAsFactors=F)


crossTissue_i<-res_GeRS

crossTissue_i$Phenotype<-pheno[i]

crossTissue_i<-crossTissue_i[,c('Phenotype','Model','R','SE','P')]

crossTissue_i$Model<-gsub('_group','',crossTissue_i$Model)
crossTissue_i$Panel<-crossTissue_i$Model

crossTissue_i$Model<-gsub('CMC.BRAIN.RNASEQ','CMC DLPFC',crossTissue_i$Model)
crossTissue_i$Model<-gsub('SPLICING','Splicing',crossTissue_i$Model)
crossTissue_i$Model<-gsub('NTR.BLOOD.RNAARR','NTR Blood',crossTissue_i$Model)
crossTissue_i$Model<-gsub('YFS.BLOOD.RNAARR','YFS Blood',crossTissue_i$Model)
crossTissue_i$Model<-gsub('METSIM.ADIPOSE.RNASEQ','METSIM Adipose',crossTissue_i$Model)
crossTissue_i$Model<-gsub('\\.',' ',crossTissue_i$Model)
crossTissue_i$Model[!grepl('CMC|NTR|YFS|METSIM|All', crossTissue_i$Model)]<-paste0('GTEx ',crossTissue_i$Model[!grepl('CMC|NTR|YFS|METSIM|All', crossTissue_i$Model)])
crossTissue_i$Model<-gsub('Brain', '', crossTissue_i$Model)
crossTissue_i$Model <- gsub('Anterior cingulate cortex', 'ACC', crossTissue_i$Model)
crossTissue_i$Model <- gsub('basal ganglia', '', crossTissue_i$Model)
crossTissue_i$Model <- gsub('BA9', '', crossTissue_i$Model)
crossTissue_i$Model <- gsub('BA24', '', crossTissue_i$Model)
crossTissue_i$Model <- gsub('  ', ' ', crossTissue_i$Model)
crossTissue_i$Model_short<-substr(crossTissue_i$Model, start = 1, stop = 18)  #start the name at the first character and stop at the 25th
crossTissue_i$Model_short[nchar(crossTissue_i$Model) > 18]<-paste0(crossTissue_i$Model_short[nchar(crossTissue_i$Model) > 18], "...")

crossTissue_i$R_scaled<-scale(crossTissue_i$R)

crossTissue[[pheno[i]]]<-crossTissue_i

}

crossTissue_table<-do.call(rbind, crossTissue)
crossTissue_table<-crossTissue_table[,c('Phenotype','Model','Model_short','R','SE','Panel','R_scaled')]

library(ggplot2)
library(cowplot)

plot_list<-list()
for(i in 1:length(gwas)){
  tmp<-crossTissue[[pheno[i]]]
  tmp$Model_short<-factor(tmp$Model_short, level=tmp$Model_short[rev(order(tmp$R))])
  tmp$Colour<-ifelse(tmp$Model_short == 'All', 'All', 'Single')

plot_list[[pheno[i]]]<-ggplot(tmp, aes(x=Model_short, y=R, fill=Colour)) +
          geom_bar(stat="identity", position=position_dodge(0.9)) +
          geom_errorbar(aes(ymin=R-SE, ymax=R+SE), width=.2,
                 position=position_dodge(0.9)) +
          labs(y="Correlation (SE)", x='', title=pheno[i]) +
          theme_half_open() +
          theme(axis.text.x = element_text(angle = 90, hjust = 1, vjust=0.5, size=10), legend.position = "none") +
          background_grid(major = 'y', minor = 'y')
}

png('/mnt/lustre/users/k1806347/Analyses/GeRS_comparison/UKBB_outcomes_for_prediction/GeRS_Tissue_comp_UKBB.png', units='px', res=300, width=3000, height=10000)
  plot_grid(plotlist=plot_list, ncol=1)
dev.off()

# Estimate the correlation between SNP-weight set sample size, number of features and predictive utility
weight_info<-fread('/users/k1806347/brc_scratch/Analyses/GeRS_comparison/snp_weights_table.csv')
weight_info$Set<-gsub('_','.',weight_info$Set)
weight_info$Set<-gsub('-','.',weight_info$Set)

crossTissue_table<-merge(crossTissue_table, weight_info, by.x='Panel', by.y='Set')

# Check correlation across
cor(crossTissue_table$R, crossTissue_table$N_indiv) # 0.1516963
feat_cor<-cor(crossTissue_table$R, crossTissue_table$N_feat) # 0.2879782
cor(crossTissue_table$N_indiv, crossTissue_table$N_feat) # 0.3263912

summary(lm(R ~ N_feat + N_indiv, data=crossTissue_table)) # R2 = 0.08666
# N_indiv effect is non significant when moddeling N_feat
crossTissue_table$R_resid<-resid(lm(R ~ N_feat, data=crossTissue_table))

plot_list<-list()
for(i in 1:length(gwas)){
  crossTissue_table$R_resid[crossTissue_table$Phenotype == pheno[i]]<-scale(crossTissue_table$R_resid[crossTissue_table$Phenotype == pheno[i]])
  tmp<-crossTissue_table[crossTissue_table$Phenotype == pheno[i],]
  tmp$Model_short<-factor(tmp$Model_short, level=tmp$Model_short[rev(order(tmp$R_resid))])
  tmp$Colour<-ifelse(tmp$Model_short == 'All', 'All', 'Single')

plot_list[[pheno[i]]]<-ggplot(tmp, aes(x=Model_short, y=R_resid, fill=Colour)) +
          geom_bar(stat="identity", position=position_dodge(0.9)) +
          labs(y="Residual Correlation", x='', title=pheno[i]) +
          theme_half_open() +
          theme(axis.text.x = element_text(angle = 90, hjust = 1, vjust=0.5, size=10), legend.position = "none") +
          background_grid(major = 'y', minor = 'y')
}

png('/mnt/lustre/users/k1806347/Analyses/GeRS_comparison/UKBB_outcomes_for_prediction/GeRS_Tissue_comp_resid_UKBB.png', units='px', res=300, width=3000, height=10000)
  plot_grid(plotlist=plot_list, ncol=1)
dev.off()

# Plot relationship between N_feat and R2 scaled for each phenotype
png('/mnt/lustre/users/k1806347/Analyses/GeRS_comparison/UKBB_outcomes_for_prediction/GeRS_Tissue_comp_Nfeat_UKBB.png', units='px', res=300, width=1500, height=1000)
ggplot(crossTissue_table, aes(x=N_feat, R_scaled)) +
  labs(y="Relative prediction", x='Number of features') +
  geom_smooth(method='lm') +
  annotate("text", x=7500, y=-2, label = paste0("italic('r') == ",round(feat_cor,2)), parse=T) +
  geom_point(data=crossTissue_table, aes(x=N_feat, R_scaled, colour=Phenotype)) +
  theme_half_open()
dev.off()
Plot GeRS (PP4+clump) across tissues
pheno<-c('Depression','Intelligence','BMI','Height','T2D','CAD','IBD','RheuArth')
gwas<-c('DEPR06','COLL01','BODY03','HEIG03','DIAB05','COAD01','CROH01','RHEU01')

crossTissue<-list()

for(i in 1:length(gwas)){
res_GeRS<-read.table(paste0('/users/k1806347/brc_scratch/Analyses/GeRS_comparison/UKBB_outcomes_for_prediction/',pheno[i],'/Association_withGeRSs/UKBB.w_hm3.AllTissue.',gwas[i],'.EUR-GeRSs_PP4.pred_eval.txt'), header=T, stringsAsFactors=F)

crossTissue_i<-res_GeRS

crossTissue_i$Phenotype<-pheno[i]

crossTissue_i<-crossTissue_i[,c('Phenotype','Model','R','SE','P')]

crossTissue_i$Model<-gsub('_group','',crossTissue_i$Model)
crossTissue_i$Panel<-crossTissue_i$Model

crossTissue_i$Model<-gsub('CMC.BRAIN.RNASEQ','CMC DLPFC',crossTissue_i$Model)
crossTissue_i$Model<-gsub('SPLICING','Splicing',crossTissue_i$Model)
crossTissue_i$Model<-gsub('NTR.BLOOD.RNAARR','NTR Blood',crossTissue_i$Model)
crossTissue_i$Model<-gsub('YFS.BLOOD.RNAARR','YFS Blood',crossTissue_i$Model)
crossTissue_i$Model<-gsub('METSIM.ADIPOSE.RNASEQ','METSIM Adipose',crossTissue_i$Model)
crossTissue_i$Model<-gsub('\\.',' ',crossTissue_i$Model)
crossTissue_i$Model[!grepl('CMC|NTR|YFS|METSIM|All', crossTissue_i$Model)]<-paste0('GTEx ',crossTissue_i$Model[!grepl('CMC|NTR|YFS|METSIM|All', crossTissue_i$Model)])
crossTissue_i$Model<-gsub('Brain', '', crossTissue_i$Model)
crossTissue_i$Model <- gsub('Anterior cingulate cortex', 'ACC', crossTissue_i$Model)
crossTissue_i$Model <- gsub('basal ganglia', '', crossTissue_i$Model)
crossTissue_i$Model <- gsub('BA9', '', crossTissue_i$Model)
crossTissue_i$Model <- gsub('BA24', '', crossTissue_i$Model)
crossTissue_i$Model <- gsub('  ', ' ', crossTissue_i$Model)
crossTissue_i$Model_short<-substr(crossTissue_i$Model, start = 1, stop = 18)  #start the name at the first character and stop at the 25th
crossTissue_i$Model_short[nchar(crossTissue_i$Model) > 18]<-paste0(crossTissue_i$Model_short[nchar(crossTissue_i$Model) > 18], "...")

crossTissue[[pheno[i]]]<-crossTissue_i

}

crossTissue_table<-do.call(rbind, crossTissue)
crossTissue_table<-crossTissue_table[,c('Phenotype','Model','Model_short','R','SE','Panel')]

library(ggplot2)
library(cowplot)

plot_list<-list()
for(i in 1:length(gwas)){
  tmp<-crossTissue[[pheno[i]]]
  tmp$Model_short<-factor(tmp$Model_short, level=tmp$Model_short[rev(order(tmp$R))])
  tmp$Colour<-ifelse(tmp$Model_short == 'All', 'All', 'Single')

plot_list[[pheno[i]]]<-ggplot(tmp, aes(x=Model_short, y=R, fill=Colour)) +
          geom_bar(stat="identity", position=position_dodge(0.9)) +
          geom_errorbar(aes(ymin=R-SE, ymax=R+SE), width=.2,
                 position=position_dodge(0.9)) +
          labs(y="Correlation (SE)", x='', title=pheno[i]) +
          theme_half_open() +
          theme(axis.text.x = element_text(angle = 90, hjust = 1, vjust=0.5, size=10), legend.position = "none") +
          background_grid(major = 'y', minor = 'y')
}

png('/mnt/lustre/users/k1806347/Analyses/GeRS_comparison/UKBB_outcomes_for_prediction/GeRS_PP4_Tissue_comp_UKBB.png', units='px', res=300, width=3000, height=10000)
  plot_grid(plotlist=plot_list, ncol=1)
dev.off()

# Estimate the correlation between SNP-weight set sample size, number of features and predictive utility
weight_info<-fread('/users/k1806347/brc_scratch/Analyses/GeRS_comparison/snp_weights_table.csv')
weight_info$Set<-gsub('_','.',weight_info$Set)
weight_info$Set<-gsub('-','.',weight_info$Set)

crossTissue_table<-merge(crossTissue_table, weight_info, by.x='Panel', by.y='Set')

# Check correlation across
cor(crossTissue_table$R, crossTissue_table$N_indiv) # 0.1289168
cor(crossTissue_table$R, crossTissue_table$N_feat) # 0.2561282
cor(crossTissue_table$N_indiv, crossTissue_table$N_feat) # 0.3263912

summary(lm(R ~ N_feat + N_indiv, data=crossTissue_table)) # R2 = 0.0679
crossTissue_table$R_resid<-resid(lm(R ~ N_feat + N_indiv, data=crossTissue_table))
Plot GeRS (TissueSpecific) across tissues
pheno<-c('Depression','Intelligence','BMI','Height','T2D','CAD','IBD','RheuArth')
gwas<-c('DEPR06','COLL01','BODY03','HEIG03','DIAB05','COAD01','CROH01','RHEU01')

crossTissue<-list()

for(i in 1:length(gwas)){
res_GeRS<-read.table(paste0('/users/k1806347/brc_scratch/Analyses/GeRS_comparison/UKBB_outcomes_for_prediction/',pheno[i],'/Association_withGeRSs/UKBB.w_hm3.AllTissue.TissueSpecific.',gwas[i],'.EUR-GeRSs.pred_eval.txt'), header=T, stringsAsFactors=F)

crossTissue_i<-res_GeRS

crossTissue_i$Phenotype<-pheno[i]

crossTissue_i<-crossTissue_i[,c('Phenotype','Model','R','SE','P')]

crossTissue_i$Model<-gsub('_group','',crossTissue_i$Model)

crossTissue_i$Model<-gsub('CMC.BRAIN.RNASEQ','CMC DLPFC',crossTissue_i$Model)
crossTissue_i$Model<-gsub('SPLICING','Splicing',crossTissue_i$Model)
crossTissue_i$Model<-gsub('NTR.BLOOD.RNAARR','NTR Blood',crossTissue_i$Model)
crossTissue_i$Model<-gsub('YFS.BLOOD.RNAARR','YFS Blood',crossTissue_i$Model)
crossTissue_i$Model<-gsub('METSIM.ADIPOSE.RNASEQ','METSIM Adipose',crossTissue_i$Model)
crossTissue_i$Model<-gsub('\\.',' ',crossTissue_i$Model)
crossTissue_i$Model[!grepl('CMC|NTR|YFS|METSIM|All', crossTissue_i$Model)]<-paste0('GTEx ',crossTissue_i$Model[!grepl('CMC|NTR|YFS|METSIM|All', crossTissue_i$Model)])
crossTissue_i$Model<-gsub('Brain', '', crossTissue_i$Model)
crossTissue_i$Model <- gsub('Anterior cingulate cortex', 'ACC', crossTissue_i$Model)
crossTissue_i$Model <- gsub('basal ganglia', '', crossTissue_i$Model)
crossTissue_i$Model <- gsub('BA9', '', crossTissue_i$Model)
crossTissue_i$Model <- gsub('BA24', '', crossTissue_i$Model)
crossTissue_i$Model <- gsub('  ', ' ', crossTissue_i$Model)
crossTissue_i$Model_short<-substr(crossTissue_i$Model, start = 1, stop = 18)  #start the name at the first character and stop at the 25th
crossTissue_i$Model_short[nchar(crossTissue_i$Model) > 18]<-paste0(crossTissue_i$Model_short[nchar(crossTissue_i$Model) > 18], "...")

crossTissue[[pheno[i]]]<-crossTissue_i

}

crossTissue_table<-do.call(rbind, crossTissue)
crossTissue_table<-crossTissue_table[,c('Phenotype','Model','Model_short','R','SE')]

library(ggplot2)
library(cowplot)

plot_list<-list()
for(i in 1:length(gwas)){
  tmp<-crossTissue[[pheno[i]]]
  tmp$Model_short<-factor(tmp$Model_short, level=tmp$Model_short[rev(order(tmp$R))])
  tmp$Colour<-ifelse(tmp$Model_short == 'All', 'All', 'Single')

plot_list[[pheno[i]]]<-ggplot(tmp, aes(x=Model_short, y=R, fill=Colour)) +
          geom_bar(stat="identity", position=position_dodge(0.9)) +
          geom_errorbar(aes(ymin=R-SE, ymax=R+SE), width=.2,
                 position=position_dodge(0.9)) +
          labs(y="Correlation (SE)", x='', title=pheno[i]) +
          theme_half_open() +
          theme(axis.text.x = element_text(angle = 90, hjust = 1, vjust=0.5, size=10), legend.position = "none") +
          background_grid(major = 'y', minor = 'y')
}

png('/mnt/lustre/users/k1806347/Analyses/GeRS_comparison/UKBB_outcomes_for_prediction/GeRS_TissueSpecific_Tissue_comp_UKBB.png', units='px', res=300, width=3000, height=10000)
  plot_grid(plotlist=plot_list, ncol=1)
dev.off()
Show GeRS prediction across p-value thresholds
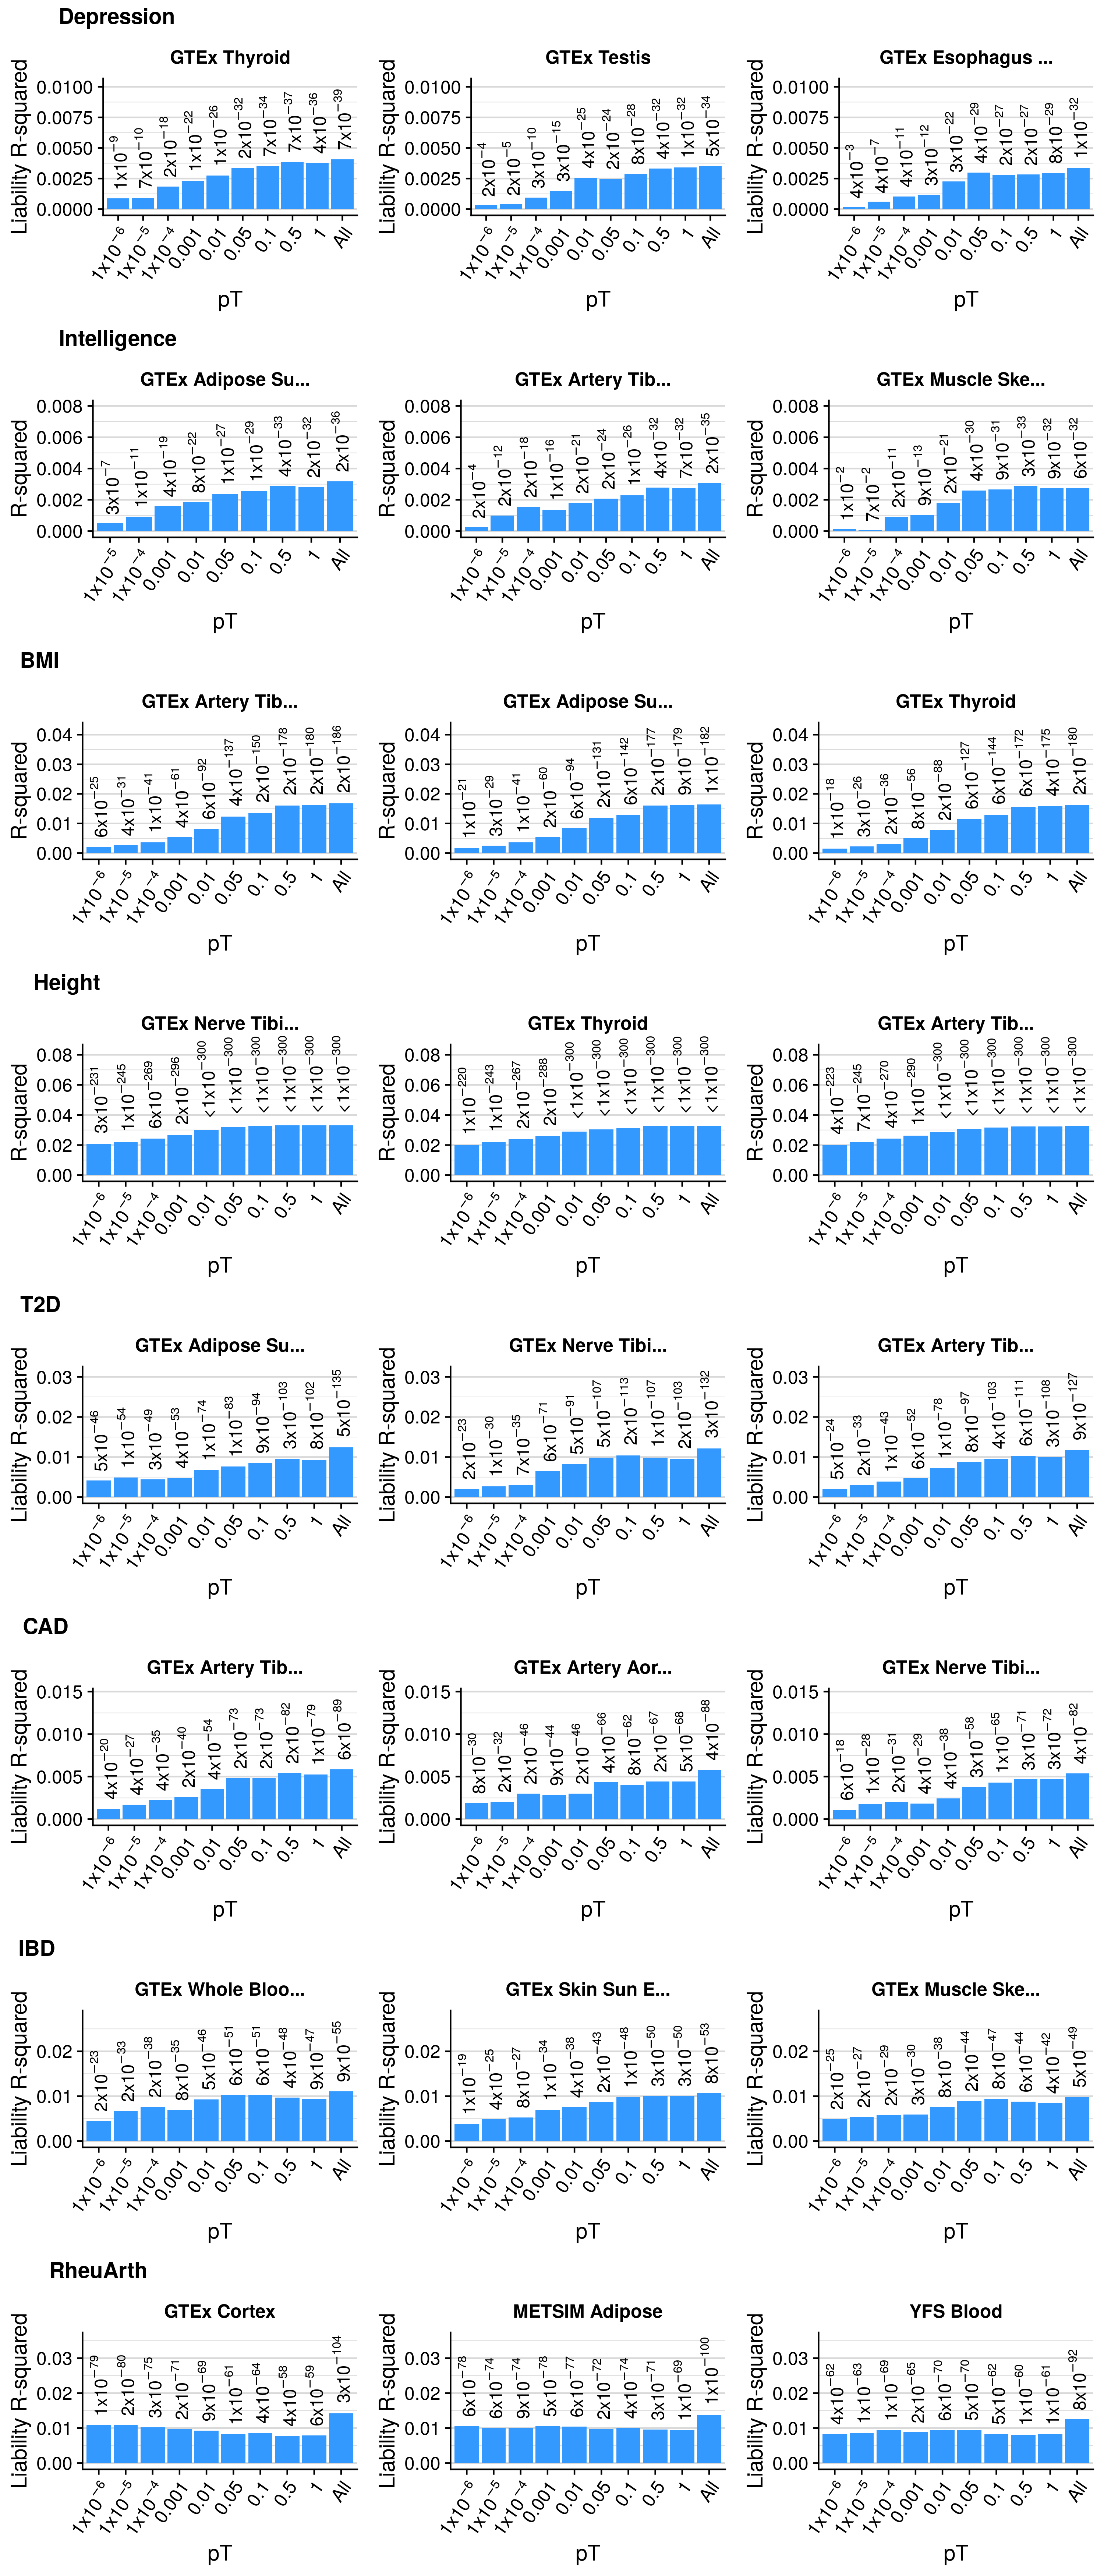
Predictive utility: R2 y-axis
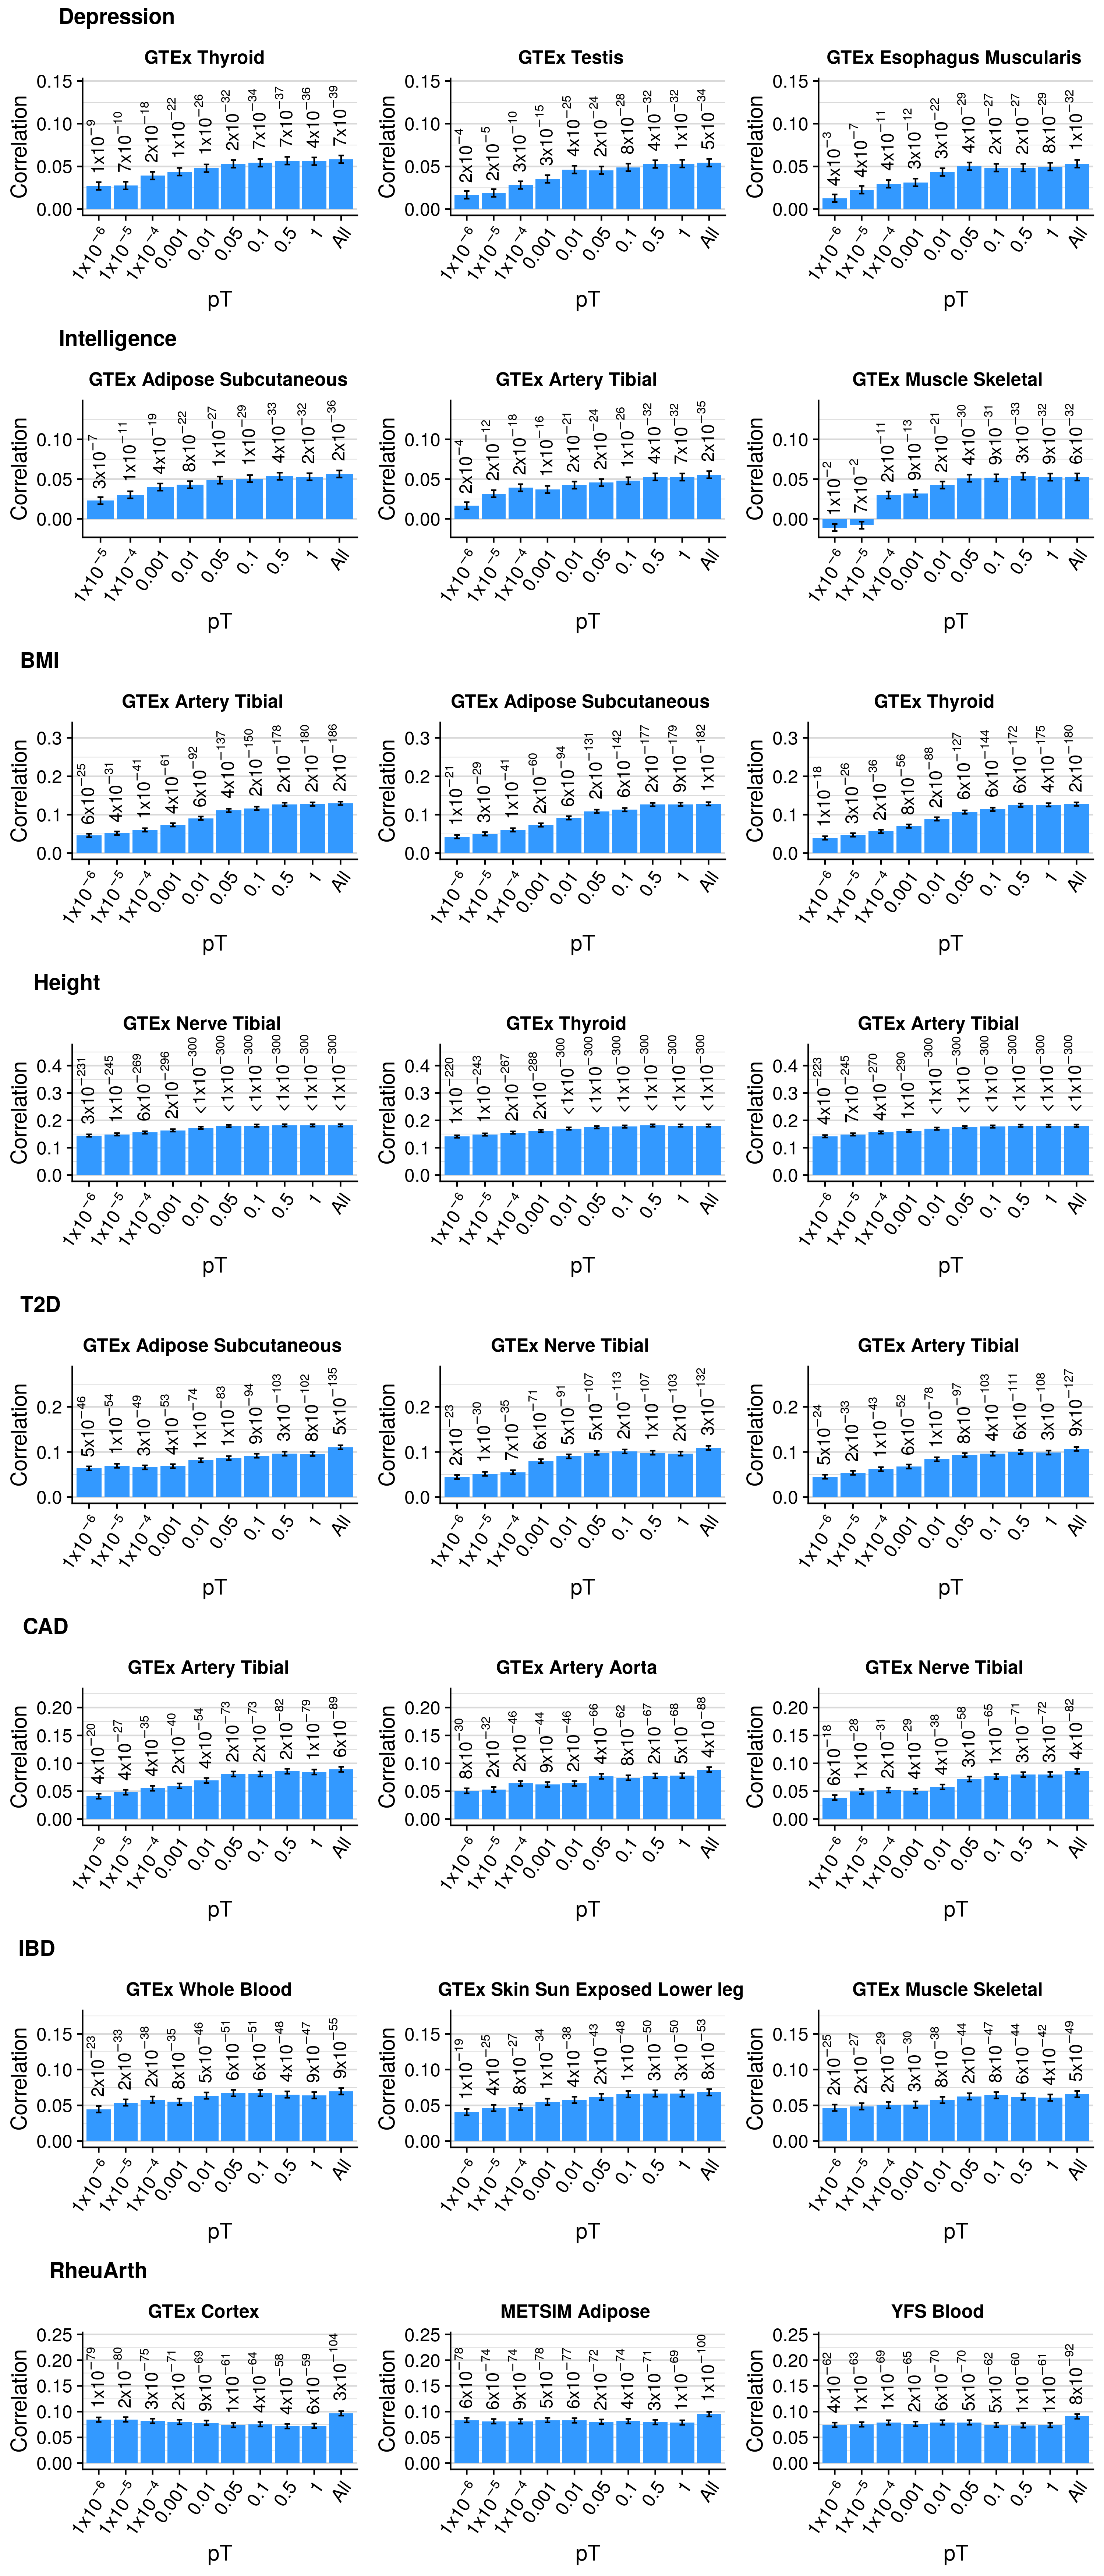
Predictive utility: R y-axis
| Phenotype | Weight | Model | R (SE) |
|---|---|---|---|
| Depression | Adipose_Subcutaneous | 1e.06 | 0.023 (0.004) |
| Depression | Adipose_Subcutaneous | 1e.05 | 0.022 (0.004) |
| Depression | Adipose_Subcutaneous | 1e.04 | 0.028 (0.004) |
| Depression | Adipose_Subcutaneous | 0.001 | 0.031 (0.004) |
| Depression | Adipose_Subcutaneous | 0.01 | 0.038 (0.004) |
| Depression | Adipose_Subcutaneous | 0.05 | 0.046 (0.004) |
| Depression | Adipose_Subcutaneous | 0.1 | 0.046 (0.004) |
| Depression | Adipose_Subcutaneous | 0.5 | 0.048 (0.004) |
| Depression | Adipose_Subcutaneous | 1 | 0.048 (0.004) |
| Depression | Adipose_Subcutaneous | All | 0.05 (0.004) |
| Depression | Adipose_Visceral_Omentum | 1e.06 | 0.008 (0.004) |
| Depression | Adipose_Visceral_Omentum | 1e.05 | 0.012 (0.004) |
| Depression | Adipose_Visceral_Omentum | 1e.04 | 0.02 (0.004) |
| Depression | Adipose_Visceral_Omentum | 0.001 | 0.021 (0.004) |
| Depression | Adipose_Visceral_Omentum | 0.01 | 0.033 (0.004) |
| Depression | Adipose_Visceral_Omentum | 0.05 | 0.04 (0.004) |
| Depression | Adipose_Visceral_Omentum | 0.1 | 0.041 (0.004) |
| Depression | Adipose_Visceral_Omentum | 0.5 | 0.043 (0.004) |
| Depression | Adipose_Visceral_Omentum | 1 | 0.043 (0.004) |
| Depression | Adipose_Visceral_Omentum | All | 0.043 (0.004) |
| Depression | Adrenal_Gland | 1e.06 | 0.011 (0.004) |
| Depression | Adrenal_Gland | 1e.05 | 0.017 (0.004) |
| Depression | Adrenal_Gland | 1e.04 | 0.026 (0.004) |
| Depression | Adrenal_Gland | 0.001 | 0.036 (0.004) |
| Depression | Adrenal_Gland | 0.01 | 0.045 (0.004) |
| Depression | Adrenal_Gland | 0.05 | 0.049 (0.004) |
| Depression | Adrenal_Gland | 0.1 | 0.048 (0.004) |
| Depression | Adrenal_Gland | 0.5 | 0.044 (0.004) |
| Depression | Adrenal_Gland | 1 | 0.046 (0.004) |
| Depression | Adrenal_Gland | All | 0.049 (0.004) |
| Depression | Artery_Aorta | 1e.06 | 0.021 (0.004) |
| Depression | Artery_Aorta | 1e.05 | 0.023 (0.004) |
| Depression | Artery_Aorta | 1e.04 | 0.031 (0.004) |
| Depression | Artery_Aorta | 0.001 | 0.031 (0.004) |
| Depression | Artery_Aorta | 0.01 | 0.039 (0.004) |
| Depression | Artery_Aorta | 0.05 | 0.046 (0.004) |
| Depression | Artery_Aorta | 0.1 | 0.047 (0.004) |
| Depression | Artery_Aorta | 0.5 | 0.047 (0.004) |
| Depression | Artery_Aorta | 1 | 0.047 (0.004) |
| Depression | Artery_Aorta | All | 0.051 (0.004) |
| Depression | Artery_Coronary | 1e.06 | 0.008 (0.004) |
| Depression | Artery_Coronary | 1e.05 | 0.012 (0.004) |
| Depression | Artery_Coronary | 1e.04 | 0.019 (0.004) |
| Depression | Artery_Coronary | 0.001 | 0.023 (0.004) |
| Depression | Artery_Coronary | 0.01 | 0.031 (0.004) |
| Depression | Artery_Coronary | 0.05 | 0.033 (0.004) |
| Depression | Artery_Coronary | 0.1 | 0.035 (0.004) |
| Depression | Artery_Coronary | 0.5 | 0.036 (0.004) |
| Depression | Artery_Coronary | 1 | 0.036 (0.004) |
| Depression | Artery_Coronary | All | 0.035 (0.004) |
| Depression | Artery_Tibial | 1e.06 | 0.012 (0.004) |
| Depression | Artery_Tibial | 1e.05 | 0.027 (0.004) |
| Depression | Artery_Tibial | 1e.04 | 0.03 (0.004) |
| Depression | Artery_Tibial | 0.001 | 0.034 (0.004) |
| Depression | Artery_Tibial | 0.01 | 0.038 (0.004) |
| Depression | Artery_Tibial | 0.05 | 0.046 (0.004) |
| Depression | Artery_Tibial | 0.1 | 0.047 (0.004) |
| Depression | Artery_Tibial | 0.5 | 0.048 (0.004) |
| Depression | Artery_Tibial | 1 | 0.049 (0.004) |
| Depression | Artery_Tibial | All | 0.05 (0.004) |
| Depression | Brain_Amygdala | 1e.06 | 0.013 (0.004) |
| Depression | Brain_Amygdala | 1e.05 | 0.017 (0.004) |
| Depression | Brain_Amygdala | 1e.04 | 0.022 (0.004) |
| Depression | Brain_Amygdala | 0.001 | 0.024 (0.004) |
| Depression | Brain_Amygdala | 0.01 | 0.032 (0.004) |
| Depression | Brain_Amygdala | 0.05 | 0.034 (0.004) |
| Depression | Brain_Amygdala | 0.1 | 0.033 (0.004) |
| Depression | Brain_Amygdala | 0.5 | 0.033 (0.004) |
| Depression | Brain_Amygdala | 1 | 0.033 (0.004) |
| Depression | Brain_Amygdala | All | 0.034 (0.004) |
| Depression | Brain_Anterior_cingulate_cortex_BA24 | 1e.06 | 0.013 (0.004) |
| Depression | Brain_Anterior_cingulate_cortex_BA24 | 1e.05 | 0.013 (0.004) |
| Depression | Brain_Anterior_cingulate_cortex_BA24 | 1e.04 | 0.02 (0.004) |
| Depression | Brain_Anterior_cingulate_cortex_BA24 | 0.001 | 0.026 (0.004) |
| Depression | Brain_Anterior_cingulate_cortex_BA24 | 0.01 | 0.035 (0.004) |
| Depression | Brain_Anterior_cingulate_cortex_BA24 | 0.05 | 0.036 (0.004) |
| Depression | Brain_Anterior_cingulate_cortex_BA24 | 0.1 | 0.038 (0.004) |
| Depression | Brain_Anterior_cingulate_cortex_BA24 | 0.5 | 0.038 (0.004) |
| Depression | Brain_Anterior_cingulate_cortex_BA24 | 1 | 0.038 (0.004) |
| Depression | Brain_Anterior_cingulate_cortex_BA24 | All | 0.04 (0.004) |
| Depression | Brain_Caudate_basal_ganglia | 1e.06 | 0.02 (0.004) |
| Depression | Brain_Caudate_basal_ganglia | 1e.05 | 0.019 (0.004) |
| Depression | Brain_Caudate_basal_ganglia | 1e.04 | 0.025 (0.004) |
| Depression | Brain_Caudate_basal_ganglia | 0.001 | 0.025 (0.004) |
| Depression | Brain_Caudate_basal_ganglia | 0.01 | 0.033 (0.004) |
| Depression | Brain_Caudate_basal_ganglia | 0.05 | 0.033 (0.004) |
| Depression | Brain_Caudate_basal_ganglia | 0.1 | 0.034 (0.004) |
| Depression | Brain_Caudate_basal_ganglia | 0.5 | 0.038 (0.004) |
| Depression | Brain_Caudate_basal_ganglia | 1 | 0.038 (0.004) |
| Depression | Brain_Caudate_basal_ganglia | All | 0.041 (0.004) |
| Depression | Brain_Cerebellar_Hemisphere | 1e.06 | 0.025 (0.004) |
| Depression | Brain_Cerebellar_Hemisphere | 1e.05 | 0.026 (0.004) |
| Depression | Brain_Cerebellar_Hemisphere | 1e.04 | 0.029 (0.004) |
| Depression | Brain_Cerebellar_Hemisphere | 0.001 | 0.031 (0.004) |
| Depression | Brain_Cerebellar_Hemisphere | 0.01 | 0.037 (0.004) |
| Depression | Brain_Cerebellar_Hemisphere | 0.05 | 0.039 (0.004) |
| Depression | Brain_Cerebellar_Hemisphere | 0.1 | 0.043 (0.004) |
| Depression | Brain_Cerebellar_Hemisphere | 0.5 | 0.045 (0.004) |
| Depression | Brain_Cerebellar_Hemisphere | 1 | 0.045 (0.004) |
| Depression | Brain_Cerebellar_Hemisphere | All | 0.047 (0.004) |
| Depression | Brain_Cerebellum | 1e.06 | 0.021 (0.004) |
| Depression | Brain_Cerebellum | 1e.05 | 0.018 (0.004) |
| Depression | Brain_Cerebellum | 1e.04 | 0.028 (0.004) |
| Depression | Brain_Cerebellum | 0.001 | 0.03 (0.004) |
| Depression | Brain_Cerebellum | 0.01 | 0.03 (0.004) |
| Depression | Brain_Cerebellum | 0.05 | 0.04 (0.004) |
| Depression | Brain_Cerebellum | 0.1 | 0.041 (0.004) |
| Depression | Brain_Cerebellum | 0.5 | 0.042 (0.004) |
| Depression | Brain_Cerebellum | 1 | 0.043 (0.004) |
| Depression | Brain_Cerebellum | All | 0.044 (0.004) |
| Depression | Brain_Cortex | 1e.06 | 0.017 (0.004) |
| Depression | Brain_Cortex | 1e.05 | 0.018 (0.004) |
| Depression | Brain_Cortex | 1e.04 | 0.02 (0.004) |
| Depression | Brain_Cortex | 0.001 | 0.03 (0.004) |
| Depression | Brain_Cortex | 0.01 | 0.033 (0.004) |
| Depression | Brain_Cortex | 0.05 | 0.039 (0.004) |
| Depression | Brain_Cortex | 0.1 | 0.04 (0.004) |
| Depression | Brain_Cortex | 0.5 | 0.048 (0.004) |
| Depression | Brain_Cortex | 1 | 0.048 (0.004) |
| Depression | Brain_Cortex | All | 0.048 (0.004) |
| Depression | Brain_Frontal_Cortex_BA9 | 1e.06 | 0.008 (0.004) |
| Depression | Brain_Frontal_Cortex_BA9 | 1e.05 | 0.008 (0.004) |
| Depression | Brain_Frontal_Cortex_BA9 | 1e.04 | 0.019 (0.004) |
| Depression | Brain_Frontal_Cortex_BA9 | 0.001 | 0.026 (0.004) |
| Depression | Brain_Frontal_Cortex_BA9 | 0.01 | 0.035 (0.004) |
| Depression | Brain_Frontal_Cortex_BA9 | 0.05 | 0.036 (0.004) |
| Depression | Brain_Frontal_Cortex_BA9 | 0.1 | 0.038 (0.004) |
| Depression | Brain_Frontal_Cortex_BA9 | 0.5 | 0.036 (0.004) |
| Depression | Brain_Frontal_Cortex_BA9 | 1 | 0.036 (0.004) |
| Depression | Brain_Frontal_Cortex_BA9 | All | 0.038 (0.004) |
| Depression | Brain_Hippocampus | 1e.06 | 0.016 (0.004) |
| Depression | Brain_Hippocampus | 1e.05 | 0.02 (0.004) |
| Depression | Brain_Hippocampus | 1e.04 | 0.025 (0.004) |
| Depression | Brain_Hippocampus | 0.001 | 0.029 (0.004) |
| Depression | Brain_Hippocampus | 0.01 | 0.032 (0.004) |
| Depression | Brain_Hippocampus | 0.05 | 0.031 (0.004) |
| Depression | Brain_Hippocampus | 0.1 | 0.031 (0.004) |
| Depression | Brain_Hippocampus | 0.5 | 0.032 (0.004) |
| Depression | Brain_Hippocampus | 1 | 0.033 (0.004) |
| Depression | Brain_Hippocampus | All | 0.037 (0.004) |
| Depression | Brain_Hypothalamus | 1e.06 | 0.002 (0.004) |
| Depression | Brain_Hypothalamus | 1e.05 | 0.011 (0.004) |
| Depression | Brain_Hypothalamus | 1e.04 | 0.015 (0.004) |
| Depression | Brain_Hypothalamus | 0.001 | 0.02 (0.004) |
| Depression | Brain_Hypothalamus | 0.01 | 0.031 (0.004) |
| Depression | Brain_Hypothalamus | 0.05 | 0.033 (0.004) |
| Depression | Brain_Hypothalamus | 0.1 | 0.035 (0.004) |
| Depression | Brain_Hypothalamus | 0.5 | 0.036 (0.004) |
| Depression | Brain_Hypothalamus | 1 | 0.037 (0.004) |
| Depression | Brain_Hypothalamus | All | 0.037 (0.004) |
| Depression | Brain_Nucleus_accumbens_basal_ganglia | 1e.06 | 0.016 (0.004) |
| Depression | Brain_Nucleus_accumbens_basal_ganglia | 1e.05 | 0.014 (0.004) |
| Depression | Brain_Nucleus_accumbens_basal_ganglia | 1e.04 | 0.015 (0.004) |
| Depression | Brain_Nucleus_accumbens_basal_ganglia | 0.001 | 0.023 (0.004) |
| Depression | Brain_Nucleus_accumbens_basal_ganglia | 0.01 | 0.033 (0.004) |
| Depression | Brain_Nucleus_accumbens_basal_ganglia | 0.05 | 0.033 (0.004) |
| Depression | Brain_Nucleus_accumbens_basal_ganglia | 0.1 | 0.035 (0.004) |
| Depression | Brain_Nucleus_accumbens_basal_ganglia | 0.5 | 0.036 (0.004) |
| Depression | Brain_Nucleus_accumbens_basal_ganglia | 1 | 0.037 (0.004) |
| Depression | Brain_Nucleus_accumbens_basal_ganglia | All | 0.039 (0.004) |
| Depression | Brain_Putamen_basal_ganglia | 1e.06 | 0.017 (0.004) |
| Depression | Brain_Putamen_basal_ganglia | 1e.05 | 0.017 (0.004) |
| Depression | Brain_Putamen_basal_ganglia | 1e.04 | 0.018 (0.004) |
| Depression | Brain_Putamen_basal_ganglia | 0.001 | 0.026 (0.004) |
| Depression | Brain_Putamen_basal_ganglia | 0.01 | 0.033 (0.004) |
| Depression | Brain_Putamen_basal_ganglia | 0.05 | 0.035 (0.004) |
| Depression | Brain_Putamen_basal_ganglia | 0.1 | 0.039 (0.004) |
| Depression | Brain_Putamen_basal_ganglia | 0.5 | 0.039 (0.004) |
| Depression | Brain_Putamen_basal_ganglia | 1 | 0.039 (0.004) |
| Depression | Brain_Putamen_basal_ganglia | All | 0.04 (0.004) |
| Depression | Brain_Spinal_cord_cervical_c-1 | 1e.06 | 0.019 (0.004) |
| Depression | Brain_Spinal_cord_cervical_c-1 | 1e.05 | 0.015 (0.004) |
| Depression | Brain_Spinal_cord_cervical_c-1 | 1e.04 | 0.022 (0.004) |
| Depression | Brain_Spinal_cord_cervical_c-1 | 0.001 | 0.026 (0.004) |
| Depression | Brain_Spinal_cord_cervical_c-1 | 0.01 | 0.03 (0.004) |
| Depression | Brain_Spinal_cord_cervical_c-1 | 0.05 | 0.031 (0.004) |
| Depression | Brain_Spinal_cord_cervical_c-1 | 0.1 | 0.032 (0.004) |
| Depression | Brain_Spinal_cord_cervical_c-1 | 0.5 | 0.035 (0.004) |
| Depression | Brain_Spinal_cord_cervical_c-1 | 1 | 0.035 (0.004) |
| Depression | Brain_Spinal_cord_cervical_c-1 | All | 0.036 (0.004) |
| Depression | Brain_Substantia_nigra | 1e.06 | 0.006 (0.004) |
| Depression | Brain_Substantia_nigra | 1e.05 | 0.006 (0.004) |
| Depression | Brain_Substantia_nigra | 1e.04 | 0.017 (0.004) |
| Depression | Brain_Substantia_nigra | 0.001 | 0.02 (0.004) |
| Depression | Brain_Substantia_nigra | 0.01 | 0.028 (0.004) |
| Depression | Brain_Substantia_nigra | 0.05 | 0.031 (0.004) |
| Depression | Brain_Substantia_nigra | 0.1 | 0.03 (0.004) |
| Depression | Brain_Substantia_nigra | 0.5 | 0.031 (0.004) |
| Depression | Brain_Substantia_nigra | 1 | 0.031 (0.004) |
| Depression | Brain_Substantia_nigra | All | 0.033 (0.004) |
| Depression | Breast_Mammary_Tissue | 1e.06 | 0.013 (0.004) |
| Depression | Breast_Mammary_Tissue | 1e.05 | 0.015 (0.004) |
| Depression | Breast_Mammary_Tissue | 1e.04 | 0.017 (0.004) |
| Depression | Breast_Mammary_Tissue | 0.001 | 0.027 (0.004) |
| Depression | Breast_Mammary_Tissue | 0.01 | 0.036 (0.004) |
| Depression | Breast_Mammary_Tissue | 0.05 | 0.04 (0.004) |
| Depression | Breast_Mammary_Tissue | 0.1 | 0.04 (0.004) |
| Depression | Breast_Mammary_Tissue | 0.5 | 0.042 (0.004) |
| Depression | Breast_Mammary_Tissue | 1 | 0.042 (0.004) |
| Depression | Breast_Mammary_Tissue | All | 0.043 (0.004) |
| Depression | Cells_EBV-transformed_lymphocytes | 1e.06 | 0.014 (0.004) |
| Depression | Cells_EBV-transformed_lymphocytes | 1e.05 | 0.015 (0.004) |
| Depression | Cells_EBV-transformed_lymphocytes | 1e.04 | 0.013 (0.004) |
| Depression | Cells_EBV-transformed_lymphocytes | 0.001 | 0.021 (0.004) |
| Depression | Cells_EBV-transformed_lymphocytes | 0.01 | 0.025 (0.004) |
| Depression | Cells_EBV-transformed_lymphocytes | 0.05 | 0.032 (0.004) |
| Depression | Cells_EBV-transformed_lymphocytes | 0.1 | 0.034 (0.004) |
| Depression | Cells_EBV-transformed_lymphocytes | 0.5 | 0.041 (0.004) |
| Depression | Cells_EBV-transformed_lymphocytes | 1 | 0.041 (0.004) |
| Depression | Cells_EBV-transformed_lymphocytes | All | 0.041 (0.004) |
| Depression | Cells_Transformed_fibroblasts | 1e.06 | 0.01 (0.004) |
| Depression | Cells_Transformed_fibroblasts | 1e.05 | 0.014 (0.004) |
| Depression | Cells_Transformed_fibroblasts | 1e.04 | 0.022 (0.004) |
| Depression | Cells_Transformed_fibroblasts | 0.001 | 0.026 (0.004) |
| Depression | Cells_Transformed_fibroblasts | 0.01 | 0.035 (0.004) |
| Depression | Cells_Transformed_fibroblasts | 0.05 | 0.042 (0.004) |
| Depression | Cells_Transformed_fibroblasts | 0.1 | 0.043 (0.004) |
| Depression | Cells_Transformed_fibroblasts | 0.5 | 0.046 (0.004) |
| Depression | Cells_Transformed_fibroblasts | 1 | 0.047 (0.004) |
| Depression | Cells_Transformed_fibroblasts | All | 0.046 (0.004) |
| Depression | CMC.BRAIN.RNASEQ | 1e.06 | 0.012 (0.004) |
| Depression | CMC.BRAIN.RNASEQ | 1e.05 | 0.017 (0.004) |
| Depression | CMC.BRAIN.RNASEQ | 1e.04 | 0.029 (0.004) |
| Depression | CMC.BRAIN.RNASEQ | 0.001 | 0.031 (0.004) |
| Depression | CMC.BRAIN.RNASEQ | 0.01 | 0.038 (0.004) |
| Depression | CMC.BRAIN.RNASEQ | 0.05 | 0.046 (0.004) |
| Depression | CMC.BRAIN.RNASEQ | 0.1 | 0.048 (0.004) |
| Depression | CMC.BRAIN.RNASEQ | 0.5 | 0.052 (0.004) |
| Depression | CMC.BRAIN.RNASEQ | 1 | 0.052 (0.004) |
| Depression | CMC.BRAIN.RNASEQ | All | 0.051 (0.004) |
| Depression | CMC.BRAIN.RNASEQ_SPLICING | 1e.06 | -0.01 (0.004) |
| Depression | CMC.BRAIN.RNASEQ_SPLICING | 1e.05 | 0.003 (0.004) |
| Depression | CMC.BRAIN.RNASEQ_SPLICING | 1e.04 | 0.018 (0.004) |
| Depression | CMC.BRAIN.RNASEQ_SPLICING | 0.001 | 0.028 (0.004) |
| Depression | CMC.BRAIN.RNASEQ_SPLICING | 0.01 | 0.04 (0.004) |
| Depression | CMC.BRAIN.RNASEQ_SPLICING | 0.05 | 0.047 (0.004) |
| Depression | CMC.BRAIN.RNASEQ_SPLICING | 0.1 | 0.048 (0.004) |
| Depression | CMC.BRAIN.RNASEQ_SPLICING | 0.5 | 0.045 (0.004) |
| Depression | CMC.BRAIN.RNASEQ_SPLICING | 1 | 0.047 (0.004) |
| Depression | CMC.BRAIN.RNASEQ_SPLICING | All | 0.048 (0.004) |
| Depression | Colon_Sigmoid | 1e.06 | 0.001 (0.004) |
| Depression | Colon_Sigmoid | 1e.05 | 0.003 (0.004) |
| Depression | Colon_Sigmoid | 1e.04 | 0.018 (0.004) |
| Depression | Colon_Sigmoid | 0.001 | 0.024 (0.004) |
| Depression | Colon_Sigmoid | 0.01 | 0.036 (0.004) |
| Depression | Colon_Sigmoid | 0.05 | 0.04 (0.004) |
| Depression | Colon_Sigmoid | 0.1 | 0.041 (0.004) |
| Depression | Colon_Sigmoid | 0.5 | 0.043 (0.004) |
| Depression | Colon_Sigmoid | 1 | 0.043 (0.004) |
| Depression | Colon_Sigmoid | All | 0.044 (0.004) |
| Depression | Colon_Transverse | 1e.06 | 0.005 (0.004) |
| Depression | Colon_Transverse | 1e.05 | 0.001 (0.004) |
| Depression | Colon_Transverse | 1e.04 | 0.024 (0.004) |
| Depression | Colon_Transverse | 0.001 | 0.036 (0.004) |
| Depression | Colon_Transverse | 0.01 | 0.038 (0.004) |
| Depression | Colon_Transverse | 0.05 | 0.041 (0.004) |
| Depression | Colon_Transverse | 0.1 | 0.044 (0.004) |
| Depression | Colon_Transverse | 0.5 | 0.047 (0.004) |
| Depression | Colon_Transverse | 1 | 0.047 (0.004) |
| Depression | Colon_Transverse | All | 0.05 (0.004) |
| Depression | Esophagus_Gastroesophageal_Junction | 1e.06 | 0.005 (0.004) |
| Depression | Esophagus_Gastroesophageal_Junction | 1e.05 | 0.014 (0.004) |
| Depression | Esophagus_Gastroesophageal_Junction | 1e.04 | 0.028 (0.004) |
| Depression | Esophagus_Gastroesophageal_Junction | 0.001 | 0.028 (0.004) |
| Depression | Esophagus_Gastroesophageal_Junction | 0.01 | 0.032 (0.004) |
| Depression | Esophagus_Gastroesophageal_Junction | 0.05 | 0.035 (0.004) |
| Depression | Esophagus_Gastroesophageal_Junction | 0.1 | 0.036 (0.004) |
| Depression | Esophagus_Gastroesophageal_Junction | 0.5 | 0.042 (0.004) |
| Depression | Esophagus_Gastroesophageal_Junction | 1 | 0.042 (0.004) |
| Depression | Esophagus_Gastroesophageal_Junction | All | 0.043 (0.004) |
| Depression | Esophagus_Mucosa | 1e.06 | 0.009 (0.004) |
| Depression | Esophagus_Mucosa | 1e.05 | 0.016 (0.004) |
| Depression | Esophagus_Mucosa | 1e.04 | 0.023 (0.004) |
| Depression | Esophagus_Mucosa | 0.001 | 0.033 (0.004) |
| Depression | Esophagus_Mucosa | 0.01 | 0.043 (0.004) |
| Depression | Esophagus_Mucosa | 0.05 | 0.043 (0.004) |
| Depression | Esophagus_Mucosa | 0.1 | 0.044 (0.004) |
| Depression | Esophagus_Mucosa | 0.5 | 0.049 (0.004) |
| Depression | Esophagus_Mucosa | 1 | 0.049 (0.004) |
| Depression | Esophagus_Mucosa | All | 0.05 (0.004) |
| Depression | Esophagus_Muscularis | 1e.06 | 0.013 (0.004) |
| Depression | Esophagus_Muscularis | 1e.05 | 0.023 (0.004) |
| Depression | Esophagus_Muscularis | 1e.04 | 0.03 (0.004) |
| Depression | Esophagus_Muscularis | 0.001 | 0.031 (0.004) |
| Depression | Esophagus_Muscularis | 0.01 | 0.043 (0.004) |
| Depression | Esophagus_Muscularis | 0.05 | 0.05 (0.004) |
| Depression | Esophagus_Muscularis | 0.1 | 0.049 (0.004) |
| Depression | Esophagus_Muscularis | 0.5 | 0.049 (0.004) |
| Depression | Esophagus_Muscularis | 1 | 0.05 (0.004) |
| Depression | Esophagus_Muscularis | All | 0.053 (0.004) |
| Depression | Heart_Atrial_Appendage | 1e.06 | 0.012 (0.004) |
| Depression | Heart_Atrial_Appendage | 1e.05 | 0.022 (0.004) |
| Depression | Heart_Atrial_Appendage | 1e.04 | 0.027 (0.004) |
| Depression | Heart_Atrial_Appendage | 0.001 | 0.031 (0.004) |
| Depression | Heart_Atrial_Appendage | 0.01 | 0.033 (0.004) |
| Depression | Heart_Atrial_Appendage | 0.05 | 0.039 (0.004) |
| Depression | Heart_Atrial_Appendage | 0.1 | 0.04 (0.004) |
| Depression | Heart_Atrial_Appendage | 0.5 | 0.043 (0.004) |
| Depression | Heart_Atrial_Appendage | 1 | 0.044 (0.004) |
| Depression | Heart_Atrial_Appendage | All | 0.045 (0.004) |
| Depression | Heart_Left_Ventricle | 1e.06 | 0.011 (0.004) |
| Depression | Heart_Left_Ventricle | 1e.05 | 0.013 (0.004) |
| Depression | Heart_Left_Ventricle | 1e.04 | 0.022 (0.004) |
| Depression | Heart_Left_Ventricle | 0.001 | 0.026 (0.004) |
| Depression | Heart_Left_Ventricle | 0.01 | 0.035 (0.004) |
| Depression | Heart_Left_Ventricle | 0.05 | 0.039 (0.004) |
| Depression | Heart_Left_Ventricle | 0.1 | 0.036 (0.004) |
| Depression | Heart_Left_Ventricle | 0.5 | 0.043 (0.004) |
| Depression | Heart_Left_Ventricle | 1 | 0.043 (0.004) |
| Depression | Heart_Left_Ventricle | All | 0.043 (0.004) |
| Depression | Liver | 1e.06 | 0.012 (0.004) |
| Depression | Liver | 1e.05 | 0.017 (0.004) |
| Depression | Liver | 1e.04 | 0.017 (0.004) |
| Depression | Liver | 0.001 | 0.021 (0.004) |
| Depression | Liver | 0.01 | 0.027 (0.004) |
| Depression | Liver | 0.05 | 0.032 (0.004) |
| Depression | Liver | 0.1 | 0.033 (0.004) |
| Depression | Liver | 0.5 | 0.033 (0.004) |
| Depression | Liver | 1 | 0.034 (0.004) |
| Depression | Liver | All | 0.033 (0.004) |
| Depression | Lung | 1e.06 | 0.018 (0.004) |
| Depression | Lung | 1e.05 | 0.027 (0.004) |
| Depression | Lung | 1e.04 | 0.029 (0.004) |
| Depression | Lung | 0.001 | 0.037 (0.004) |
| Depression | Lung | 0.01 | 0.04 (0.004) |
| Depression | Lung | 0.05 | 0.048 (0.004) |
| Depression | Lung | 0.1 | 0.05 (0.004) |
| Depression | Lung | 0.5 | 0.05 (0.004) |
| Depression | Lung | 1 | 0.05 (0.004) |
| Depression | Lung | All | 0.052 (0.004) |
| Depression | METSIM.ADIPOSE.RNASEQ | 1e.06 | 0.016 (0.004) |
| Depression | METSIM.ADIPOSE.RNASEQ | 1e.05 | 0.014 (0.004) |
| Depression | METSIM.ADIPOSE.RNASEQ | 1e.04 | 0.024 (0.004) |
| Depression | METSIM.ADIPOSE.RNASEQ | 0.001 | 0.025 (0.004) |
| Depression | METSIM.ADIPOSE.RNASEQ | 0.01 | 0.036 (0.004) |
| Depression | METSIM.ADIPOSE.RNASEQ | 0.05 | 0.039 (0.004) |
| Depression | METSIM.ADIPOSE.RNASEQ | 0.1 | 0.041 (0.004) |
| Depression | METSIM.ADIPOSE.RNASEQ | 0.5 | 0.041 (0.004) |
| Depression | METSIM.ADIPOSE.RNASEQ | 1 | 0.041 (0.004) |
| Depression | METSIM.ADIPOSE.RNASEQ | All | 0.043 (0.004) |
| Depression | Minor_Salivary_Gland | 1e.06 | 0.014 (0.004) |
| Depression | Minor_Salivary_Gland | 1e.05 | 0.019 (0.004) |
| Depression | Minor_Salivary_Gland | 1e.04 | 0.012 (0.004) |
| Depression | Minor_Salivary_Gland | 0.001 | 0.022 (0.004) |
| Depression | Minor_Salivary_Gland | 0.01 | 0.024 (0.004) |
| Depression | Minor_Salivary_Gland | 0.05 | 0.022 (0.004) |
| Depression | Minor_Salivary_Gland | 0.1 | 0.023 (0.004) |
| Depression | Minor_Salivary_Gland | 0.5 | 0.028 (0.004) |
| Depression | Minor_Salivary_Gland | 1 | 0.027 (0.004) |
| Depression | Minor_Salivary_Gland | All | 0.03 (0.004) |
| Depression | Muscle_Skeletal | 1e.06 | -0.013 (0.004) |
| Depression | Muscle_Skeletal | 1e.05 | 0.019 (0.004) |
| Depression | Muscle_Skeletal | 1e.04 | 0.025 (0.004) |
| Depression | Muscle_Skeletal | 0.001 | 0.028 (0.004) |
| Depression | Muscle_Skeletal | 0.01 | 0.033 (0.004) |
| Depression | Muscle_Skeletal | 0.05 | 0.038 (0.004) |
| Depression | Muscle_Skeletal | 0.1 | 0.041 (0.004) |
| Depression | Muscle_Skeletal | 0.5 | 0.041 (0.004) |
| Depression | Muscle_Skeletal | 1 | 0.041 (0.004) |
| Depression | Muscle_Skeletal | All | 0.041 (0.004) |
| Depression | Nerve_Tibial | 1e.06 | 0.011 (0.004) |
| Depression | Nerve_Tibial | 1e.05 | 0.021 (0.004) |
| Depression | Nerve_Tibial | 1e.04 | 0.03 (0.004) |
| Depression | Nerve_Tibial | 0.001 | 0.039 (0.004) |
| Depression | Nerve_Tibial | 0.01 | 0.042 (0.004) |
| Depression | Nerve_Tibial | 0.05 | 0.046 (0.004) |
| Depression | Nerve_Tibial | 0.1 | 0.046 (0.004) |
| Depression | Nerve_Tibial | 0.5 | 0.049 (0.004) |
| Depression | Nerve_Tibial | 1 | 0.049 (0.004) |
| Depression | Nerve_Tibial | All | 0.052 (0.004) |
| Depression | NTR.BLOOD.RNAARR | 1e.06 | -0.004 (0.004) |
| Depression | NTR.BLOOD.RNAARR | 1e.05 | 0.01 (0.004) |
| Depression | NTR.BLOOD.RNAARR | 1e.04 | 0.012 (0.004) |
| Depression | NTR.BLOOD.RNAARR | 0.001 | 0.019 (0.004) |
| Depression | NTR.BLOOD.RNAARR | 0.01 | 0.026 (0.004) |
| Depression | NTR.BLOOD.RNAARR | 0.05 | 0.03 (0.004) |
| Depression | NTR.BLOOD.RNAARR | 0.1 | 0.033 (0.004) |
| Depression | NTR.BLOOD.RNAARR | 0.5 | 0.037 (0.004) |
| Depression | NTR.BLOOD.RNAARR | 1 | 0.037 (0.004) |
| Depression | NTR.BLOOD.RNAARR | All | 0.036 (0.004) |
| Depression | Ovary | 1e.06 | 0.017 (0.004) |
| Depression | Ovary | 1e.05 | 0.023 (0.004) |
| Depression | Ovary | 1e.04 | 0.027 (0.004) |
| Depression | Ovary | 0.001 | 0.026 (0.004) |
| Depression | Ovary | 0.01 | 0.032 (0.004) |
| Depression | Ovary | 0.05 | 0.031 (0.004) |
| Depression | Ovary | 0.1 | 0.032 (0.004) |
| Depression | Ovary | 0.5 | 0.034 (0.004) |
| Depression | Ovary | 1 | 0.035 (0.004) |
| Depression | Ovary | All | 0.04 (0.004) |
| Depression | Pancreas | 1e.06 | 0.017 (0.004) |
| Depression | Pancreas | 1e.05 | 0.021 (0.004) |
| Depression | Pancreas | 1e.04 | 0.033 (0.004) |
| Depression | Pancreas | 0.001 | 0.036 (0.004) |
| Depression | Pancreas | 0.01 | 0.041 (0.004) |
| Depression | Pancreas | 0.05 | 0.043 (0.004) |
| Depression | Pancreas | 0.1 | 0.044 (0.004) |
| Depression | Pancreas | 0.5 | 0.045 (0.004) |
| Depression | Pancreas | 1 | 0.044 (0.004) |
| Depression | Pancreas | All | 0.048 (0.004) |
| Depression | Pituitary | 1e.06 | 0.013 (0.004) |
| Depression | Pituitary | 1e.05 | 0.013 (0.004) |
| Depression | Pituitary | 1e.04 | 0.024 (0.004) |
| Depression | Pituitary | 0.001 | 0.027 (0.004) |
| Depression | Pituitary | 0.01 | 0.031 (0.004) |
| Depression | Pituitary | 0.05 | 0.035 (0.004) |
| Depression | Pituitary | 0.1 | 0.033 (0.004) |
| Depression | Pituitary | 0.5 | 0.037 (0.004) |
| Depression | Pituitary | 1 | 0.037 (0.004) |
| Depression | Pituitary | All | 0.037 (0.004) |
| Depression | Prostate | 1e.06 | 0.011 (0.004) |
| Depression | Prostate | 1e.05 | 0.011 (0.004) |
| Depression | Prostate | 1e.04 | 0.015 (0.004) |
| Depression | Prostate | 0.001 | 0.02 (0.004) |
| Depression | Prostate | 0.01 | 0.025 (0.004) |
| Depression | Prostate | 0.05 | 0.027 (0.004) |
| Depression | Prostate | 0.1 | 0.027 (0.004) |
| Depression | Prostate | 0.5 | 0.029 (0.004) |
| Depression | Prostate | 1 | 0.031 (0.004) |
| Depression | Prostate | All | 0.031 (0.004) |
| Depression | Skin_Not_Sun_Exposed_Suprapubic | 1e.06 | 0.011 (0.004) |
| Depression | Skin_Not_Sun_Exposed_Suprapubic | 1e.05 | 0.015 (0.004) |
| Depression | Skin_Not_Sun_Exposed_Suprapubic | 1e.04 | 0.022 (0.004) |
| Depression | Skin_Not_Sun_Exposed_Suprapubic | 0.001 | 0.034 (0.004) |
| Depression | Skin_Not_Sun_Exposed_Suprapubic | 0.01 | 0.041 (0.004) |
| Depression | Skin_Not_Sun_Exposed_Suprapubic | 0.05 | 0.044 (0.004) |
| Depression | Skin_Not_Sun_Exposed_Suprapubic | 0.1 | 0.046 (0.004) |
| Depression | Skin_Not_Sun_Exposed_Suprapubic | 0.5 | 0.05 (0.004) |
| Depression | Skin_Not_Sun_Exposed_Suprapubic | 1 | 0.051 (0.004) |
| Depression | Skin_Not_Sun_Exposed_Suprapubic | All | 0.051 (0.004) |
| Depression | Skin_Sun_Exposed_Lower_leg | 1e.06 | 0.008 (0.004) |
| Depression | Skin_Sun_Exposed_Lower_leg | 1e.05 | 0.015 (0.004) |
| Depression | Skin_Sun_Exposed_Lower_leg | 1e.04 | 0.028 (0.004) |
| Depression | Skin_Sun_Exposed_Lower_leg | 0.001 | 0.035 (0.004) |
| Depression | Skin_Sun_Exposed_Lower_leg | 0.01 | 0.04 (0.004) |
| Depression | Skin_Sun_Exposed_Lower_leg | 0.05 | 0.044 (0.004) |
| Depression | Skin_Sun_Exposed_Lower_leg | 0.1 | 0.045 (0.004) |
| Depression | Skin_Sun_Exposed_Lower_leg | 0.5 | 0.048 (0.004) |
| Depression | Skin_Sun_Exposed_Lower_leg | 1 | 0.048 (0.004) |
| Depression | Skin_Sun_Exposed_Lower_leg | All | 0.049 (0.004) |
| Depression | Small_Intestine_Terminal_Ileum | 1e.06 | 0.004 (0.004) |
| Depression | Small_Intestine_Terminal_Ileum | 1e.05 | 0.016 (0.004) |
| Depression | Small_Intestine_Terminal_Ileum | 1e.04 | 0.02 (0.004) |
| Depression | Small_Intestine_Terminal_Ileum | 0.001 | 0.026 (0.004) |
| Depression | Small_Intestine_Terminal_Ileum | 0.01 | 0.032 (0.004) |
| Depression | Small_Intestine_Terminal_Ileum | 0.05 | 0.036 (0.004) |
| Depression | Small_Intestine_Terminal_Ileum | 0.1 | 0.036 (0.004) |
| Depression | Small_Intestine_Terminal_Ileum | 0.5 | 0.04 (0.004) |
| Depression | Small_Intestine_Terminal_Ileum | 1 | 0.04 (0.004) |
| Depression | Small_Intestine_Terminal_Ileum | All | 0.04 (0.004) |
| Depression | Spleen | 1e.06 | 0.017 (0.004) |
| Depression | Spleen | 1e.05 | 0.021 (0.004) |
| Depression | Spleen | 1e.04 | 0.026 (0.004) |
| Depression | Spleen | 0.001 | 0.031 (0.004) |
| Depression | Spleen | 0.01 | 0.033 (0.004) |
| Depression | Spleen | 0.05 | 0.039 (0.004) |
| Depression | Spleen | 0.1 | 0.039 (0.004) |
| Depression | Spleen | 0.5 | 0.04 (0.004) |
| Depression | Spleen | 1 | 0.041 (0.004) |
| Depression | Spleen | All | 0.043 (0.004) |
| Depression | Stomach | 1e.06 | 0.015 (0.004) |
| Depression | Stomach | 1e.05 | 0.025 (0.004) |
| Depression | Stomach | 1e.04 | 0.024 (0.004) |
| Depression | Stomach | 0.001 | 0.03 (0.004) |
| Depression | Stomach | 0.01 | 0.034 (0.004) |
| Depression | Stomach | 0.05 | 0.038 (0.004) |
| Depression | Stomach | 0.1 | 0.038 (0.004) |
| Depression | Stomach | 0.5 | 0.038 (0.004) |
| Depression | Stomach | 1 | 0.038 (0.004) |
| Depression | Stomach | All | 0.044 (0.004) |
| Depression | Testis | 1e.06 | 0.017 (0.004) |
| Depression | Testis | 1e.05 | 0.019 (0.004) |
| Depression | Testis | 1e.04 | 0.028 (0.004) |
| Depression | Testis | 0.001 | 0.035 (0.004) |
| Depression | Testis | 0.01 | 0.046 (0.004) |
| Depression | Testis | 0.05 | 0.046 (0.004) |
| Depression | Testis | 0.1 | 0.049 (0.004) |
| Depression | Testis | 0.5 | 0.053 (0.004) |
| Depression | Testis | 1 | 0.053 (0.004) |
| Depression | Testis | All | 0.054 (0.004) |
| Depression | Thyroid | 1e.06 | 0.027 (0.004) |
| Depression | Thyroid | 1e.05 | 0.028 (0.004) |
| Depression | Thyroid | 1e.04 | 0.039 (0.004) |
| Depression | Thyroid | 0.001 | 0.044 (0.004) |
| Depression | Thyroid | 0.01 | 0.048 (0.004) |
| Depression | Thyroid | 0.05 | 0.053 (0.004) |
| Depression | Thyroid | 0.1 | 0.054 (0.004) |
| Depression | Thyroid | 0.5 | 0.057 (0.004) |
| Depression | Thyroid | 1 | 0.056 (0.004) |
| Depression | Thyroid | All | 0.058 (0.004) |
| Depression | Uterus | 1e.05 | 0.018 (0.004) |
| Depression | Uterus | 1e.04 | 0.017 (0.004) |
| Depression | Uterus | 0.001 | 0.021 (0.004) |
| Depression | Uterus | 0.01 | 0.026 (0.004) |
| Depression | Uterus | 0.05 | 0.025 (0.004) |
| Depression | Uterus | 0.1 | 0.025 (0.004) |
| Depression | Uterus | 0.5 | 0.03 (0.004) |
| Depression | Uterus | 1 | 0.03 (0.004) |
| Depression | Uterus | All | 0.032 (0.004) |
| Depression | Vagina | 1e.06 | 0.017 (0.004) |
| Depression | Vagina | 1e.05 | 0.012 (0.004) |
| Depression | Vagina | 1e.04 | 0.018 (0.004) |
| Depression | Vagina | 0.001 | 0.02 (0.004) |
| Depression | Vagina | 0.01 | 0.029 (0.004) |
| Depression | Vagina | 0.05 | 0.031 (0.004) |
| Depression | Vagina | 0.1 | 0.032 (0.004) |
| Depression | Vagina | 0.5 | 0.032 (0.004) |
| Depression | Vagina | 1 | 0.032 (0.004) |
| Depression | Vagina | All | 0.033 (0.004) |
| Depression | Whole_Blood | 1e.06 | 0.023 (0.004) |
| Depression | Whole_Blood | 1e.05 | 0.025 (0.004) |
| Depression | Whole_Blood | 1e.04 | 0.026 (0.004) |
| Depression | Whole_Blood | 0.001 | 0.033 (0.004) |
| Depression | Whole_Blood | 0.01 | 0.039 (0.004) |
| Depression | Whole_Blood | 0.05 | 0.045 (0.004) |
| Depression | Whole_Blood | 0.1 | 0.044 (0.004) |
| Depression | Whole_Blood | 0.5 | 0.046 (0.004) |
| Depression | Whole_Blood | 1 | 0.047 (0.004) |
| Depression | Whole_Blood | All | 0.049 (0.004) |
| Depression | YFS.BLOOD.RNAARR | 1e.06 | 0.006 (0.004) |
| Depression | YFS.BLOOD.RNAARR | 1e.05 | 0.015 (0.004) |
| Depression | YFS.BLOOD.RNAARR | 1e.04 | 0.019 (0.004) |
| Depression | YFS.BLOOD.RNAARR | 0.001 | 0.024 (0.004) |
| Depression | YFS.BLOOD.RNAARR | 0.01 | 0.029 (0.004) |
| Depression | YFS.BLOOD.RNAARR | 0.05 | 0.04 (0.004) |
| Depression | YFS.BLOOD.RNAARR | 0.1 | 0.042 (0.004) |
| Depression | YFS.BLOOD.RNAARR | 0.5 | 0.043 (0.004) |
| Depression | YFS.BLOOD.RNAARR | 1 | 0.043 (0.004) |
| Depression | YFS.BLOOD.RNAARR | All | 0.043 (0.004) |
| Intelligence | Adipose_Subcutaneous | 1e.05 | 0.023 (0.004) |
| Intelligence | Adipose_Subcutaneous | 1e.04 | 0.03 (0.004) |
| Intelligence | Adipose_Subcutaneous | 0.001 | 0.04 (0.004) |
| Intelligence | Adipose_Subcutaneous | 0.01 | 0.043 (0.004) |
| Intelligence | Adipose_Subcutaneous | 0.05 | 0.049 (0.004) |
| Intelligence | Adipose_Subcutaneous | 0.1 | 0.051 (0.004) |
| Intelligence | Adipose_Subcutaneous | 0.5 | 0.054 (0.004) |
| Intelligence | Adipose_Subcutaneous | 1 | 0.053 (0.004) |
| Intelligence | Adipose_Subcutaneous | All | 0.056 (0.004) |
| Intelligence | Adipose_Visceral_Omentum | 1e.05 | 0.019 (0.004) |
| Intelligence | Adipose_Visceral_Omentum | 1e.04 | 0.022 (0.004) |
| Intelligence | Adipose_Visceral_Omentum | 0.001 | 0.038 (0.004) |
| Intelligence | Adipose_Visceral_Omentum | 0.01 | 0.041 (0.004) |
| Intelligence | Adipose_Visceral_Omentum | 0.05 | 0.038 (0.004) |
| Intelligence | Adipose_Visceral_Omentum | 0.1 | 0.039 (0.004) |
| Intelligence | Adipose_Visceral_Omentum | 0.5 | 0.043 (0.004) |
| Intelligence | Adipose_Visceral_Omentum | 1 | 0.043 (0.004) |
| Intelligence | Adipose_Visceral_Omentum | All | 0.048 (0.004) |
| Intelligence | Adrenal_Gland | 1e.05 | 0.004 (0.004) |
| Intelligence | Adrenal_Gland | 1e.04 | 0.025 (0.004) |
| Intelligence | Adrenal_Gland | 0.001 | 0.031 (0.004) |
| Intelligence | Adrenal_Gland | 0.01 | 0.036 (0.004) |
| Intelligence | Adrenal_Gland | 0.05 | 0.038 (0.004) |
| Intelligence | Adrenal_Gland | 0.1 | 0.043 (0.004) |
| Intelligence | Adrenal_Gland | 0.5 | 0.044 (0.004) |
| Intelligence | Adrenal_Gland | 1 | 0.045 (0.004) |
| Intelligence | Adrenal_Gland | All | 0.046 (0.004) |
| Intelligence | Artery_Aorta | 1e.06 | 0.01 (0.004) |
| Intelligence | Artery_Aorta | 1e.05 | 0.013 (0.004) |
| Intelligence | Artery_Aorta | 1e.04 | 0.021 (0.004) |
| Intelligence | Artery_Aorta | 0.001 | 0.033 (0.004) |
| Intelligence | Artery_Aorta | 0.01 | 0.037 (0.004) |
| Intelligence | Artery_Aorta | 0.05 | 0.041 (0.004) |
| Intelligence | Artery_Aorta | 0.1 | 0.043 (0.004) |
| Intelligence | Artery_Aorta | 0.5 | 0.045 (0.004) |
| Intelligence | Artery_Aorta | 1 | 0.043 (0.004) |
| Intelligence | Artery_Aorta | All | 0.045 (0.004) |
| Intelligence | Artery_Coronary | 1e.05 | 0.023 (0.004) |
| Intelligence | Artery_Coronary | 1e.04 | 0.026 (0.004) |
| Intelligence | Artery_Coronary | 0.001 | 0.033 (0.004) |
| Intelligence | Artery_Coronary | 0.01 | 0.033 (0.004) |
| Intelligence | Artery_Coronary | 0.05 | 0.032 (0.004) |
| Intelligence | Artery_Coronary | 0.1 | 0.033 (0.004) |
| Intelligence | Artery_Coronary | 0.5 | 0.035 (0.004) |
| Intelligence | Artery_Coronary | 1 | 0.037 (0.004) |
| Intelligence | Artery_Coronary | All | 0.041 (0.004) |
| Intelligence | Artery_Tibial | 1e.06 | 0.017 (0.004) |
| Intelligence | Artery_Tibial | 1e.05 | 0.032 (0.004) |
| Intelligence | Artery_Tibial | 1e.04 | 0.039 (0.004) |
| Intelligence | Artery_Tibial | 0.001 | 0.037 (0.004) |
| Intelligence | Artery_Tibial | 0.01 | 0.042 (0.004) |
| Intelligence | Artery_Tibial | 0.05 | 0.046 (0.004) |
| Intelligence | Artery_Tibial | 0.1 | 0.048 (0.004) |
| Intelligence | Artery_Tibial | 0.5 | 0.053 (0.004) |
| Intelligence | Artery_Tibial | 1 | 0.053 (0.004) |
| Intelligence | Artery_Tibial | All | 0.055 (0.004) |
| Intelligence | Brain_Amygdala | 1e.05 | 0.02 (0.004) |
| Intelligence | Brain_Amygdala | 1e.04 | 0.027 (0.004) |
| Intelligence | Brain_Amygdala | 0.001 | 0.025 (0.004) |
| Intelligence | Brain_Amygdala | 0.01 | 0.029 (0.004) |
| Intelligence | Brain_Amygdala | 0.05 | 0.027 (0.004) |
| Intelligence | Brain_Amygdala | 0.1 | 0.032 (0.004) |
| Intelligence | Brain_Amygdala | 0.5 | 0.038 (0.004) |
| Intelligence | Brain_Amygdala | 1 | 0.038 (0.004) |
| Intelligence | Brain_Amygdala | All | 0.04 (0.004) |
| Intelligence | Brain_Anterior_cingulate_cortex_BA24 | 1e.05 | 0.028 (0.004) |
| Intelligence | Brain_Anterior_cingulate_cortex_BA24 | 1e.04 | 0.032 (0.004) |
| Intelligence | Brain_Anterior_cingulate_cortex_BA24 | 0.001 | 0.028 (0.004) |
| Intelligence | Brain_Anterior_cingulate_cortex_BA24 | 0.01 | 0.036 (0.004) |
| Intelligence | Brain_Anterior_cingulate_cortex_BA24 | 0.05 | 0.038 (0.004) |
| Intelligence | Brain_Anterior_cingulate_cortex_BA24 | 0.1 | 0.04 (0.004) |
| Intelligence | Brain_Anterior_cingulate_cortex_BA24 | 0.5 | 0.035 (0.004) |
| Intelligence | Brain_Anterior_cingulate_cortex_BA24 | 1 | 0.035 (0.004) |
| Intelligence | Brain_Anterior_cingulate_cortex_BA24 | All | 0.041 (0.004) |
| Intelligence | Brain_Caudate_basal_ganglia | 1e.05 | 0.004 (0.004) |
| Intelligence | Brain_Caudate_basal_ganglia | 1e.04 | 0.022 (0.004) |
| Intelligence | Brain_Caudate_basal_ganglia | 0.001 | 0.023 (0.004) |
| Intelligence | Brain_Caudate_basal_ganglia | 0.01 | 0.036 (0.004) |
| Intelligence | Brain_Caudate_basal_ganglia | 0.05 | 0.041 (0.004) |
| Intelligence | Brain_Caudate_basal_ganglia | 0.1 | 0.043 (0.004) |
| Intelligence | Brain_Caudate_basal_ganglia | 0.5 | 0.037 (0.004) |
| Intelligence | Brain_Caudate_basal_ganglia | 1 | 0.037 (0.004) |
| Intelligence | Brain_Caudate_basal_ganglia | All | 0.044 (0.004) |
| Intelligence | Brain_Cerebellar_Hemisphere | 1e.06 | 0.005 (0.004) |
| Intelligence | Brain_Cerebellar_Hemisphere | 1e.05 | 0.019 (0.004) |
| Intelligence | Brain_Cerebellar_Hemisphere | 1e.04 | 0.027 (0.004) |
| Intelligence | Brain_Cerebellar_Hemisphere | 0.001 | 0.032 (0.004) |
| Intelligence | Brain_Cerebellar_Hemisphere | 0.01 | 0.034 (0.004) |
| Intelligence | Brain_Cerebellar_Hemisphere | 0.05 | 0.038 (0.004) |
| Intelligence | Brain_Cerebellar_Hemisphere | 0.1 | 0.042 (0.004) |
| Intelligence | Brain_Cerebellar_Hemisphere | 0.5 | 0.041 (0.004) |
| Intelligence | Brain_Cerebellar_Hemisphere | 1 | 0.04 (0.004) |
| Intelligence | Brain_Cerebellar_Hemisphere | All | 0.045 (0.004) |
| Intelligence | Brain_Cerebellum | 1e.06 | 0.003 (0.004) |
| Intelligence | Brain_Cerebellum | 1e.05 | 0.019 (0.004) |
| Intelligence | Brain_Cerebellum | 1e.04 | 0.023 (0.004) |
| Intelligence | Brain_Cerebellum | 0.001 | 0.036 (0.004) |
| Intelligence | Brain_Cerebellum | 0.01 | 0.041 (0.004) |
| Intelligence | Brain_Cerebellum | 0.05 | 0.043 (0.004) |
| Intelligence | Brain_Cerebellum | 0.1 | 0.044 (0.004) |
| Intelligence | Brain_Cerebellum | 0.5 | 0.044 (0.004) |
| Intelligence | Brain_Cerebellum | 1 | 0.043 (0.004) |
| Intelligence | Brain_Cerebellum | All | 0.047 (0.004) |
| Intelligence | Brain_Cortex | 1e.06 | 0.006 (0.004) |
| Intelligence | Brain_Cortex | 1e.05 | 0.007 (0.004) |
| Intelligence | Brain_Cortex | 1e.04 | 0.029 (0.004) |
| Intelligence | Brain_Cortex | 0.001 | 0.031 (0.004) |
| Intelligence | Brain_Cortex | 0.01 | 0.033 (0.004) |
| Intelligence | Brain_Cortex | 0.05 | 0.034 (0.004) |
| Intelligence | Brain_Cortex | 0.1 | 0.036 (0.004) |
| Intelligence | Brain_Cortex | 0.5 | 0.037 (0.004) |
| Intelligence | Brain_Cortex | 1 | 0.037 (0.004) |
| Intelligence | Brain_Cortex | All | 0.041 (0.004) |
| Intelligence | Brain_Frontal_Cortex_BA9 | 1e.06 | 0.005 (0.004) |
| Intelligence | Brain_Frontal_Cortex_BA9 | 1e.05 | 0.005 (0.004) |
| Intelligence | Brain_Frontal_Cortex_BA9 | 1e.04 | 0.029 (0.004) |
| Intelligence | Brain_Frontal_Cortex_BA9 | 0.001 | 0.027 (0.004) |
| Intelligence | Brain_Frontal_Cortex_BA9 | 0.01 | 0.031 (0.004) |
| Intelligence | Brain_Frontal_Cortex_BA9 | 0.05 | 0.032 (0.004) |
| Intelligence | Brain_Frontal_Cortex_BA9 | 0.1 | 0.034 (0.004) |
| Intelligence | Brain_Frontal_Cortex_BA9 | 0.5 | 0.036 (0.004) |
| Intelligence | Brain_Frontal_Cortex_BA9 | 1 | 0.036 (0.004) |
| Intelligence | Brain_Frontal_Cortex_BA9 | All | 0.038 (0.004) |
| Intelligence | Brain_Hippocampus | 1e.05 | 0 (0.004) |
| Intelligence | Brain_Hippocampus | 1e.04 | 0.025 (0.004) |
| Intelligence | Brain_Hippocampus | 0.001 | 0.026 (0.004) |
| Intelligence | Brain_Hippocampus | 0.01 | 0.027 (0.004) |
| Intelligence | Brain_Hippocampus | 0.05 | 0.028 (0.004) |
| Intelligence | Brain_Hippocampus | 0.1 | 0.034 (0.004) |
| Intelligence | Brain_Hippocampus | 0.5 | 0.036 (0.004) |
| Intelligence | Brain_Hippocampus | 1 | 0.036 (0.004) |
| Intelligence | Brain_Hippocampus | All | 0.037 (0.004) |
| Intelligence | Brain_Hypothalamus | 1e.05 | 0.024 (0.004) |
| Intelligence | Brain_Hypothalamus | 1e.04 | 0.029 (0.004) |
| Intelligence | Brain_Hypothalamus | 0.001 | 0.031 (0.004) |
| Intelligence | Brain_Hypothalamus | 0.01 | 0.033 (0.004) |
| Intelligence | Brain_Hypothalamus | 0.05 | 0.034 (0.004) |
| Intelligence | Brain_Hypothalamus | 0.1 | 0.037 (0.004) |
| Intelligence | Brain_Hypothalamus | 0.5 | 0.037 (0.004) |
| Intelligence | Brain_Hypothalamus | 1 | 0.036 (0.004) |
| Intelligence | Brain_Hypothalamus | All | 0.037 (0.004) |
| Intelligence | Brain_Nucleus_accumbens_basal_ganglia | 1e.05 | 0.019 (0.004) |
| Intelligence | Brain_Nucleus_accumbens_basal_ganglia | 1e.04 | 0.03 (0.004) |
| Intelligence | Brain_Nucleus_accumbens_basal_ganglia | 0.001 | 0.029 (0.004) |
| Intelligence | Brain_Nucleus_accumbens_basal_ganglia | 0.01 | 0.033 (0.004) |
| Intelligence | Brain_Nucleus_accumbens_basal_ganglia | 0.05 | 0.036 (0.004) |
| Intelligence | Brain_Nucleus_accumbens_basal_ganglia | 0.1 | 0.038 (0.004) |
| Intelligence | Brain_Nucleus_accumbens_basal_ganglia | 0.5 | 0.038 (0.004) |
| Intelligence | Brain_Nucleus_accumbens_basal_ganglia | 1 | 0.038 (0.004) |
| Intelligence | Brain_Nucleus_accumbens_basal_ganglia | All | 0.04 (0.004) |
| Intelligence | Brain_Putamen_basal_ganglia | 1e.05 | 0.023 (0.004) |
| Intelligence | Brain_Putamen_basal_ganglia | 1e.04 | 0.033 (0.004) |
| Intelligence | Brain_Putamen_basal_ganglia | 0.001 | 0.029 (0.004) |
| Intelligence | Brain_Putamen_basal_ganglia | 0.01 | 0.034 (0.004) |
| Intelligence | Brain_Putamen_basal_ganglia | 0.05 | 0.038 (0.004) |
| Intelligence | Brain_Putamen_basal_ganglia | 0.1 | 0.039 (0.004) |
| Intelligence | Brain_Putamen_basal_ganglia | 0.5 | 0.04 (0.004) |
| Intelligence | Brain_Putamen_basal_ganglia | 1 | 0.04 (0.004) |
| Intelligence | Brain_Putamen_basal_ganglia | All | 0.043 (0.004) |
| Intelligence | Brain_Spinal_cord_cervical_c-1 | 1e.05 | -0.002 (0.004) |
| Intelligence | Brain_Spinal_cord_cervical_c-1 | 1e.04 | 0.021 (0.004) |
| Intelligence | Brain_Spinal_cord_cervical_c-1 | 0.001 | 0.017 (0.004) |
| Intelligence | Brain_Spinal_cord_cervical_c-1 | 0.01 | 0.025 (0.004) |
| Intelligence | Brain_Spinal_cord_cervical_c-1 | 0.05 | 0.03 (0.004) |
| Intelligence | Brain_Spinal_cord_cervical_c-1 | 0.1 | 0.031 (0.004) |
| Intelligence | Brain_Spinal_cord_cervical_c-1 | 0.5 | 0.029 (0.004) |
| Intelligence | Brain_Spinal_cord_cervical_c-1 | 1 | 0.029 (0.004) |
| Intelligence | Brain_Spinal_cord_cervical_c-1 | All | 0.034 (0.004) |
| Intelligence | Brain_Substantia_nigra | 1e.04 | 0.031 (0.004) |
| Intelligence | Brain_Substantia_nigra | 0.001 | 0.021 (0.004) |
| Intelligence | Brain_Substantia_nigra | 0.01 | 0.025 (0.004) |
| Intelligence | Brain_Substantia_nigra | 0.05 | 0.025 (0.004) |
| Intelligence | Brain_Substantia_nigra | 0.1 | 0.028 (0.004) |
| Intelligence | Brain_Substantia_nigra | 0.5 | 0.026 (0.004) |
| Intelligence | Brain_Substantia_nigra | 1 | 0.025 (0.004) |
| Intelligence | Brain_Substantia_nigra | All | 0.033 (0.004) |
| Intelligence | Breast_Mammary_Tissue | 1e.05 | 0.003 (0.004) |
| Intelligence | Breast_Mammary_Tissue | 1e.04 | 0.024 (0.004) |
| Intelligence | Breast_Mammary_Tissue | 0.001 | 0.035 (0.004) |
| Intelligence | Breast_Mammary_Tissue | 0.01 | 0.04 (0.004) |
| Intelligence | Breast_Mammary_Tissue | 0.05 | 0.039 (0.004) |
| Intelligence | Breast_Mammary_Tissue | 0.1 | 0.039 (0.004) |
| Intelligence | Breast_Mammary_Tissue | 0.5 | 0.044 (0.004) |
| Intelligence | Breast_Mammary_Tissue | 1 | 0.044 (0.004) |
| Intelligence | Breast_Mammary_Tissue | All | 0.045 (0.004) |
| Intelligence | Cells_EBV-transformed_lymphocytes | 1e.04 | 0.019 (0.004) |
| Intelligence | Cells_EBV-transformed_lymphocytes | 0.001 | 0.025 (0.004) |
| Intelligence | Cells_EBV-transformed_lymphocytes | 0.01 | 0.026 (0.004) |
| Intelligence | Cells_EBV-transformed_lymphocytes | 0.05 | 0.036 (0.004) |
| Intelligence | Cells_EBV-transformed_lymphocytes | 0.1 | 0.034 (0.004) |
| Intelligence | Cells_EBV-transformed_lymphocytes | 0.5 | 0.034 (0.004) |
| Intelligence | Cells_EBV-transformed_lymphocytes | 1 | 0.034 (0.004) |
| Intelligence | Cells_EBV-transformed_lymphocytes | All | 0.034 (0.004) |
| Intelligence | Cells_Transformed_fibroblasts | 1e.05 | 0.012 (0.004) |
| Intelligence | Cells_Transformed_fibroblasts | 1e.04 | 0.022 (0.004) |
| Intelligence | Cells_Transformed_fibroblasts | 0.001 | 0.033 (0.004) |
| Intelligence | Cells_Transformed_fibroblasts | 0.01 | 0.039 (0.004) |
| Intelligence | Cells_Transformed_fibroblasts | 0.05 | 0.044 (0.004) |
| Intelligence | Cells_Transformed_fibroblasts | 0.1 | 0.045 (0.004) |
| Intelligence | Cells_Transformed_fibroblasts | 0.5 | 0.048 (0.004) |
| Intelligence | Cells_Transformed_fibroblasts | 1 | 0.048 (0.004) |
| Intelligence | Cells_Transformed_fibroblasts | All | 0.049 (0.004) |
| Intelligence | CMC.BRAIN.RNASEQ | 1e.06 | 0.009 (0.004) |
| Intelligence | CMC.BRAIN.RNASEQ | 1e.05 | 0.019 (0.004) |
| Intelligence | CMC.BRAIN.RNASEQ | 1e.04 | 0.023 (0.004) |
| Intelligence | CMC.BRAIN.RNASEQ | 0.001 | 0.032 (0.004) |
| Intelligence | CMC.BRAIN.RNASEQ | 0.01 | 0.033 (0.004) |
| Intelligence | CMC.BRAIN.RNASEQ | 0.05 | 0.038 (0.004) |
| Intelligence | CMC.BRAIN.RNASEQ | 0.1 | 0.042 (0.004) |
| Intelligence | CMC.BRAIN.RNASEQ | 0.5 | 0.046 (0.004) |
| Intelligence | CMC.BRAIN.RNASEQ | 1 | 0.044 (0.004) |
| Intelligence | CMC.BRAIN.RNASEQ | All | 0.048 (0.004) |
| Intelligence | CMC.BRAIN.RNASEQ_SPLICING | 1e.06 | 0.009 (0.004) |
| Intelligence | CMC.BRAIN.RNASEQ_SPLICING | 1e.05 | 0.011 (0.004) |
| Intelligence | CMC.BRAIN.RNASEQ_SPLICING | 1e.04 | 0.017 (0.004) |
| Intelligence | CMC.BRAIN.RNASEQ_SPLICING | 0.001 | 0.026 (0.004) |
| Intelligence | CMC.BRAIN.RNASEQ_SPLICING | 0.01 | 0.039 (0.004) |
| Intelligence | CMC.BRAIN.RNASEQ_SPLICING | 0.05 | 0.039 (0.004) |
| Intelligence | CMC.BRAIN.RNASEQ_SPLICING | 0.1 | 0.038 (0.004) |
| Intelligence | CMC.BRAIN.RNASEQ_SPLICING | 0.5 | 0.04 (0.004) |
| Intelligence | CMC.BRAIN.RNASEQ_SPLICING | 1 | 0.04 (0.004) |
| Intelligence | CMC.BRAIN.RNASEQ_SPLICING | All | 0.046 (0.004) |
| Intelligence | Colon_Sigmoid | 1e.05 | 0.004 (0.004) |
| Intelligence | Colon_Sigmoid | 1e.04 | 0.03 (0.004) |
| Intelligence | Colon_Sigmoid | 0.001 | 0.034 (0.004) |
| Intelligence | Colon_Sigmoid | 0.01 | 0.034 (0.004) |
| Intelligence | Colon_Sigmoid | 0.05 | 0.042 (0.004) |
| Intelligence | Colon_Sigmoid | 0.1 | 0.041 (0.004) |
| Intelligence | Colon_Sigmoid | 0.5 | 0.043 (0.004) |
| Intelligence | Colon_Sigmoid | 1 | 0.043 (0.004) |
| Intelligence | Colon_Sigmoid | All | 0.045 (0.004) |
| Intelligence | Colon_Transverse | 1e.05 | 0.021 (0.004) |
| Intelligence | Colon_Transverse | 1e.04 | 0.031 (0.004) |
| Intelligence | Colon_Transverse | 0.001 | 0.035 (0.004) |
| Intelligence | Colon_Transverse | 0.01 | 0.037 (0.004) |
| Intelligence | Colon_Transverse | 0.05 | 0.037 (0.004) |
| Intelligence | Colon_Transverse | 0.1 | 0.04 (0.004) |
| Intelligence | Colon_Transverse | 0.5 | 0.043 (0.004) |
| Intelligence | Colon_Transverse | 1 | 0.042 (0.004) |
| Intelligence | Colon_Transverse | All | 0.046 (0.004) |
| Intelligence | Esophagus_Gastroesophageal_Junction | 1e.04 | 0.031 (0.004) |
| Intelligence | Esophagus_Gastroesophageal_Junction | 0.001 | 0.03 (0.004) |
| Intelligence | Esophagus_Gastroesophageal_Junction | 0.01 | 0.034 (0.004) |
| Intelligence | Esophagus_Gastroesophageal_Junction | 0.05 | 0.035 (0.004) |
| Intelligence | Esophagus_Gastroesophageal_Junction | 0.1 | 0.04 (0.004) |
| Intelligence | Esophagus_Gastroesophageal_Junction | 0.5 | 0.044 (0.004) |
| Intelligence | Esophagus_Gastroesophageal_Junction | 1 | 0.044 (0.004) |
| Intelligence | Esophagus_Gastroesophageal_Junction | All | 0.046 (0.004) |
| Intelligence | Esophagus_Mucosa | 1e.05 | 0.024 (0.004) |
| Intelligence | Esophagus_Mucosa | 1e.04 | 0.028 (0.004) |
| Intelligence | Esophagus_Mucosa | 0.001 | 0.036 (0.004) |
| Intelligence | Esophagus_Mucosa | 0.01 | 0.037 (0.004) |
| Intelligence | Esophagus_Mucosa | 0.05 | 0.039 (0.004) |
| Intelligence | Esophagus_Mucosa | 0.1 | 0.039 (0.004) |
| Intelligence | Esophagus_Mucosa | 0.5 | 0.042 (0.004) |
| Intelligence | Esophagus_Mucosa | 1 | 0.042 (0.004) |
| Intelligence | Esophagus_Mucosa | All | 0.044 (0.004) |
| Intelligence | Esophagus_Muscularis | 1e.06 | 0.002 (0.004) |
| Intelligence | Esophagus_Muscularis | 1e.05 | 0.017 (0.004) |
| Intelligence | Esophagus_Muscularis | 1e.04 | 0.019 (0.004) |
| Intelligence | Esophagus_Muscularis | 0.001 | 0.035 (0.004) |
| Intelligence | Esophagus_Muscularis | 0.01 | 0.038 (0.004) |
| Intelligence | Esophagus_Muscularis | 0.05 | 0.043 (0.004) |
| Intelligence | Esophagus_Muscularis | 0.1 | 0.049 (0.004) |
| Intelligence | Esophagus_Muscularis | 0.5 | 0.051 (0.004) |
| Intelligence | Esophagus_Muscularis | 1 | 0.051 (0.004) |
| Intelligence | Esophagus_Muscularis | All | 0.053 (0.004) |
| Intelligence | Heart_Atrial_Appendage | 1e.05 | 0.007 (0.004) |
| Intelligence | Heart_Atrial_Appendage | 1e.04 | 0.019 (0.004) |
| Intelligence | Heart_Atrial_Appendage | 0.001 | 0.032 (0.004) |
| Intelligence | Heart_Atrial_Appendage | 0.01 | 0.044 (0.004) |
| Intelligence | Heart_Atrial_Appendage | 0.05 | 0.045 (0.004) |
| Intelligence | Heart_Atrial_Appendage | 0.1 | 0.048 (0.004) |
| Intelligence | Heart_Atrial_Appendage | 0.5 | 0.048 (0.004) |
| Intelligence | Heart_Atrial_Appendage | 1 | 0.049 (0.004) |
| Intelligence | Heart_Atrial_Appendage | All | 0.051 (0.004) |
| Intelligence | Heart_Left_Ventricle | 1e.05 | 0.023 (0.004) |
| Intelligence | Heart_Left_Ventricle | 1e.04 | 0.027 (0.004) |
| Intelligence | Heart_Left_Ventricle | 0.001 | 0.03 (0.004) |
| Intelligence | Heart_Left_Ventricle | 0.01 | 0.038 (0.004) |
| Intelligence | Heart_Left_Ventricle | 0.05 | 0.039 (0.004) |
| Intelligence | Heart_Left_Ventricle | 0.1 | 0.043 (0.004) |
| Intelligence | Heart_Left_Ventricle | 0.5 | 0.044 (0.004) |
| Intelligence | Heart_Left_Ventricle | 1 | 0.043 (0.004) |
| Intelligence | Heart_Left_Ventricle | All | 0.042 (0.004) |
| Intelligence | Liver | 1e.05 | 0.012 (0.004) |
| Intelligence | Liver | 1e.04 | 0.029 (0.004) |
| Intelligence | Liver | 0.001 | 0.034 (0.004) |
| Intelligence | Liver | 0.01 | 0.03 (0.004) |
| Intelligence | Liver | 0.05 | 0.031 (0.004) |
| Intelligence | Liver | 0.1 | 0.032 (0.004) |
| Intelligence | Liver | 0.5 | 0.033 (0.004) |
| Intelligence | Liver | 1 | 0.033 (0.004) |
| Intelligence | Liver | All | 0.04 (0.004) |
| Intelligence | Lung | 1e.06 | 0.022 (0.004) |
| Intelligence | Lung | 1e.05 | 0.021 (0.004) |
| Intelligence | Lung | 1e.04 | 0.033 (0.004) |
| Intelligence | Lung | 0.001 | 0.034 (0.004) |
| Intelligence | Lung | 0.01 | 0.042 (0.004) |
| Intelligence | Lung | 0.05 | 0.043 (0.004) |
| Intelligence | Lung | 0.1 | 0.045 (0.004) |
| Intelligence | Lung | 0.5 | 0.046 (0.004) |
| Intelligence | Lung | 1 | 0.047 (0.004) |
| Intelligence | Lung | All | 0.05 (0.004) |
| Intelligence | METSIM.ADIPOSE.RNASEQ | 1e.05 | 0.02 (0.004) |
| Intelligence | METSIM.ADIPOSE.RNASEQ | 1e.04 | 0.027 (0.004) |
| Intelligence | METSIM.ADIPOSE.RNASEQ | 0.001 | 0.032 (0.004) |
| Intelligence | METSIM.ADIPOSE.RNASEQ | 0.01 | 0.035 (0.004) |
| Intelligence | METSIM.ADIPOSE.RNASEQ | 0.05 | 0.035 (0.004) |
| Intelligence | METSIM.ADIPOSE.RNASEQ | 0.1 | 0.039 (0.004) |
| Intelligence | METSIM.ADIPOSE.RNASEQ | 0.5 | 0.048 (0.004) |
| Intelligence | METSIM.ADIPOSE.RNASEQ | 1 | 0.047 (0.004) |
| Intelligence | METSIM.ADIPOSE.RNASEQ | All | 0.049 (0.004) |
| Intelligence | Minor_Salivary_Gland | 1e.04 | 0.017 (0.004) |
| Intelligence | Minor_Salivary_Gland | 0.001 | 0.027 (0.004) |
| Intelligence | Minor_Salivary_Gland | 0.01 | 0.03 (0.004) |
| Intelligence | Minor_Salivary_Gland | 0.05 | 0.029 (0.004) |
| Intelligence | Minor_Salivary_Gland | 0.1 | 0.03 (0.004) |
| Intelligence | Minor_Salivary_Gland | 0.5 | 0.032 (0.004) |
| Intelligence | Minor_Salivary_Gland | 1 | 0.033 (0.004) |
| Intelligence | Minor_Salivary_Gland | All | 0.035 (0.004) |
| Intelligence | Muscle_Skeletal | 1e.06 | -0.011 (0.004) |
| Intelligence | Muscle_Skeletal | 1e.05 | -0.008 (0.004) |
| Intelligence | Muscle_Skeletal | 1e.04 | 0.03 (0.004) |
| Intelligence | Muscle_Skeletal | 0.001 | 0.032 (0.004) |
| Intelligence | Muscle_Skeletal | 0.01 | 0.042 (0.004) |
| Intelligence | Muscle_Skeletal | 0.05 | 0.051 (0.004) |
| Intelligence | Muscle_Skeletal | 0.1 | 0.052 (0.004) |
| Intelligence | Muscle_Skeletal | 0.5 | 0.054 (0.004) |
| Intelligence | Muscle_Skeletal | 1 | 0.052 (0.004) |
| Intelligence | Muscle_Skeletal | All | 0.053 (0.004) |
| Intelligence | Nerve_Tibial | 1e.05 | 0.018 (0.004) |
| Intelligence | Nerve_Tibial | 1e.04 | 0.034 (0.004) |
| Intelligence | Nerve_Tibial | 0.001 | 0.036 (0.004) |
| Intelligence | Nerve_Tibial | 0.01 | 0.045 (0.004) |
| Intelligence | Nerve_Tibial | 0.05 | 0.046 (0.004) |
| Intelligence | Nerve_Tibial | 0.1 | 0.05 (0.004) |
| Intelligence | Nerve_Tibial | 0.5 | 0.048 (0.004) |
| Intelligence | Nerve_Tibial | 1 | 0.049 (0.004) |
| Intelligence | Nerve_Tibial | All | 0.052 (0.004) |
| Intelligence | NTR.BLOOD.RNAARR | 1e.04 | 0.025 (0.004) |
| Intelligence | NTR.BLOOD.RNAARR | 0.001 | 0.031 (0.004) |
| Intelligence | NTR.BLOOD.RNAARR | 0.01 | 0.029 (0.004) |
| Intelligence | NTR.BLOOD.RNAARR | 0.05 | 0.033 (0.004) |
| Intelligence | NTR.BLOOD.RNAARR | 0.1 | 0.029 (0.004) |
| Intelligence | NTR.BLOOD.RNAARR | 0.5 | 0.032 (0.004) |
| Intelligence | NTR.BLOOD.RNAARR | 1 | 0.034 (0.004) |
| Intelligence | NTR.BLOOD.RNAARR | All | 0.038 (0.004) |
| Intelligence | Ovary | 1e.04 | 0.014 (0.004) |
| Intelligence | Ovary | 0.001 | 0.024 (0.004) |
| Intelligence | Ovary | 0.01 | 0.033 (0.004) |
| Intelligence | Ovary | 0.05 | 0.037 (0.004) |
| Intelligence | Ovary | 0.1 | 0.037 (0.004) |
| Intelligence | Ovary | 0.5 | 0.039 (0.004) |
| Intelligence | Ovary | 1 | 0.038 (0.004) |
| Intelligence | Ovary | All | 0.039 (0.004) |
| Intelligence | Pancreas | 1e.05 | 0.004 (0.004) |
| Intelligence | Pancreas | 1e.04 | 0.026 (0.004) |
| Intelligence | Pancreas | 0.001 | 0.029 (0.004) |
| Intelligence | Pancreas | 0.01 | 0.035 (0.004) |
| Intelligence | Pancreas | 0.05 | 0.038 (0.004) |
| Intelligence | Pancreas | 0.1 | 0.041 (0.004) |
| Intelligence | Pancreas | 0.5 | 0.046 (0.004) |
| Intelligence | Pancreas | 1 | 0.046 (0.004) |
| Intelligence | Pancreas | All | 0.049 (0.004) |
| Intelligence | Pituitary | 1e.05 | 0.007 (0.004) |
| Intelligence | Pituitary | 1e.04 | 0.029 (0.004) |
| Intelligence | Pituitary | 0.001 | 0.034 (0.004) |
| Intelligence | Pituitary | 0.01 | 0.035 (0.004) |
| Intelligence | Pituitary | 0.05 | 0.038 (0.004) |
| Intelligence | Pituitary | 0.1 | 0.037 (0.004) |
| Intelligence | Pituitary | 0.5 | 0.04 (0.004) |
| Intelligence | Pituitary | 1 | 0.04 (0.004) |
| Intelligence | Pituitary | All | 0.043 (0.004) |
| Intelligence | Prostate | 1e.06 | 0.01 (0.004) |
| Intelligence | Prostate | 1e.05 | 0.017 (0.004) |
| Intelligence | Prostate | 1e.04 | 0.026 (0.004) |
| Intelligence | Prostate | 0.001 | 0.034 (0.004) |
| Intelligence | Prostate | 0.01 | 0.035 (0.004) |
| Intelligence | Prostate | 0.05 | 0.037 (0.004) |
| Intelligence | Prostate | 0.1 | 0.039 (0.004) |
| Intelligence | Prostate | 0.5 | 0.038 (0.004) |
| Intelligence | Prostate | 1 | 0.038 (0.004) |
| Intelligence | Prostate | All | 0.042 (0.004) |
| Intelligence | Skin_Not_Sun_Exposed_Suprapubic | 1e.05 | 0.013 (0.004) |
| Intelligence | Skin_Not_Sun_Exposed_Suprapubic | 1e.04 | 0.026 (0.004) |
| Intelligence | Skin_Not_Sun_Exposed_Suprapubic | 0.001 | 0.039 (0.004) |
| Intelligence | Skin_Not_Sun_Exposed_Suprapubic | 0.01 | 0.039 (0.004) |
| Intelligence | Skin_Not_Sun_Exposed_Suprapubic | 0.05 | 0.043 (0.004) |
| Intelligence | Skin_Not_Sun_Exposed_Suprapubic | 0.1 | 0.046 (0.004) |
| Intelligence | Skin_Not_Sun_Exposed_Suprapubic | 0.5 | 0.049 (0.004) |
| Intelligence | Skin_Not_Sun_Exposed_Suprapubic | 1 | 0.048 (0.004) |
| Intelligence | Skin_Not_Sun_Exposed_Suprapubic | All | 0.051 (0.004) |
| Intelligence | Skin_Sun_Exposed_Lower_leg | 1e.05 | 0.006 (0.004) |
| Intelligence | Skin_Sun_Exposed_Lower_leg | 1e.04 | 0.026 (0.004) |
| Intelligence | Skin_Sun_Exposed_Lower_leg | 0.001 | 0.03 (0.004) |
| Intelligence | Skin_Sun_Exposed_Lower_leg | 0.01 | 0.035 (0.004) |
| Intelligence | Skin_Sun_Exposed_Lower_leg | 0.05 | 0.036 (0.004) |
| Intelligence | Skin_Sun_Exposed_Lower_leg | 0.1 | 0.041 (0.004) |
| Intelligence | Skin_Sun_Exposed_Lower_leg | 0.5 | 0.045 (0.004) |
| Intelligence | Skin_Sun_Exposed_Lower_leg | 1 | 0.044 (0.004) |
| Intelligence | Skin_Sun_Exposed_Lower_leg | All | 0.046 (0.004) |
| Intelligence | Small_Intestine_Terminal_Ileum | 1e.05 | 0.012 (0.004) |
| Intelligence | Small_Intestine_Terminal_Ileum | 1e.04 | 0.022 (0.004) |
| Intelligence | Small_Intestine_Terminal_Ileum | 0.001 | 0.027 (0.004) |
| Intelligence | Small_Intestine_Terminal_Ileum | 0.01 | 0.026 (0.004) |
| Intelligence | Small_Intestine_Terminal_Ileum | 0.05 | 0.029 (0.004) |
| Intelligence | Small_Intestine_Terminal_Ileum | 0.1 | 0.033 (0.004) |
| Intelligence | Small_Intestine_Terminal_Ileum | 0.5 | 0.033 (0.004) |
| Intelligence | Small_Intestine_Terminal_Ileum | 1 | 0.034 (0.004) |
| Intelligence | Small_Intestine_Terminal_Ileum | All | 0.035 (0.004) |
| Intelligence | Spleen | 1e.04 | 0.028 (0.004) |
| Intelligence | Spleen | 0.001 | 0.038 (0.004) |
| Intelligence | Spleen | 0.01 | 0.039 (0.004) |
| Intelligence | Spleen | 0.05 | 0.04 (0.004) |
| Intelligence | Spleen | 0.1 | 0.041 (0.004) |
| Intelligence | Spleen | 0.5 | 0.043 (0.004) |
| Intelligence | Spleen | 1 | 0.042 (0.004) |
| Intelligence | Spleen | All | 0.047 (0.004) |
| Intelligence | Stomach | 1e.05 | 0.025 (0.004) |
| Intelligence | Stomach | 1e.04 | 0.029 (0.004) |
| Intelligence | Stomach | 0.001 | 0.037 (0.004) |
| Intelligence | Stomach | 0.01 | 0.042 (0.004) |
| Intelligence | Stomach | 0.05 | 0.044 (0.004) |
| Intelligence | Stomach | 0.1 | 0.045 (0.004) |
| Intelligence | Stomach | 0.5 | 0.046 (0.004) |
| Intelligence | Stomach | 1 | 0.045 (0.004) |
| Intelligence | Stomach | All | 0.048 (0.004) |
| Intelligence | Testis | 1e.05 | 0.004 (0.004) |
| Intelligence | Testis | 1e.04 | 0.026 (0.004) |
| Intelligence | Testis | 0.001 | 0.035 (0.004) |
| Intelligence | Testis | 0.01 | 0.043 (0.004) |
| Intelligence | Testis | 0.05 | 0.044 (0.004) |
| Intelligence | Testis | 0.1 | 0.047 (0.004) |
| Intelligence | Testis | 0.5 | 0.047 (0.004) |
| Intelligence | Testis | 1 | 0.048 (0.004) |
| Intelligence | Testis | All | 0.051 (0.004) |
| Intelligence | Thyroid | 1e.06 | 0.003 (0.004) |
| Intelligence | Thyroid | 1e.05 | 0.033 (0.004) |
| Intelligence | Thyroid | 1e.04 | 0.032 (0.004) |
| Intelligence | Thyroid | 0.001 | 0.031 (0.004) |
| Intelligence | Thyroid | 0.01 | 0.042 (0.004) |
| Intelligence | Thyroid | 0.05 | 0.045 (0.004) |
| Intelligence | Thyroid | 0.1 | 0.047 (0.004) |
| Intelligence | Thyroid | 0.5 | 0.051 (0.004) |
| Intelligence | Thyroid | 1 | 0.05 (0.004) |
| Intelligence | Thyroid | All | 0.052 (0.004) |
| Intelligence | Uterus | 1e.06 | 0.022 (0.004) |
| Intelligence | Uterus | 1e.05 | 0.029 (0.004) |
| Intelligence | Uterus | 1e.04 | 0.026 (0.004) |
| Intelligence | Uterus | 0.001 | 0.024 (0.004) |
| Intelligence | Uterus | 0.01 | 0.029 (0.004) |
| Intelligence | Uterus | 0.05 | 0.032 (0.004) |
| Intelligence | Uterus | 0.1 | 0.031 (0.004) |
| Intelligence | Uterus | 0.5 | 0.037 (0.004) |
| Intelligence | Uterus | 1 | 0.036 (0.004) |
| Intelligence | Uterus | All | 0.04 (0.004) |
| Intelligence | Vagina | 1e.04 | 0.032 (0.004) |
| Intelligence | Vagina | 0.001 | 0.023 (0.004) |
| Intelligence | Vagina | 0.01 | 0.027 (0.004) |
| Intelligence | Vagina | 0.05 | 0.027 (0.004) |
| Intelligence | Vagina | 0.1 | 0.029 (0.004) |
| Intelligence | Vagina | 0.5 | 0.033 (0.004) |
| Intelligence | Vagina | 1 | 0.032 (0.004) |
| Intelligence | Vagina | All | 0.039 (0.004) |
| Intelligence | Whole_Blood | 1e.05 | -0.003 (0.004) |
| Intelligence | Whole_Blood | 1e.04 | 0.03 (0.004) |
| Intelligence | Whole_Blood | 0.001 | 0.032 (0.004) |
| Intelligence | Whole_Blood | 0.01 | 0.036 (0.004) |
| Intelligence | Whole_Blood | 0.05 | 0.035 (0.004) |
| Intelligence | Whole_Blood | 0.1 | 0.036 (0.004) |
| Intelligence | Whole_Blood | 0.5 | 0.037 (0.004) |
| Intelligence | Whole_Blood | 1 | 0.038 (0.004) |
| Intelligence | Whole_Blood | All | 0.043 (0.004) |
| Intelligence | YFS.BLOOD.RNAARR | 1e.05 | 0.002 (0.004) |
| Intelligence | YFS.BLOOD.RNAARR | 1e.04 | 0.021 (0.004) |
| Intelligence | YFS.BLOOD.RNAARR | 0.001 | 0.029 (0.004) |
| Intelligence | YFS.BLOOD.RNAARR | 0.01 | 0.026 (0.004) |
| Intelligence | YFS.BLOOD.RNAARR | 0.05 | 0.033 (0.004) |
| Intelligence | YFS.BLOOD.RNAARR | 0.1 | 0.038 (0.004) |
| Intelligence | YFS.BLOOD.RNAARR | 0.5 | 0.047 (0.004) |
| Intelligence | YFS.BLOOD.RNAARR | 1 | 0.047 (0.004) |
| Intelligence | YFS.BLOOD.RNAARR | All | 0.049 (0.004) |
| BMI | Adipose_Subcutaneous | 1e.06 | 0.043 (0.004) |
| BMI | Adipose_Subcutaneous | 1e.05 | 0.05 (0.004) |
| BMI | Adipose_Subcutaneous | 1e.04 | 0.06 (0.004) |
| BMI | Adipose_Subcutaneous | 0.001 | 0.073 (0.004) |
| BMI | Adipose_Subcutaneous | 0.01 | 0.092 (0.004) |
| BMI | Adipose_Subcutaneous | 0.05 | 0.109 (0.004) |
| BMI | Adipose_Subcutaneous | 0.1 | 0.113 (0.004) |
| BMI | Adipose_Subcutaneous | 0.5 | 0.127 (0.004) |
| BMI | Adipose_Subcutaneous | 1 | 0.127 (0.004) |
| BMI | Adipose_Subcutaneous | All | 0.128 (0.004) |
| BMI | Adipose_Visceral_Omentum | 1e.06 | 0.046 (0.004) |
| BMI | Adipose_Visceral_Omentum | 1e.05 | 0.049 (0.004) |
| BMI | Adipose_Visceral_Omentum | 1e.04 | 0.055 (0.004) |
| BMI | Adipose_Visceral_Omentum | 0.001 | 0.071 (0.004) |
| BMI | Adipose_Visceral_Omentum | 0.01 | 0.086 (0.004) |
| BMI | Adipose_Visceral_Omentum | 0.05 | 0.1 (0.004) |
| BMI | Adipose_Visceral_Omentum | 0.1 | 0.108 (0.004) |
| BMI | Adipose_Visceral_Omentum | 0.5 | 0.118 (0.004) |
| BMI | Adipose_Visceral_Omentum | 1 | 0.118 (0.004) |
| BMI | Adipose_Visceral_Omentum | All | 0.119 (0.004) |
| BMI | Adrenal_Gland | 1e.06 | 0.036 (0.004) |
| BMI | Adrenal_Gland | 1e.05 | 0.04 (0.004) |
| BMI | Adrenal_Gland | 1e.04 | 0.05 (0.004) |
| BMI | Adrenal_Gland | 0.001 | 0.058 (0.004) |
| BMI | Adrenal_Gland | 0.01 | 0.073 (0.004) |
| BMI | Adrenal_Gland | 0.05 | 0.085 (0.004) |
| BMI | Adrenal_Gland | 0.1 | 0.091 (0.004) |
| BMI | Adrenal_Gland | 0.5 | 0.101 (0.004) |
| BMI | Adrenal_Gland | 1 | 0.102 (0.004) |
| BMI | Adrenal_Gland | All | 0.103 (0.004) |
| BMI | Artery_Aorta | 1e.06 | 0.032 (0.004) |
| BMI | Artery_Aorta | 1e.05 | 0.038 (0.004) |
| BMI | Artery_Aorta | 1e.04 | 0.042 (0.004) |
| BMI | Artery_Aorta | 0.001 | 0.056 (0.004) |
| BMI | Artery_Aorta | 0.01 | 0.075 (0.004) |
| BMI | Artery_Aorta | 0.05 | 0.092 (0.004) |
| BMI | Artery_Aorta | 0.1 | 0.097 (0.004) |
| BMI | Artery_Aorta | 0.5 | 0.108 (0.004) |
| BMI | Artery_Aorta | 1 | 0.109 (0.004) |
| BMI | Artery_Aorta | All | 0.116 (0.004) |
| BMI | Artery_Coronary | 1e.06 | 0.035 (0.004) |
| BMI | Artery_Coronary | 1e.05 | 0.04 (0.004) |
| BMI | Artery_Coronary | 1e.04 | 0.05 (0.004) |
| BMI | Artery_Coronary | 0.001 | 0.057 (0.004) |
| BMI | Artery_Coronary | 0.01 | 0.075 (0.004) |
| BMI | Artery_Coronary | 0.05 | 0.089 (0.004) |
| BMI | Artery_Coronary | 0.1 | 0.095 (0.004) |
| BMI | Artery_Coronary | 0.5 | 0.1 (0.004) |
| BMI | Artery_Coronary | 1 | 0.101 (0.004) |
| BMI | Artery_Coronary | All | 0.103 (0.004) |
| BMI | Artery_Tibial | 1e.06 | 0.046 (0.004) |
| BMI | Artery_Tibial | 1e.05 | 0.052 (0.004) |
| BMI | Artery_Tibial | 1e.04 | 0.06 (0.004) |
| BMI | Artery_Tibial | 0.001 | 0.074 (0.004) |
| BMI | Artery_Tibial | 0.01 | 0.091 (0.004) |
| BMI | Artery_Tibial | 0.05 | 0.111 (0.004) |
| BMI | Artery_Tibial | 0.1 | 0.116 (0.004) |
| BMI | Artery_Tibial | 0.5 | 0.127 (0.004) |
| BMI | Artery_Tibial | 1 | 0.128 (0.004) |
| BMI | Artery_Tibial | All | 0.13 (0.004) |
| BMI | Brain_Amygdala | 1e.06 | 0.029 (0.004) |
| BMI | Brain_Amygdala | 1e.05 | 0.032 (0.004) |
| BMI | Brain_Amygdala | 1e.04 | 0.039 (0.004) |
| BMI | Brain_Amygdala | 0.001 | 0.044 (0.004) |
| BMI | Brain_Amygdala | 0.01 | 0.057 (0.004) |
| BMI | Brain_Amygdala | 0.05 | 0.066 (0.004) |
| BMI | Brain_Amygdala | 0.1 | 0.07 (0.004) |
| BMI | Brain_Amygdala | 0.5 | 0.078 (0.004) |
| BMI | Brain_Amygdala | 1 | 0.079 (0.004) |
| BMI | Brain_Amygdala | All | 0.083 (0.004) |
| BMI | Brain_Anterior_cingulate_cortex_BA24 | 1e.06 | 0.03 (0.004) |
| BMI | Brain_Anterior_cingulate_cortex_BA24 | 1e.05 | 0.036 (0.004) |
| BMI | Brain_Anterior_cingulate_cortex_BA24 | 1e.04 | 0.039 (0.004) |
| BMI | Brain_Anterior_cingulate_cortex_BA24 | 0.001 | 0.049 (0.004) |
| BMI | Brain_Anterior_cingulate_cortex_BA24 | 0.01 | 0.068 (0.004) |
| BMI | Brain_Anterior_cingulate_cortex_BA24 | 0.05 | 0.081 (0.004) |
| BMI | Brain_Anterior_cingulate_cortex_BA24 | 0.1 | 0.088 (0.004) |
| BMI | Brain_Anterior_cingulate_cortex_BA24 | 0.5 | 0.095 (0.004) |
| BMI | Brain_Anterior_cingulate_cortex_BA24 | 1 | 0.096 (0.004) |
| BMI | Brain_Anterior_cingulate_cortex_BA24 | All | 0.1 (0.004) |
| BMI | Brain_Caudate_basal_ganglia | 1e.06 | 0.032 (0.004) |
| BMI | Brain_Caudate_basal_ganglia | 1e.05 | 0.041 (0.004) |
| BMI | Brain_Caudate_basal_ganglia | 1e.04 | 0.05 (0.004) |
| BMI | Brain_Caudate_basal_ganglia | 0.001 | 0.058 (0.004) |
| BMI | Brain_Caudate_basal_ganglia | 0.01 | 0.071 (0.004) |
| BMI | Brain_Caudate_basal_ganglia | 0.05 | 0.083 (0.004) |
| BMI | Brain_Caudate_basal_ganglia | 0.1 | 0.088 (0.004) |
| BMI | Brain_Caudate_basal_ganglia | 0.5 | 0.098 (0.004) |
| BMI | Brain_Caudate_basal_ganglia | 1 | 0.099 (0.004) |
| BMI | Brain_Caudate_basal_ganglia | All | 0.102 (0.004) |
| BMI | Brain_Cerebellar_Hemisphere | 1e.06 | 0.045 (0.004) |
| BMI | Brain_Cerebellar_Hemisphere | 1e.05 | 0.046 (0.004) |
| BMI | Brain_Cerebellar_Hemisphere | 1e.04 | 0.056 (0.004) |
| BMI | Brain_Cerebellar_Hemisphere | 0.001 | 0.065 (0.004) |
| BMI | Brain_Cerebellar_Hemisphere | 0.01 | 0.076 (0.004) |
| BMI | Brain_Cerebellar_Hemisphere | 0.05 | 0.091 (0.004) |
| BMI | Brain_Cerebellar_Hemisphere | 0.1 | 0.094 (0.004) |
| BMI | Brain_Cerebellar_Hemisphere | 0.5 | 0.103 (0.004) |
| BMI | Brain_Cerebellar_Hemisphere | 1 | 0.105 (0.004) |
| BMI | Brain_Cerebellar_Hemisphere | All | 0.105 (0.004) |
| BMI | Brain_Cerebellum | 1e.06 | 0.046 (0.004) |
| BMI | Brain_Cerebellum | 1e.05 | 0.049 (0.004) |
| BMI | Brain_Cerebellum | 1e.04 | 0.057 (0.004) |
| BMI | Brain_Cerebellum | 0.001 | 0.064 (0.004) |
| BMI | Brain_Cerebellum | 0.01 | 0.077 (0.004) |
| BMI | Brain_Cerebellum | 0.05 | 0.095 (0.004) |
| BMI | Brain_Cerebellum | 0.1 | 0.099 (0.004) |
| BMI | Brain_Cerebellum | 0.5 | 0.108 (0.004) |
| BMI | Brain_Cerebellum | 1 | 0.108 (0.004) |
| BMI | Brain_Cerebellum | All | 0.11 (0.004) |
| BMI | Brain_Cortex | 1e.06 | 0.031 (0.004) |
| BMI | Brain_Cortex | 1e.05 | 0.037 (0.004) |
| BMI | Brain_Cortex | 1e.04 | 0.043 (0.004) |
| BMI | Brain_Cortex | 0.001 | 0.05 (0.004) |
| BMI | Brain_Cortex | 0.01 | 0.068 (0.004) |
| BMI | Brain_Cortex | 0.05 | 0.085 (0.004) |
| BMI | Brain_Cortex | 0.1 | 0.089 (0.004) |
| BMI | Brain_Cortex | 0.5 | 0.098 (0.004) |
| BMI | Brain_Cortex | 1 | 0.098 (0.004) |
| BMI | Brain_Cortex | All | 0.102 (0.004) |
| BMI | Brain_Frontal_Cortex_BA9 | 1e.06 | 0.032 (0.004) |
| BMI | Brain_Frontal_Cortex_BA9 | 1e.05 | 0.042 (0.004) |
| BMI | Brain_Frontal_Cortex_BA9 | 1e.04 | 0.045 (0.004) |
| BMI | Brain_Frontal_Cortex_BA9 | 0.001 | 0.055 (0.004) |
| BMI | Brain_Frontal_Cortex_BA9 | 0.01 | 0.068 (0.004) |
| BMI | Brain_Frontal_Cortex_BA9 | 0.05 | 0.078 (0.004) |
| BMI | Brain_Frontal_Cortex_BA9 | 0.1 | 0.086 (0.004) |
| BMI | Brain_Frontal_Cortex_BA9 | 0.5 | 0.091 (0.004) |
| BMI | Brain_Frontal_Cortex_BA9 | 1 | 0.092 (0.004) |
| BMI | Brain_Frontal_Cortex_BA9 | All | 0.098 (0.004) |
| BMI | Brain_Hippocampus | 1e.06 | 0.026 (0.004) |
| BMI | Brain_Hippocampus | 1e.05 | 0.032 (0.004) |
| BMI | Brain_Hippocampus | 1e.04 | 0.041 (0.004) |
| BMI | Brain_Hippocampus | 0.001 | 0.049 (0.004) |
| BMI | Brain_Hippocampus | 0.01 | 0.058 (0.004) |
| BMI | Brain_Hippocampus | 0.05 | 0.071 (0.004) |
| BMI | Brain_Hippocampus | 0.1 | 0.076 (0.004) |
| BMI | Brain_Hippocampus | 0.5 | 0.081 (0.004) |
| BMI | Brain_Hippocampus | 1 | 0.082 (0.004) |
| BMI | Brain_Hippocampus | All | 0.084 (0.004) |
| BMI | Brain_Hypothalamus | 1e.06 | 0.032 (0.004) |
| BMI | Brain_Hypothalamus | 1e.05 | 0.035 (0.004) |
| BMI | Brain_Hypothalamus | 1e.04 | 0.04 (0.004) |
| BMI | Brain_Hypothalamus | 0.001 | 0.046 (0.004) |
| BMI | Brain_Hypothalamus | 0.01 | 0.059 (0.004) |
| BMI | Brain_Hypothalamus | 0.05 | 0.072 (0.004) |
| BMI | Brain_Hypothalamus | 0.1 | 0.075 (0.004) |
| BMI | Brain_Hypothalamus | 0.5 | 0.08 (0.004) |
| BMI | Brain_Hypothalamus | 1 | 0.082 (0.004) |
| BMI | Brain_Hypothalamus | All | 0.082 (0.004) |
| BMI | Brain_Nucleus_accumbens_basal_ganglia | 1e.06 | 0.034 (0.004) |
| BMI | Brain_Nucleus_accumbens_basal_ganglia | 1e.05 | 0.043 (0.004) |
| BMI | Brain_Nucleus_accumbens_basal_ganglia | 1e.04 | 0.049 (0.004) |
| BMI | Brain_Nucleus_accumbens_basal_ganglia | 0.001 | 0.058 (0.004) |
| BMI | Brain_Nucleus_accumbens_basal_ganglia | 0.01 | 0.068 (0.004) |
| BMI | Brain_Nucleus_accumbens_basal_ganglia | 0.05 | 0.08 (0.004) |
| BMI | Brain_Nucleus_accumbens_basal_ganglia | 0.1 | 0.088 (0.004) |
| BMI | Brain_Nucleus_accumbens_basal_ganglia | 0.5 | 0.093 (0.004) |
| BMI | Brain_Nucleus_accumbens_basal_ganglia | 1 | 0.093 (0.004) |
| BMI | Brain_Nucleus_accumbens_basal_ganglia | All | 0.095 (0.004) |
| BMI | Brain_Putamen_basal_ganglia | 1e.06 | 0.033 (0.004) |
| BMI | Brain_Putamen_basal_ganglia | 1e.05 | 0.038 (0.004) |
| BMI | Brain_Putamen_basal_ganglia | 1e.04 | 0.047 (0.004) |
| BMI | Brain_Putamen_basal_ganglia | 0.001 | 0.054 (0.004) |
| BMI | Brain_Putamen_basal_ganglia | 0.01 | 0.066 (0.004) |
| BMI | Brain_Putamen_basal_ganglia | 0.05 | 0.077 (0.004) |
| BMI | Brain_Putamen_basal_ganglia | 0.1 | 0.085 (0.004) |
| BMI | Brain_Putamen_basal_ganglia | 0.5 | 0.093 (0.004) |
| BMI | Brain_Putamen_basal_ganglia | 1 | 0.094 (0.004) |
| BMI | Brain_Putamen_basal_ganglia | All | 0.096 (0.004) |
| BMI | Brain_Spinal_cord_cervical_c-1 | 1e.06 | 0.035 (0.004) |
| BMI | Brain_Spinal_cord_cervical_c-1 | 1e.05 | 0.041 (0.004) |
| BMI | Brain_Spinal_cord_cervical_c-1 | 1e.04 | 0.049 (0.004) |
| BMI | Brain_Spinal_cord_cervical_c-1 | 0.001 | 0.057 (0.004) |
| BMI | Brain_Spinal_cord_cervical_c-1 | 0.01 | 0.069 (0.004) |
| BMI | Brain_Spinal_cord_cervical_c-1 | 0.05 | 0.078 (0.004) |
| BMI | Brain_Spinal_cord_cervical_c-1 | 0.1 | 0.084 (0.004) |
| BMI | Brain_Spinal_cord_cervical_c-1 | 0.5 | 0.089 (0.004) |
| BMI | Brain_Spinal_cord_cervical_c-1 | 1 | 0.09 (0.004) |
| BMI | Brain_Spinal_cord_cervical_c-1 | All | 0.09 (0.004) |
| BMI | Brain_Substantia_nigra | 1e.06 | 0.031 (0.004) |
| BMI | Brain_Substantia_nigra | 1e.05 | 0.049 (0.004) |
| BMI | Brain_Substantia_nigra | 1e.04 | 0.052 (0.004) |
| BMI | Brain_Substantia_nigra | 0.001 | 0.055 (0.004) |
| BMI | Brain_Substantia_nigra | 0.01 | 0.065 (0.004) |
| BMI | Brain_Substantia_nigra | 0.05 | 0.074 (0.004) |
| BMI | Brain_Substantia_nigra | 0.1 | 0.078 (0.004) |
| BMI | Brain_Substantia_nigra | 0.5 | 0.083 (0.004) |
| BMI | Brain_Substantia_nigra | 1 | 0.082 (0.004) |
| BMI | Brain_Substantia_nigra | All | 0.083 (0.004) |
| BMI | Breast_Mammary_Tissue | 1e.06 | 0.042 (0.004) |
| BMI | Breast_Mammary_Tissue | 1e.05 | 0.049 (0.004) |
| BMI | Breast_Mammary_Tissue | 1e.04 | 0.054 (0.004) |
| BMI | Breast_Mammary_Tissue | 0.001 | 0.067 (0.004) |
| BMI | Breast_Mammary_Tissue | 0.01 | 0.079 (0.004) |
| BMI | Breast_Mammary_Tissue | 0.05 | 0.093 (0.004) |
| BMI | Breast_Mammary_Tissue | 0.1 | 0.1 (0.004) |
| BMI | Breast_Mammary_Tissue | 0.5 | 0.11 (0.004) |
| BMI | Breast_Mammary_Tissue | 1 | 0.11 (0.004) |
| BMI | Breast_Mammary_Tissue | All | 0.111 (0.004) |
| BMI | Cells_EBV-transformed_lymphocytes | 1e.06 | 0.037 (0.004) |
| BMI | Cells_EBV-transformed_lymphocytes | 1e.05 | 0.041 (0.004) |
| BMI | Cells_EBV-transformed_lymphocytes | 1e.04 | 0.047 (0.004) |
| BMI | Cells_EBV-transformed_lymphocytes | 0.001 | 0.06 (0.004) |
| BMI | Cells_EBV-transformed_lymphocytes | 0.01 | 0.071 (0.004) |
| BMI | Cells_EBV-transformed_lymphocytes | 0.05 | 0.085 (0.004) |
| BMI | Cells_EBV-transformed_lymphocytes | 0.1 | 0.09 (0.004) |
| BMI | Cells_EBV-transformed_lymphocytes | 0.5 | 0.097 (0.004) |
| BMI | Cells_EBV-transformed_lymphocytes | 1 | 0.097 (0.004) |
| BMI | Cells_EBV-transformed_lymphocytes | All | 0.097 (0.004) |
| BMI | Cells_Transformed_fibroblasts | 1e.06 | 0.042 (0.004) |
| BMI | Cells_Transformed_fibroblasts | 1e.05 | 0.05 (0.004) |
| BMI | Cells_Transformed_fibroblasts | 1e.04 | 0.056 (0.004) |
| BMI | Cells_Transformed_fibroblasts | 0.001 | 0.071 (0.004) |
| BMI | Cells_Transformed_fibroblasts | 0.01 | 0.088 (0.004) |
| BMI | Cells_Transformed_fibroblasts | 0.05 | 0.104 (0.004) |
| BMI | Cells_Transformed_fibroblasts | 0.1 | 0.109 (0.004) |
| BMI | Cells_Transformed_fibroblasts | 0.5 | 0.119 (0.004) |
| BMI | Cells_Transformed_fibroblasts | 1 | 0.121 (0.004) |
| BMI | Cells_Transformed_fibroblasts | All | 0.124 (0.004) |
| BMI | CMC.BRAIN.RNASEQ | 1e.06 | 0.063 (0.004) |
| BMI | CMC.BRAIN.RNASEQ | 1e.05 | 0.067 (0.004) |
| BMI | CMC.BRAIN.RNASEQ | 1e.04 | 0.071 (0.004) |
| BMI | CMC.BRAIN.RNASEQ | 0.001 | 0.079 (0.004) |
| BMI | CMC.BRAIN.RNASEQ | 0.01 | 0.092 (0.004) |
| BMI | CMC.BRAIN.RNASEQ | 0.05 | 0.109 (0.004) |
| BMI | CMC.BRAIN.RNASEQ | 0.1 | 0.115 (0.004) |
| BMI | CMC.BRAIN.RNASEQ | 0.5 | 0.125 (0.004) |
| BMI | CMC.BRAIN.RNASEQ | 1 | 0.125 (0.004) |
| BMI | CMC.BRAIN.RNASEQ | All | 0.126 (0.004) |
| BMI | CMC.BRAIN.RNASEQ_SPLICING | 1e.06 | 0.046 (0.004) |
| BMI | CMC.BRAIN.RNASEQ_SPLICING | 1e.05 | 0.053 (0.004) |
| BMI | CMC.BRAIN.RNASEQ_SPLICING | 1e.04 | 0.063 (0.004) |
| BMI | CMC.BRAIN.RNASEQ_SPLICING | 0.001 | 0.073 (0.004) |
| BMI | CMC.BRAIN.RNASEQ_SPLICING | 0.01 | 0.086 (0.004) |
| BMI | CMC.BRAIN.RNASEQ_SPLICING | 0.05 | 0.094 (0.004) |
| BMI | CMC.BRAIN.RNASEQ_SPLICING | 0.1 | 0.099 (0.004) |
| BMI | CMC.BRAIN.RNASEQ_SPLICING | 0.5 | 0.106 (0.004) |
| BMI | CMC.BRAIN.RNASEQ_SPLICING | 1 | 0.106 (0.004) |
| BMI | CMC.BRAIN.RNASEQ_SPLICING | All | 0.109 (0.004) |
| BMI | Colon_Sigmoid | 1e.06 | 0.033 (0.004) |
| BMI | Colon_Sigmoid | 1e.05 | 0.039 (0.004) |
| BMI | Colon_Sigmoid | 1e.04 | 0.041 (0.004) |
| BMI | Colon_Sigmoid | 0.001 | 0.055 (0.004) |
| BMI | Colon_Sigmoid | 0.01 | 0.071 (0.004) |
| BMI | Colon_Sigmoid | 0.05 | 0.082 (0.004) |
| BMI | Colon_Sigmoid | 0.1 | 0.087 (0.004) |
| BMI | Colon_Sigmoid | 0.5 | 0.095 (0.004) |
| BMI | Colon_Sigmoid | 1 | 0.095 (0.004) |
| BMI | Colon_Sigmoid | All | 0.095 (0.004) |
| BMI | Colon_Transverse | 1e.06 | 0.036 (0.004) |
| BMI | Colon_Transverse | 1e.05 | 0.04 (0.004) |
| BMI | Colon_Transverse | 1e.04 | 0.048 (0.004) |
| BMI | Colon_Transverse | 0.001 | 0.058 (0.004) |
| BMI | Colon_Transverse | 0.01 | 0.071 (0.004) |
| BMI | Colon_Transverse | 0.05 | 0.08 (0.004) |
| BMI | Colon_Transverse | 0.1 | 0.089 (0.004) |
| BMI | Colon_Transverse | 0.5 | 0.1 (0.004) |
| BMI | Colon_Transverse | 1 | 0.1 (0.004) |
| BMI | Colon_Transverse | All | 0.102 (0.004) |
| BMI | Esophagus_Gastroesophageal_Junction | 1e.06 | 0.034 (0.004) |
| BMI | Esophagus_Gastroesophageal_Junction | 1e.05 | 0.036 (0.004) |
| BMI | Esophagus_Gastroesophageal_Junction | 1e.04 | 0.044 (0.004) |
| BMI | Esophagus_Gastroesophageal_Junction | 0.001 | 0.056 (0.004) |
| BMI | Esophagus_Gastroesophageal_Junction | 0.01 | 0.072 (0.004) |
| BMI | Esophagus_Gastroesophageal_Junction | 0.05 | 0.084 (0.004) |
| BMI | Esophagus_Gastroesophageal_Junction | 0.1 | 0.09 (0.004) |
| BMI | Esophagus_Gastroesophageal_Junction | 0.5 | 0.098 (0.004) |
| BMI | Esophagus_Gastroesophageal_Junction | 1 | 0.099 (0.004) |
| BMI | Esophagus_Gastroesophageal_Junction | All | 0.102 (0.004) |
| BMI | Esophagus_Mucosa | 1e.06 | 0.042 (0.004) |
| BMI | Esophagus_Mucosa | 1e.05 | 0.049 (0.004) |
| BMI | Esophagus_Mucosa | 1e.04 | 0.059 (0.004) |
| BMI | Esophagus_Mucosa | 0.001 | 0.071 (0.004) |
| BMI | Esophagus_Mucosa | 0.01 | 0.086 (0.004) |
| BMI | Esophagus_Mucosa | 0.05 | 0.102 (0.004) |
| BMI | Esophagus_Mucosa | 0.1 | 0.11 (0.004) |
| BMI | Esophagus_Mucosa | 0.5 | 0.119 (0.004) |
| BMI | Esophagus_Mucosa | 1 | 0.119 (0.004) |
| BMI | Esophagus_Mucosa | All | 0.119 (0.004) |
| BMI | Esophagus_Muscularis | 1e.06 | 0.041 (0.004) |
| BMI | Esophagus_Muscularis | 1e.05 | 0.05 (0.004) |
| BMI | Esophagus_Muscularis | 1e.04 | 0.057 (0.004) |
| BMI | Esophagus_Muscularis | 0.001 | 0.069 (0.004) |
| BMI | Esophagus_Muscularis | 0.01 | 0.087 (0.004) |
| BMI | Esophagus_Muscularis | 0.05 | 0.101 (0.004) |
| BMI | Esophagus_Muscularis | 0.1 | 0.107 (0.004) |
| BMI | Esophagus_Muscularis | 0.5 | 0.119 (0.004) |
| BMI | Esophagus_Muscularis | 1 | 0.12 (0.004) |
| BMI | Esophagus_Muscularis | All | 0.12 (0.004) |
| BMI | Heart_Atrial_Appendage | 1e.06 | 0.045 (0.004) |
| BMI | Heart_Atrial_Appendage | 1e.05 | 0.049 (0.004) |
| BMI | Heart_Atrial_Appendage | 1e.04 | 0.054 (0.004) |
| BMI | Heart_Atrial_Appendage | 0.001 | 0.069 (0.004) |
| BMI | Heart_Atrial_Appendage | 0.01 | 0.086 (0.004) |
| BMI | Heart_Atrial_Appendage | 0.05 | 0.101 (0.004) |
| BMI | Heart_Atrial_Appendage | 0.1 | 0.108 (0.004) |
| BMI | Heart_Atrial_Appendage | 0.5 | 0.115 (0.004) |
| BMI | Heart_Atrial_Appendage | 1 | 0.115 (0.004) |
| BMI | Heart_Atrial_Appendage | All | 0.115 (0.004) |
| BMI | Heart_Left_Ventricle | 1e.06 | 0.047 (0.004) |
| BMI | Heart_Left_Ventricle | 1e.05 | 0.051 (0.004) |
| BMI | Heart_Left_Ventricle | 1e.04 | 0.057 (0.004) |
| BMI | Heart_Left_Ventricle | 0.001 | 0.067 (0.004) |
| BMI | Heart_Left_Ventricle | 0.01 | 0.082 (0.004) |
| BMI | Heart_Left_Ventricle | 0.05 | 0.096 (0.004) |
| BMI | Heart_Left_Ventricle | 0.1 | 0.102 (0.004) |
| BMI | Heart_Left_Ventricle | 0.5 | 0.112 (0.004) |
| BMI | Heart_Left_Ventricle | 1 | 0.112 (0.004) |
| BMI | Heart_Left_Ventricle | All | 0.112 (0.004) |
| BMI | Liver | 1e.06 | 0.037 (0.004) |
| BMI | Liver | 1e.05 | 0.041 (0.004) |
| BMI | Liver | 1e.04 | 0.05 (0.004) |
| BMI | Liver | 0.001 | 0.055 (0.004) |
| BMI | Liver | 0.01 | 0.065 (0.004) |
| BMI | Liver | 0.05 | 0.078 (0.004) |
| BMI | Liver | 0.1 | 0.083 (0.004) |
| BMI | Liver | 0.5 | 0.091 (0.004) |
| BMI | Liver | 1 | 0.09 (0.004) |
| BMI | Liver | All | 0.09 (0.004) |
| BMI | Lung | 1e.06 | 0.047 (0.004) |
| BMI | Lung | 1e.05 | 0.052 (0.004) |
| BMI | Lung | 1e.04 | 0.057 (0.004) |
| BMI | Lung | 0.001 | 0.065 (0.004) |
| BMI | Lung | 0.01 | 0.082 (0.004) |
| BMI | Lung | 0.05 | 0.101 (0.004) |
| BMI | Lung | 0.1 | 0.107 (0.004) |
| BMI | Lung | 0.5 | 0.117 (0.004) |
| BMI | Lung | 1 | 0.118 (0.004) |
| BMI | Lung | All | 0.12 (0.004) |
| BMI | METSIM.ADIPOSE.RNASEQ | 1e.06 | 0.041 (0.004) |
| BMI | METSIM.ADIPOSE.RNASEQ | 1e.05 | 0.052 (0.004) |
| BMI | METSIM.ADIPOSE.RNASEQ | 1e.04 | 0.058 (0.004) |
| BMI | METSIM.ADIPOSE.RNASEQ | 0.001 | 0.064 (0.004) |
| BMI | METSIM.ADIPOSE.RNASEQ | 0.01 | 0.079 (0.004) |
| BMI | METSIM.ADIPOSE.RNASEQ | 0.05 | 0.09 (0.004) |
| BMI | METSIM.ADIPOSE.RNASEQ | 0.1 | 0.099 (0.004) |
| BMI | METSIM.ADIPOSE.RNASEQ | 0.5 | 0.107 (0.004) |
| BMI | METSIM.ADIPOSE.RNASEQ | 1 | 0.108 (0.004) |
| BMI | METSIM.ADIPOSE.RNASEQ | All | 0.109 (0.004) |
| BMI | Minor_Salivary_Gland | 1e.06 | 0.031 (0.004) |
| BMI | Minor_Salivary_Gland | 1e.05 | 0.034 (0.004) |
| BMI | Minor_Salivary_Gland | 1e.04 | 0.042 (0.004) |
| BMI | Minor_Salivary_Gland | 0.001 | 0.054 (0.004) |
| BMI | Minor_Salivary_Gland | 0.01 | 0.065 (0.004) |
| BMI | Minor_Salivary_Gland | 0.05 | 0.075 (0.004) |
| BMI | Minor_Salivary_Gland | 0.1 | 0.079 (0.004) |
| BMI | Minor_Salivary_Gland | 0.5 | 0.086 (0.004) |
| BMI | Minor_Salivary_Gland | 1 | 0.086 (0.004) |
| BMI | Minor_Salivary_Gland | All | 0.085 (0.004) |
| BMI | Muscle_Skeletal | 1e.06 | 0.043 (0.004) |
| BMI | Muscle_Skeletal | 1e.05 | 0.047 (0.004) |
| BMI | Muscle_Skeletal | 1e.04 | 0.059 (0.004) |
| BMI | Muscle_Skeletal | 0.001 | 0.072 (0.004) |
| BMI | Muscle_Skeletal | 0.01 | 0.088 (0.004) |
| BMI | Muscle_Skeletal | 0.05 | 0.104 (0.004) |
| BMI | Muscle_Skeletal | 0.1 | 0.109 (0.004) |
| BMI | Muscle_Skeletal | 0.5 | 0.118 (0.004) |
| BMI | Muscle_Skeletal | 1 | 0.12 (0.004) |
| BMI | Muscle_Skeletal | All | 0.12 (0.004) |
| BMI | Nerve_Tibial | 1e.06 | 0.048 (0.004) |
| BMI | Nerve_Tibial | 1e.05 | 0.057 (0.004) |
| BMI | Nerve_Tibial | 1e.04 | 0.065 (0.004) |
| BMI | Nerve_Tibial | 0.001 | 0.077 (0.004) |
| BMI | Nerve_Tibial | 0.01 | 0.096 (0.004) |
| BMI | Nerve_Tibial | 0.05 | 0.111 (0.004) |
| BMI | Nerve_Tibial | 0.1 | 0.117 (0.004) |
| BMI | Nerve_Tibial | 0.5 | 0.125 (0.004) |
| BMI | Nerve_Tibial | 1 | 0.126 (0.004) |
| BMI | Nerve_Tibial | All | 0.127 (0.004) |
| BMI | NTR.BLOOD.RNAARR | 1e.06 | 0.039 (0.004) |
| BMI | NTR.BLOOD.RNAARR | 1e.05 | 0.044 (0.004) |
| BMI | NTR.BLOOD.RNAARR | 1e.04 | 0.052 (0.004) |
| BMI | NTR.BLOOD.RNAARR | 0.001 | 0.06 (0.004) |
| BMI | NTR.BLOOD.RNAARR | 0.01 | 0.071 (0.004) |
| BMI | NTR.BLOOD.RNAARR | 0.05 | 0.082 (0.004) |
| BMI | NTR.BLOOD.RNAARR | 0.1 | 0.085 (0.004) |
| BMI | NTR.BLOOD.RNAARR | 0.5 | 0.091 (0.004) |
| BMI | NTR.BLOOD.RNAARR | 1 | 0.092 (0.004) |
| BMI | NTR.BLOOD.RNAARR | All | 0.094 (0.004) |
| BMI | Ovary | 1e.06 | 0.036 (0.004) |
| BMI | Ovary | 1e.05 | 0.038 (0.004) |
| BMI | Ovary | 1e.04 | 0.042 (0.004) |
| BMI | Ovary | 0.001 | 0.049 (0.004) |
| BMI | Ovary | 0.01 | 0.057 (0.004) |
| BMI | Ovary | 0.05 | 0.065 (0.004) |
| BMI | Ovary | 0.1 | 0.071 (0.004) |
| BMI | Ovary | 0.5 | 0.08 (0.004) |
| BMI | Ovary | 1 | 0.08 (0.004) |
| BMI | Ovary | All | 0.084 (0.004) |
| BMI | Pancreas | 1e.06 | 0.046 (0.004) |
| BMI | Pancreas | 1e.05 | 0.052 (0.004) |
| BMI | Pancreas | 1e.04 | 0.059 (0.004) |
| BMI | Pancreas | 0.001 | 0.07 (0.004) |
| BMI | Pancreas | 0.01 | 0.088 (0.004) |
| BMI | Pancreas | 0.05 | 0.101 (0.004) |
| BMI | Pancreas | 0.1 | 0.107 (0.004) |
| BMI | Pancreas | 0.5 | 0.115 (0.004) |
| BMI | Pancreas | 1 | 0.115 (0.004) |
| BMI | Pancreas | All | 0.116 (0.004) |
| BMI | Pituitary | 1e.06 | 0.031 (0.004) |
| BMI | Pituitary | 1e.05 | 0.034 (0.004) |
| BMI | Pituitary | 1e.04 | 0.043 (0.004) |
| BMI | Pituitary | 0.001 | 0.053 (0.004) |
| BMI | Pituitary | 0.01 | 0.069 (0.004) |
| BMI | Pituitary | 0.05 | 0.082 (0.004) |
| BMI | Pituitary | 0.1 | 0.088 (0.004) |
| BMI | Pituitary | 0.5 | 0.095 (0.004) |
| BMI | Pituitary | 1 | 0.095 (0.004) |
| BMI | Pituitary | All | 0.099 (0.004) |
| BMI | Prostate | 1e.06 | 0.028 (0.004) |
| BMI | Prostate | 1e.05 | 0.031 (0.004) |
| BMI | Prostate | 1e.04 | 0.041 (0.004) |
| BMI | Prostate | 0.001 | 0.054 (0.004) |
| BMI | Prostate | 0.01 | 0.067 (0.004) |
| BMI | Prostate | 0.05 | 0.078 (0.004) |
| BMI | Prostate | 0.1 | 0.083 (0.004) |
| BMI | Prostate | 0.5 | 0.089 (0.004) |
| BMI | Prostate | 1 | 0.09 (0.004) |
| BMI | Prostate | All | 0.093 (0.004) |
| BMI | Skin_Not_Sun_Exposed_Suprapubic | 1e.06 | 0.045 (0.004) |
| BMI | Skin_Not_Sun_Exposed_Suprapubic | 1e.05 | 0.049 (0.004) |
| BMI | Skin_Not_Sun_Exposed_Suprapubic | 1e.04 | 0.059 (0.004) |
| BMI | Skin_Not_Sun_Exposed_Suprapubic | 0.001 | 0.072 (0.004) |
| BMI | Skin_Not_Sun_Exposed_Suprapubic | 0.01 | 0.086 (0.004) |
| BMI | Skin_Not_Sun_Exposed_Suprapubic | 0.05 | 0.099 (0.004) |
| BMI | Skin_Not_Sun_Exposed_Suprapubic | 0.1 | 0.106 (0.004) |
| BMI | Skin_Not_Sun_Exposed_Suprapubic | 0.5 | 0.117 (0.004) |
| BMI | Skin_Not_Sun_Exposed_Suprapubic | 1 | 0.118 (0.004) |
| BMI | Skin_Not_Sun_Exposed_Suprapubic | All | 0.118 (0.004) |
| BMI | Skin_Sun_Exposed_Lower_leg | 1e.06 | 0.044 (0.004) |
| BMI | Skin_Sun_Exposed_Lower_leg | 1e.05 | 0.053 (0.004) |
| BMI | Skin_Sun_Exposed_Lower_leg | 1e.04 | 0.06 (0.004) |
| BMI | Skin_Sun_Exposed_Lower_leg | 0.001 | 0.073 (0.004) |
| BMI | Skin_Sun_Exposed_Lower_leg | 0.01 | 0.088 (0.004) |
| BMI | Skin_Sun_Exposed_Lower_leg | 0.05 | 0.1 (0.004) |
| BMI | Skin_Sun_Exposed_Lower_leg | 0.1 | 0.106 (0.004) |
| BMI | Skin_Sun_Exposed_Lower_leg | 0.5 | 0.118 (0.004) |
| BMI | Skin_Sun_Exposed_Lower_leg | 1 | 0.119 (0.004) |
| BMI | Skin_Sun_Exposed_Lower_leg | All | 0.12 (0.004) |
| BMI | Small_Intestine_Terminal_Ileum | 1e.06 | 0.036 (0.004) |
| BMI | Small_Intestine_Terminal_Ileum | 1e.05 | 0.039 (0.004) |
| BMI | Small_Intestine_Terminal_Ileum | 1e.04 | 0.049 (0.004) |
| BMI | Small_Intestine_Terminal_Ileum | 0.001 | 0.059 (0.004) |
| BMI | Small_Intestine_Terminal_Ileum | 0.01 | 0.072 (0.004) |
| BMI | Small_Intestine_Terminal_Ileum | 0.05 | 0.083 (0.004) |
| BMI | Small_Intestine_Terminal_Ileum | 0.1 | 0.086 (0.004) |
| BMI | Small_Intestine_Terminal_Ileum | 0.5 | 0.094 (0.004) |
| BMI | Small_Intestine_Terminal_Ileum | 1 | 0.095 (0.004) |
| BMI | Small_Intestine_Terminal_Ileum | All | 0.095 (0.004) |
| BMI | Spleen | 1e.06 | 0.035 (0.004) |
| BMI | Spleen | 1e.05 | 0.038 (0.004) |
| BMI | Spleen | 1e.04 | 0.048 (0.004) |
| BMI | Spleen | 0.001 | 0.064 (0.004) |
| BMI | Spleen | 0.01 | 0.079 (0.004) |
| BMI | Spleen | 0.05 | 0.088 (0.004) |
| BMI | Spleen | 0.1 | 0.096 (0.004) |
| BMI | Spleen | 0.5 | 0.105 (0.004) |
| BMI | Spleen | 1 | 0.104 (0.004) |
| BMI | Spleen | All | 0.108 (0.004) |
| BMI | Stomach | 1e.06 | 0.032 (0.004) |
| BMI | Stomach | 1e.05 | 0.038 (0.004) |
| BMI | Stomach | 1e.04 | 0.045 (0.004) |
| BMI | Stomach | 0.001 | 0.055 (0.004) |
| BMI | Stomach | 0.01 | 0.074 (0.004) |
| BMI | Stomach | 0.05 | 0.089 (0.004) |
| BMI | Stomach | 0.1 | 0.095 (0.004) |
| BMI | Stomach | 0.5 | 0.106 (0.004) |
| BMI | Stomach | 1 | 0.106 (0.004) |
| BMI | Stomach | All | 0.111 (0.004) |
| BMI | Testis | 1e.06 | 0.035 (0.004) |
| BMI | Testis | 1e.05 | 0.038 (0.004) |
| BMI | Testis | 1e.04 | 0.047 (0.004) |
| BMI | Testis | 0.001 | 0.059 (0.004) |
| BMI | Testis | 0.01 | 0.078 (0.004) |
| BMI | Testis | 0.05 | 0.099 (0.004) |
| BMI | Testis | 0.1 | 0.108 (0.004) |
| BMI | Testis | 0.5 | 0.118 (0.004) |
| BMI | Testis | 1 | 0.119 (0.004) |
| BMI | Testis | All | 0.125 (0.004) |
| BMI | Thyroid | 1e.06 | 0.039 (0.004) |
| BMI | Thyroid | 1e.05 | 0.047 (0.004) |
| BMI | Thyroid | 1e.04 | 0.056 (0.004) |
| BMI | Thyroid | 0.001 | 0.07 (0.004) |
| BMI | Thyroid | 0.01 | 0.089 (0.004) |
| BMI | Thyroid | 0.05 | 0.107 (0.004) |
| BMI | Thyroid | 0.1 | 0.114 (0.004) |
| BMI | Thyroid | 0.5 | 0.125 (0.004) |
| BMI | Thyroid | 1 | 0.126 (0.004) |
| BMI | Thyroid | All | 0.128 (0.004) |
| BMI | Uterus | 1e.06 | 0.03 (0.004) |
| BMI | Uterus | 1e.05 | 0.036 (0.004) |
| BMI | Uterus | 1e.04 | 0.038 (0.004) |
| BMI | Uterus | 0.001 | 0.046 (0.004) |
| BMI | Uterus | 0.01 | 0.056 (0.004) |
| BMI | Uterus | 0.05 | 0.068 (0.004) |
| BMI | Uterus | 0.1 | 0.074 (0.004) |
| BMI | Uterus | 0.5 | 0.081 (0.004) |
| BMI | Uterus | 1 | 0.081 (0.004) |
| BMI | Uterus | All | 0.083 (0.004) |
| BMI | Vagina | 1e.06 | 0.035 (0.004) |
| BMI | Vagina | 1e.05 | 0.037 (0.004) |
| BMI | Vagina | 1e.04 | 0.04 (0.004) |
| BMI | Vagina | 0.001 | 0.054 (0.004) |
| BMI | Vagina | 0.01 | 0.065 (0.004) |
| BMI | Vagina | 0.05 | 0.075 (0.004) |
| BMI | Vagina | 0.1 | 0.079 (0.004) |
| BMI | Vagina | 0.5 | 0.086 (0.004) |
| BMI | Vagina | 1 | 0.087 (0.004) |
| BMI | Vagina | All | 0.088 (0.004) |
| BMI | Whole_Blood | 1e.06 | 0.038 (0.004) |
| BMI | Whole_Blood | 1e.05 | 0.048 (0.004) |
| BMI | Whole_Blood | 1e.04 | 0.053 (0.004) |
| BMI | Whole_Blood | 0.001 | 0.065 (0.004) |
| BMI | Whole_Blood | 0.01 | 0.08 (0.004) |
| BMI | Whole_Blood | 0.05 | 0.091 (0.004) |
| BMI | Whole_Blood | 0.1 | 0.096 (0.004) |
| BMI | Whole_Blood | 0.5 | 0.106 (0.004) |
| BMI | Whole_Blood | 1 | 0.108 (0.004) |
| BMI | Whole_Blood | All | 0.11 (0.004) |
| BMI | YFS.BLOOD.RNAARR | 1e.06 | 0.045 (0.004) |
| BMI | YFS.BLOOD.RNAARR | 1e.05 | 0.05 (0.004) |
| BMI | YFS.BLOOD.RNAARR | 1e.04 | 0.057 (0.004) |
| BMI | YFS.BLOOD.RNAARR | 0.001 | 0.067 (0.004) |
| BMI | YFS.BLOOD.RNAARR | 0.01 | 0.079 (0.004) |
| BMI | YFS.BLOOD.RNAARR | 0.05 | 0.092 (0.004) |
| BMI | YFS.BLOOD.RNAARR | 0.1 | 0.098 (0.004) |
| BMI | YFS.BLOOD.RNAARR | 0.5 | 0.107 (0.004) |
| BMI | YFS.BLOOD.RNAARR | 1 | 0.108 (0.004) |
| BMI | YFS.BLOOD.RNAARR | All | 0.107 (0.004) |
| Height | Adipose_Subcutaneous | 1e.06 | 0.143 (0.004) |
| Height | Adipose_Subcutaneous | 1e.05 | 0.149 (0.004) |
| Height | Adipose_Subcutaneous | 1e.04 | 0.155 (0.004) |
| Height | Adipose_Subcutaneous | 0.001 | 0.16 (0.004) |
| Height | Adipose_Subcutaneous | 0.01 | 0.169 (0.004) |
| Height | Adipose_Subcutaneous | 0.05 | 0.174 (0.004) |
| Height | Adipose_Subcutaneous | 0.1 | 0.176 (0.004) |
| Height | Adipose_Subcutaneous | 0.5 | 0.178 (0.004) |
| Height | Adipose_Subcutaneous | 1 | 0.178 (0.004) |
| Height | Adipose_Subcutaneous | All | 0.179 (0.004) |
| Height | Adipose_Visceral_Omentum | 1e.06 | 0.128 (0.004) |
| Height | Adipose_Visceral_Omentum | 1e.05 | 0.135 (0.004) |
| Height | Adipose_Visceral_Omentum | 1e.04 | 0.141 (0.004) |
| Height | Adipose_Visceral_Omentum | 0.001 | 0.148 (0.004) |
| Height | Adipose_Visceral_Omentum | 0.01 | 0.156 (0.004) |
| Height | Adipose_Visceral_Omentum | 0.05 | 0.16 (0.004) |
| Height | Adipose_Visceral_Omentum | 0.1 | 0.161 (0.004) |
| Height | Adipose_Visceral_Omentum | 0.5 | 0.164 (0.004) |
| Height | Adipose_Visceral_Omentum | 1 | 0.164 (0.004) |
| Height | Adipose_Visceral_Omentum | All | 0.164 (0.004) |
| Height | Adrenal_Gland | 1e.06 | 0.115 (0.004) |
| Height | Adrenal_Gland | 1e.05 | 0.12 (0.004) |
| Height | Adrenal_Gland | 1e.04 | 0.128 (0.004) |
| Height | Adrenal_Gland | 0.001 | 0.134 (0.004) |
| Height | Adrenal_Gland | 0.01 | 0.14 (0.004) |
| Height | Adrenal_Gland | 0.05 | 0.144 (0.004) |
| Height | Adrenal_Gland | 0.1 | 0.146 (0.004) |
| Height | Adrenal_Gland | 0.5 | 0.148 (0.004) |
| Height | Adrenal_Gland | 1 | 0.147 (0.004) |
| Height | Adrenal_Gland | All | 0.148 (0.004) |
| Height | Artery_Aorta | 1e.06 | 0.125 (0.004) |
| Height | Artery_Aorta | 1e.05 | 0.132 (0.004) |
| Height | Artery_Aorta | 1e.04 | 0.137 (0.004) |
| Height | Artery_Aorta | 0.001 | 0.143 (0.004) |
| Height | Artery_Aorta | 0.01 | 0.152 (0.004) |
| Height | Artery_Aorta | 0.05 | 0.156 (0.004) |
| Height | Artery_Aorta | 0.1 | 0.158 (0.004) |
| Height | Artery_Aorta | 0.5 | 0.16 (0.004) |
| Height | Artery_Aorta | 1 | 0.161 (0.004) |
| Height | Artery_Aorta | All | 0.16 (0.004) |
| Height | Artery_Coronary | 1e.06 | 0.105 (0.004) |
| Height | Artery_Coronary | 1e.05 | 0.114 (0.004) |
| Height | Artery_Coronary | 1e.04 | 0.118 (0.004) |
| Height | Artery_Coronary | 0.001 | 0.123 (0.004) |
| Height | Artery_Coronary | 0.01 | 0.128 (0.004) |
| Height | Artery_Coronary | 0.05 | 0.131 (0.004) |
| Height | Artery_Coronary | 0.1 | 0.133 (0.004) |
| Height | Artery_Coronary | 0.5 | 0.135 (0.004) |
| Height | Artery_Coronary | 1 | 0.135 (0.004) |
| Height | Artery_Coronary | All | 0.136 (0.004) |
| Height | Artery_Tibial | 1e.06 | 0.142 (0.004) |
| Height | Artery_Tibial | 1e.05 | 0.149 (0.004) |
| Height | Artery_Tibial | 1e.04 | 0.156 (0.004) |
| Height | Artery_Tibial | 0.001 | 0.162 (0.004) |
| Height | Artery_Tibial | 0.01 | 0.17 (0.004) |
| Height | Artery_Tibial | 0.05 | 0.175 (0.004) |
| Height | Artery_Tibial | 0.1 | 0.178 (0.004) |
| Height | Artery_Tibial | 0.5 | 0.18 (0.004) |
| Height | Artery_Tibial | 1 | 0.18 (0.004) |
| Height | Artery_Tibial | All | 0.18 (0.004) |
| Height | Brain_Amygdala | 1e.06 | 0.095 (0.004) |
| Height | Brain_Amygdala | 1e.05 | 0.101 (0.004) |
| Height | Brain_Amygdala | 1e.04 | 0.102 (0.004) |
| Height | Brain_Amygdala | 0.001 | 0.105 (0.004) |
| Height | Brain_Amygdala | 0.01 | 0.107 (0.004) |
| Height | Brain_Amygdala | 0.05 | 0.112 (0.004) |
| Height | Brain_Amygdala | 0.1 | 0.113 (0.004) |
| Height | Brain_Amygdala | 0.5 | 0.113 (0.004) |
| Height | Brain_Amygdala | 1 | 0.113 (0.004) |
| Height | Brain_Amygdala | All | 0.114 (0.004) |
| Height | Brain_Anterior_cingulate_cortex_BA24 | 1e.06 | 0.101 (0.004) |
| Height | Brain_Anterior_cingulate_cortex_BA24 | 1e.05 | 0.105 (0.004) |
| Height | Brain_Anterior_cingulate_cortex_BA24 | 1e.04 | 0.109 (0.004) |
| Height | Brain_Anterior_cingulate_cortex_BA24 | 0.001 | 0.112 (0.004) |
| Height | Brain_Anterior_cingulate_cortex_BA24 | 0.01 | 0.118 (0.004) |
| Height | Brain_Anterior_cingulate_cortex_BA24 | 0.05 | 0.122 (0.004) |
| Height | Brain_Anterior_cingulate_cortex_BA24 | 0.1 | 0.124 (0.004) |
| Height | Brain_Anterior_cingulate_cortex_BA24 | 0.5 | 0.126 (0.004) |
| Height | Brain_Anterior_cingulate_cortex_BA24 | 1 | 0.126 (0.004) |
| Height | Brain_Anterior_cingulate_cortex_BA24 | All | 0.126 (0.004) |
| Height | Brain_Caudate_basal_ganglia | 1e.06 | 0.102 (0.004) |
| Height | Brain_Caudate_basal_ganglia | 1e.05 | 0.109 (0.004) |
| Height | Brain_Caudate_basal_ganglia | 1e.04 | 0.113 (0.004) |
| Height | Brain_Caudate_basal_ganglia | 0.001 | 0.116 (0.004) |
| Height | Brain_Caudate_basal_ganglia | 0.01 | 0.125 (0.004) |
| Height | Brain_Caudate_basal_ganglia | 0.05 | 0.129 (0.004) |
| Height | Brain_Caudate_basal_ganglia | 0.1 | 0.131 (0.004) |
| Height | Brain_Caudate_basal_ganglia | 0.5 | 0.132 (0.004) |
| Height | Brain_Caudate_basal_ganglia | 1 | 0.132 (0.004) |
| Height | Brain_Caudate_basal_ganglia | All | 0.132 (0.004) |
| Height | Brain_Cerebellar_Hemisphere | 1e.06 | 0.108 (0.004) |
| Height | Brain_Cerebellar_Hemisphere | 1e.05 | 0.116 (0.004) |
| Height | Brain_Cerebellar_Hemisphere | 1e.04 | 0.117 (0.004) |
| Height | Brain_Cerebellar_Hemisphere | 0.001 | 0.124 (0.004) |
| Height | Brain_Cerebellar_Hemisphere | 0.01 | 0.13 (0.004) |
| Height | Brain_Cerebellar_Hemisphere | 0.05 | 0.132 (0.004) |
| Height | Brain_Cerebellar_Hemisphere | 0.1 | 0.134 (0.004) |
| Height | Brain_Cerebellar_Hemisphere | 0.5 | 0.134 (0.004) |
| Height | Brain_Cerebellar_Hemisphere | 1 | 0.134 (0.004) |
| Height | Brain_Cerebellar_Hemisphere | All | 0.137 (0.004) |
| Height | Brain_Cerebellum | 1e.06 | 0.112 (0.004) |
| Height | Brain_Cerebellum | 1e.05 | 0.12 (0.004) |
| Height | Brain_Cerebellum | 1e.04 | 0.124 (0.004) |
| Height | Brain_Cerebellum | 0.001 | 0.128 (0.004) |
| Height | Brain_Cerebellum | 0.01 | 0.134 (0.004) |
| Height | Brain_Cerebellum | 0.05 | 0.14 (0.004) |
| Height | Brain_Cerebellum | 0.1 | 0.142 (0.004) |
| Height | Brain_Cerebellum | 0.5 | 0.145 (0.004) |
| Height | Brain_Cerebellum | 1 | 0.145 (0.004) |
| Height | Brain_Cerebellum | All | 0.146 (0.004) |
| Height | Brain_Cortex | 1e.06 | 0.109 (0.004) |
| Height | Brain_Cortex | 1e.05 | 0.115 (0.004) |
| Height | Brain_Cortex | 1e.04 | 0.119 (0.004) |
| Height | Brain_Cortex | 0.001 | 0.125 (0.004) |
| Height | Brain_Cortex | 0.01 | 0.13 (0.004) |
| Height | Brain_Cortex | 0.05 | 0.134 (0.004) |
| Height | Brain_Cortex | 0.1 | 0.136 (0.004) |
| Height | Brain_Cortex | 0.5 | 0.138 (0.004) |
| Height | Brain_Cortex | 1 | 0.138 (0.004) |
| Height | Brain_Cortex | All | 0.138 (0.004) |
| Height | Brain_Frontal_Cortex_BA9 | 1e.06 | 0.106 (0.004) |
| Height | Brain_Frontal_Cortex_BA9 | 1e.05 | 0.114 (0.004) |
| Height | Brain_Frontal_Cortex_BA9 | 1e.04 | 0.117 (0.004) |
| Height | Brain_Frontal_Cortex_BA9 | 0.001 | 0.12 (0.004) |
| Height | Brain_Frontal_Cortex_BA9 | 0.01 | 0.127 (0.004) |
| Height | Brain_Frontal_Cortex_BA9 | 0.05 | 0.131 (0.004) |
| Height | Brain_Frontal_Cortex_BA9 | 0.1 | 0.133 (0.004) |
| Height | Brain_Frontal_Cortex_BA9 | 0.5 | 0.134 (0.004) |
| Height | Brain_Frontal_Cortex_BA9 | 1 | 0.134 (0.004) |
| Height | Brain_Frontal_Cortex_BA9 | All | 0.135 (0.004) |
| Height | Brain_Hippocampus | 1e.06 | 0.083 (0.004) |
| Height | Brain_Hippocampus | 1e.05 | 0.089 (0.004) |
| Height | Brain_Hippocampus | 1e.04 | 0.097 (0.004) |
| Height | Brain_Hippocampus | 0.001 | 0.104 (0.004) |
| Height | Brain_Hippocampus | 0.01 | 0.108 (0.004) |
| Height | Brain_Hippocampus | 0.05 | 0.109 (0.004) |
| Height | Brain_Hippocampus | 0.1 | 0.111 (0.004) |
| Height | Brain_Hippocampus | 0.5 | 0.113 (0.004) |
| Height | Brain_Hippocampus | 1 | 0.113 (0.004) |
| Height | Brain_Hippocampus | All | 0.112 (0.004) |
| Height | Brain_Hypothalamus | 1e.06 | 0.085 (0.004) |
| Height | Brain_Hypothalamus | 1e.05 | 0.093 (0.004) |
| Height | Brain_Hypothalamus | 1e.04 | 0.095 (0.004) |
| Height | Brain_Hypothalamus | 0.001 | 0.1 (0.004) |
| Height | Brain_Hypothalamus | 0.01 | 0.105 (0.004) |
| Height | Brain_Hypothalamus | 0.05 | 0.11 (0.004) |
| Height | Brain_Hypothalamus | 0.1 | 0.112 (0.004) |
| Height | Brain_Hypothalamus | 0.5 | 0.113 (0.004) |
| Height | Brain_Hypothalamus | 1 | 0.113 (0.004) |
| Height | Brain_Hypothalamus | All | 0.113 (0.004) |
| Height | Brain_Nucleus_accumbens_basal_ganglia | 1e.06 | 0.1 (0.004) |
| Height | Brain_Nucleus_accumbens_basal_ganglia | 1e.05 | 0.105 (0.004) |
| Height | Brain_Nucleus_accumbens_basal_ganglia | 1e.04 | 0.105 (0.004) |
| Height | Brain_Nucleus_accumbens_basal_ganglia | 0.001 | 0.111 (0.004) |
| Height | Brain_Nucleus_accumbens_basal_ganglia | 0.01 | 0.114 (0.004) |
| Height | Brain_Nucleus_accumbens_basal_ganglia | 0.05 | 0.118 (0.004) |
| Height | Brain_Nucleus_accumbens_basal_ganglia | 0.1 | 0.12 (0.004) |
| Height | Brain_Nucleus_accumbens_basal_ganglia | 0.5 | 0.122 (0.004) |
| Height | Brain_Nucleus_accumbens_basal_ganglia | 1 | 0.122 (0.004) |
| Height | Brain_Nucleus_accumbens_basal_ganglia | All | 0.125 (0.004) |
| Height | Brain_Putamen_basal_ganglia | 1e.06 | 0.096 (0.004) |
| Height | Brain_Putamen_basal_ganglia | 1e.05 | 0.101 (0.004) |
| Height | Brain_Putamen_basal_ganglia | 1e.04 | 0.106 (0.004) |
| Height | Brain_Putamen_basal_ganglia | 0.001 | 0.11 (0.004) |
| Height | Brain_Putamen_basal_ganglia | 0.01 | 0.116 (0.004) |
| Height | Brain_Putamen_basal_ganglia | 0.05 | 0.12 (0.004) |
| Height | Brain_Putamen_basal_ganglia | 0.1 | 0.121 (0.004) |
| Height | Brain_Putamen_basal_ganglia | 0.5 | 0.123 (0.004) |
| Height | Brain_Putamen_basal_ganglia | 1 | 0.123 (0.004) |
| Height | Brain_Putamen_basal_ganglia | All | 0.123 (0.004) |
| Height | Brain_Spinal_cord_cervical_c-1 | 1e.06 | 0.091 (0.004) |
| Height | Brain_Spinal_cord_cervical_c-1 | 1e.05 | 0.093 (0.004) |
| Height | Brain_Spinal_cord_cervical_c-1 | 1e.04 | 0.098 (0.004) |
| Height | Brain_Spinal_cord_cervical_c-1 | 0.001 | 0.103 (0.004) |
| Height | Brain_Spinal_cord_cervical_c-1 | 0.01 | 0.106 (0.004) |
| Height | Brain_Spinal_cord_cervical_c-1 | 0.05 | 0.109 (0.004) |
| Height | Brain_Spinal_cord_cervical_c-1 | 0.1 | 0.111 (0.004) |
| Height | Brain_Spinal_cord_cervical_c-1 | 0.5 | 0.112 (0.004) |
| Height | Brain_Spinal_cord_cervical_c-1 | 1 | 0.111 (0.004) |
| Height | Brain_Spinal_cord_cervical_c-1 | All | 0.113 (0.004) |
| Height | Brain_Substantia_nigra | 1e.06 | 0.083 (0.004) |
| Height | Brain_Substantia_nigra | 1e.05 | 0.087 (0.004) |
| Height | Brain_Substantia_nigra | 1e.04 | 0.092 (0.004) |
| Height | Brain_Substantia_nigra | 0.001 | 0.096 (0.004) |
| Height | Brain_Substantia_nigra | 0.01 | 0.097 (0.004) |
| Height | Brain_Substantia_nigra | 0.05 | 0.099 (0.004) |
| Height | Brain_Substantia_nigra | 0.1 | 0.099 (0.004) |
| Height | Brain_Substantia_nigra | 0.5 | 0.1 (0.004) |
| Height | Brain_Substantia_nigra | 1 | 0.1 (0.004) |
| Height | Brain_Substantia_nigra | All | 0.101 (0.004) |
| Height | Breast_Mammary_Tissue | 1e.06 | 0.123 (0.004) |
| Height | Breast_Mammary_Tissue | 1e.05 | 0.129 (0.004) |
| Height | Breast_Mammary_Tissue | 1e.04 | 0.135 (0.004) |
| Height | Breast_Mammary_Tissue | 0.001 | 0.138 (0.004) |
| Height | Breast_Mammary_Tissue | 0.01 | 0.145 (0.004) |
| Height | Breast_Mammary_Tissue | 0.05 | 0.149 (0.004) |
| Height | Breast_Mammary_Tissue | 0.1 | 0.15 (0.004) |
| Height | Breast_Mammary_Tissue | 0.5 | 0.152 (0.004) |
| Height | Breast_Mammary_Tissue | 1 | 0.152 (0.004) |
| Height | Breast_Mammary_Tissue | All | 0.152 (0.004) |
| Height | Cells_EBV-transformed_lymphocytes | 1e.06 | 0.101 (0.004) |
| Height | Cells_EBV-transformed_lymphocytes | 1e.05 | 0.106 (0.004) |
| Height | Cells_EBV-transformed_lymphocytes | 1e.04 | 0.111 (0.004) |
| Height | Cells_EBV-transformed_lymphocytes | 0.001 | 0.113 (0.004) |
| Height | Cells_EBV-transformed_lymphocytes | 0.01 | 0.119 (0.004) |
| Height | Cells_EBV-transformed_lymphocytes | 0.05 | 0.125 (0.004) |
| Height | Cells_EBV-transformed_lymphocytes | 0.1 | 0.127 (0.004) |
| Height | Cells_EBV-transformed_lymphocytes | 0.5 | 0.13 (0.004) |
| Height | Cells_EBV-transformed_lymphocytes | 1 | 0.13 (0.004) |
| Height | Cells_EBV-transformed_lymphocytes | All | 0.13 (0.004) |
| Height | Cells_Transformed_fibroblasts | 1e.06 | 0.126 (0.004) |
| Height | Cells_Transformed_fibroblasts | 1e.05 | 0.136 (0.004) |
| Height | Cells_Transformed_fibroblasts | 1e.04 | 0.144 (0.004) |
| Height | Cells_Transformed_fibroblasts | 0.001 | 0.15 (0.004) |
| Height | Cells_Transformed_fibroblasts | 0.01 | 0.16 (0.004) |
| Height | Cells_Transformed_fibroblasts | 0.05 | 0.165 (0.004) |
| Height | Cells_Transformed_fibroblasts | 0.1 | 0.167 (0.004) |
| Height | Cells_Transformed_fibroblasts | 0.5 | 0.17 (0.004) |
| Height | Cells_Transformed_fibroblasts | 1 | 0.17 (0.004) |
| Height | Cells_Transformed_fibroblasts | All | 0.17 (0.004) |
| Height | CMC.BRAIN.RNASEQ | 1e.06 | 0.125 (0.004) |
| Height | CMC.BRAIN.RNASEQ | 1e.05 | 0.131 (0.004) |
| Height | CMC.BRAIN.RNASEQ | 1e.04 | 0.139 (0.004) |
| Height | CMC.BRAIN.RNASEQ | 0.001 | 0.147 (0.004) |
| Height | CMC.BRAIN.RNASEQ | 0.01 | 0.155 (0.004) |
| Height | CMC.BRAIN.RNASEQ | 0.05 | 0.162 (0.004) |
| Height | CMC.BRAIN.RNASEQ | 0.1 | 0.164 (0.004) |
| Height | CMC.BRAIN.RNASEQ | 0.5 | 0.165 (0.004) |
| Height | CMC.BRAIN.RNASEQ | 1 | 0.165 (0.004) |
| Height | CMC.BRAIN.RNASEQ | All | 0.165 (0.004) |
| Height | CMC.BRAIN.RNASEQ_SPLICING | 1e.06 | 0.123 (0.004) |
| Height | CMC.BRAIN.RNASEQ_SPLICING | 1e.05 | 0.126 (0.004) |
| Height | CMC.BRAIN.RNASEQ_SPLICING | 1e.04 | 0.131 (0.004) |
| Height | CMC.BRAIN.RNASEQ_SPLICING | 0.001 | 0.135 (0.004) |
| Height | CMC.BRAIN.RNASEQ_SPLICING | 0.01 | 0.141 (0.004) |
| Height | CMC.BRAIN.RNASEQ_SPLICING | 0.05 | 0.144 (0.004) |
| Height | CMC.BRAIN.RNASEQ_SPLICING | 0.1 | 0.145 (0.004) |
| Height | CMC.BRAIN.RNASEQ_SPLICING | 0.5 | 0.145 (0.004) |
| Height | CMC.BRAIN.RNASEQ_SPLICING | 1 | 0.144 (0.004) |
| Height | CMC.BRAIN.RNASEQ_SPLICING | All | 0.147 (0.004) |
| Height | Colon_Sigmoid | 1e.06 | 0.109 (0.004) |
| Height | Colon_Sigmoid | 1e.05 | 0.112 (0.004) |
| Height | Colon_Sigmoid | 1e.04 | 0.121 (0.004) |
| Height | Colon_Sigmoid | 0.001 | 0.126 (0.004) |
| Height | Colon_Sigmoid | 0.01 | 0.133 (0.004) |
| Height | Colon_Sigmoid | 0.05 | 0.137 (0.004) |
| Height | Colon_Sigmoid | 0.1 | 0.138 (0.004) |
| Height | Colon_Sigmoid | 0.5 | 0.141 (0.004) |
| Height | Colon_Sigmoid | 1 | 0.142 (0.004) |
| Height | Colon_Sigmoid | All | 0.142 (0.004) |
| Height | Colon_Transverse | 1e.06 | 0.113 (0.004) |
| Height | Colon_Transverse | 1e.05 | 0.122 (0.004) |
| Height | Colon_Transverse | 1e.04 | 0.129 (0.004) |
| Height | Colon_Transverse | 0.001 | 0.135 (0.004) |
| Height | Colon_Transverse | 0.01 | 0.142 (0.004) |
| Height | Colon_Transverse | 0.05 | 0.147 (0.004) |
| Height | Colon_Transverse | 0.1 | 0.149 (0.004) |
| Height | Colon_Transverse | 0.5 | 0.149 (0.004) |
| Height | Colon_Transverse | 1 | 0.149 (0.004) |
| Height | Colon_Transverse | All | 0.149 (0.004) |
| Height | Esophagus_Gastroesophageal_Junction | 1e.06 | 0.115 (0.004) |
| Height | Esophagus_Gastroesophageal_Junction | 1e.05 | 0.122 (0.004) |
| Height | Esophagus_Gastroesophageal_Junction | 1e.04 | 0.13 (0.004) |
| Height | Esophagus_Gastroesophageal_Junction | 0.001 | 0.133 (0.004) |
| Height | Esophagus_Gastroesophageal_Junction | 0.01 | 0.141 (0.004) |
| Height | Esophagus_Gastroesophageal_Junction | 0.05 | 0.146 (0.004) |
| Height | Esophagus_Gastroesophageal_Junction | 0.1 | 0.147 (0.004) |
| Height | Esophagus_Gastroesophageal_Junction | 0.5 | 0.149 (0.004) |
| Height | Esophagus_Gastroesophageal_Junction | 1 | 0.15 (0.004) |
| Height | Esophagus_Gastroesophageal_Junction | All | 0.149 (0.004) |
| Height | Esophagus_Mucosa | 1e.06 | 0.132 (0.004) |
| Height | Esophagus_Mucosa | 1e.05 | 0.141 (0.004) |
| Height | Esophagus_Mucosa | 1e.04 | 0.149 (0.004) |
| Height | Esophagus_Mucosa | 0.001 | 0.158 (0.004) |
| Height | Esophagus_Mucosa | 0.01 | 0.167 (0.004) |
| Height | Esophagus_Mucosa | 0.05 | 0.172 (0.004) |
| Height | Esophagus_Mucosa | 0.1 | 0.174 (0.004) |
| Height | Esophagus_Mucosa | 0.5 | 0.176 (0.004) |
| Height | Esophagus_Mucosa | 1 | 0.176 (0.004) |
| Height | Esophagus_Mucosa | All | 0.176 (0.004) |
| Height | Esophagus_Muscularis | 1e.06 | 0.129 (0.004) |
| Height | Esophagus_Muscularis | 1e.05 | 0.139 (0.004) |
| Height | Esophagus_Muscularis | 1e.04 | 0.146 (0.004) |
| Height | Esophagus_Muscularis | 0.001 | 0.152 (0.004) |
| Height | Esophagus_Muscularis | 0.01 | 0.16 (0.004) |
| Height | Esophagus_Muscularis | 0.05 | 0.165 (0.004) |
| Height | Esophagus_Muscularis | 0.1 | 0.168 (0.004) |
| Height | Esophagus_Muscularis | 0.5 | 0.17 (0.004) |
| Height | Esophagus_Muscularis | 1 | 0.169 (0.004) |
| Height | Esophagus_Muscularis | All | 0.169 (0.004) |
| Height | Heart_Atrial_Appendage | 1e.06 | 0.115 (0.004) |
| Height | Heart_Atrial_Appendage | 1e.05 | 0.124 (0.004) |
| Height | Heart_Atrial_Appendage | 1e.04 | 0.132 (0.004) |
| Height | Heart_Atrial_Appendage | 0.001 | 0.138 (0.004) |
| Height | Heart_Atrial_Appendage | 0.01 | 0.145 (0.004) |
| Height | Heart_Atrial_Appendage | 0.05 | 0.153 (0.004) |
| Height | Heart_Atrial_Appendage | 0.1 | 0.155 (0.004) |
| Height | Heart_Atrial_Appendage | 0.5 | 0.156 (0.004) |
| Height | Heart_Atrial_Appendage | 1 | 0.156 (0.004) |
| Height | Heart_Atrial_Appendage | All | 0.156 (0.004) |
| Height | Heart_Left_Ventricle | 1e.06 | 0.109 (0.004) |
| Height | Heart_Left_Ventricle | 1e.05 | 0.116 (0.004) |
| Height | Heart_Left_Ventricle | 1e.04 | 0.124 (0.004) |
| Height | Heart_Left_Ventricle | 0.001 | 0.13 (0.004) |
| Height | Heart_Left_Ventricle | 0.01 | 0.136 (0.004) |
| Height | Heart_Left_Ventricle | 0.05 | 0.142 (0.004) |
| Height | Heart_Left_Ventricle | 0.1 | 0.145 (0.004) |
| Height | Heart_Left_Ventricle | 0.5 | 0.148 (0.004) |
| Height | Heart_Left_Ventricle | 1 | 0.148 (0.004) |
| Height | Heart_Left_Ventricle | All | 0.148 (0.004) |
| Height | Liver | 1e.06 | 0.104 (0.004) |
| Height | Liver | 1e.05 | 0.109 (0.004) |
| Height | Liver | 1e.04 | 0.119 (0.004) |
| Height | Liver | 0.001 | 0.121 (0.004) |
| Height | Liver | 0.01 | 0.126 (0.004) |
| Height | Liver | 0.05 | 0.129 (0.004) |
| Height | Liver | 0.1 | 0.13 (0.004) |
| Height | Liver | 0.5 | 0.132 (0.004) |
| Height | Liver | 1 | 0.132 (0.004) |
| Height | Liver | All | 0.134 (0.004) |
| Height | Lung | 1e.06 | 0.13 (0.004) |
| Height | Lung | 1e.05 | 0.136 (0.004) |
| Height | Lung | 1e.04 | 0.144 (0.004) |
| Height | Lung | 0.001 | 0.15 (0.004) |
| Height | Lung | 0.01 | 0.159 (0.004) |
| Height | Lung | 0.05 | 0.165 (0.004) |
| Height | Lung | 0.1 | 0.167 (0.004) |
| Height | Lung | 0.5 | 0.169 (0.004) |
| Height | Lung | 1 | 0.169 (0.004) |
| Height | Lung | All | 0.169 (0.004) |
| Height | METSIM.ADIPOSE.RNASEQ | 1e.06 | 0.118 (0.004) |
| Height | METSIM.ADIPOSE.RNASEQ | 1e.05 | 0.125 (0.004) |
| Height | METSIM.ADIPOSE.RNASEQ | 1e.04 | 0.132 (0.004) |
| Height | METSIM.ADIPOSE.RNASEQ | 0.001 | 0.137 (0.004) |
| Height | METSIM.ADIPOSE.RNASEQ | 0.01 | 0.144 (0.004) |
| Height | METSIM.ADIPOSE.RNASEQ | 0.05 | 0.149 (0.004) |
| Height | METSIM.ADIPOSE.RNASEQ | 0.1 | 0.15 (0.004) |
| Height | METSIM.ADIPOSE.RNASEQ | 0.5 | 0.152 (0.004) |
| Height | METSIM.ADIPOSE.RNASEQ | 1 | 0.152 (0.004) |
| Height | METSIM.ADIPOSE.RNASEQ | All | 0.152 (0.004) |
| Height | Minor_Salivary_Gland | 1e.06 | 0.084 (0.004) |
| Height | Minor_Salivary_Gland | 1e.05 | 0.09 (0.004) |
| Height | Minor_Salivary_Gland | 1e.04 | 0.093 (0.004) |
| Height | Minor_Salivary_Gland | 0.001 | 0.098 (0.004) |
| Height | Minor_Salivary_Gland | 0.01 | 0.102 (0.004) |
| Height | Minor_Salivary_Gland | 0.05 | 0.108 (0.004) |
| Height | Minor_Salivary_Gland | 0.1 | 0.107 (0.004) |
| Height | Minor_Salivary_Gland | 0.5 | 0.109 (0.004) |
| Height | Minor_Salivary_Gland | 1 | 0.108 (0.004) |
| Height | Minor_Salivary_Gland | All | 0.109 (0.004) |
| Height | Muscle_Skeletal | 1e.06 | 0.126 (0.004) |
| Height | Muscle_Skeletal | 1e.05 | 0.135 (0.004) |
| Height | Muscle_Skeletal | 1e.04 | 0.142 (0.004) |
| Height | Muscle_Skeletal | 0.001 | 0.149 (0.004) |
| Height | Muscle_Skeletal | 0.01 | 0.157 (0.004) |
| Height | Muscle_Skeletal | 0.05 | 0.164 (0.004) |
| Height | Muscle_Skeletal | 0.1 | 0.166 (0.004) |
| Height | Muscle_Skeletal | 0.5 | 0.169 (0.004) |
| Height | Muscle_Skeletal | 1 | 0.168 (0.004) |
| Height | Muscle_Skeletal | All | 0.168 (0.004) |
| Height | Nerve_Tibial | 1e.06 | 0.144 (0.004) |
| Height | Nerve_Tibial | 1e.05 | 0.149 (0.004) |
| Height | Nerve_Tibial | 1e.04 | 0.156 (0.004) |
| Height | Nerve_Tibial | 0.001 | 0.163 (0.004) |
| Height | Nerve_Tibial | 0.01 | 0.173 (0.004) |
| Height | Nerve_Tibial | 0.05 | 0.179 (0.004) |
| Height | Nerve_Tibial | 0.1 | 0.181 (0.004) |
| Height | Nerve_Tibial | 0.5 | 0.182 (0.004) |
| Height | Nerve_Tibial | 1 | 0.182 (0.004) |
| Height | Nerve_Tibial | All | 0.182 (0.004) |
| Height | NTR.BLOOD.RNAARR | 1e.06 | 0.108 (0.004) |
| Height | NTR.BLOOD.RNAARR | 1e.05 | 0.113 (0.004) |
| Height | NTR.BLOOD.RNAARR | 1e.04 | 0.119 (0.004) |
| Height | NTR.BLOOD.RNAARR | 0.001 | 0.124 (0.004) |
| Height | NTR.BLOOD.RNAARR | 0.01 | 0.131 (0.004) |
| Height | NTR.BLOOD.RNAARR | 0.05 | 0.136 (0.004) |
| Height | NTR.BLOOD.RNAARR | 0.1 | 0.137 (0.004) |
| Height | NTR.BLOOD.RNAARR | 0.5 | 0.138 (0.004) |
| Height | NTR.BLOOD.RNAARR | 1 | 0.138 (0.004) |
| Height | NTR.BLOOD.RNAARR | All | 0.139 (0.004) |
| Height | Ovary | 1e.06 | 0.084 (0.004) |
| Height | Ovary | 1e.05 | 0.092 (0.004) |
| Height | Ovary | 1e.04 | 0.096 (0.004) |
| Height | Ovary | 0.001 | 0.103 (0.004) |
| Height | Ovary | 0.01 | 0.111 (0.004) |
| Height | Ovary | 0.05 | 0.116 (0.004) |
| Height | Ovary | 0.1 | 0.118 (0.004) |
| Height | Ovary | 0.5 | 0.12 (0.004) |
| Height | Ovary | 1 | 0.12 (0.004) |
| Height | Ovary | All | 0.12 (0.004) |
| Height | Pancreas | 1e.06 | 0.117 (0.004) |
| Height | Pancreas | 1e.05 | 0.125 (0.004) |
| Height | Pancreas | 1e.04 | 0.131 (0.004) |
| Height | Pancreas | 0.001 | 0.137 (0.004) |
| Height | Pancreas | 0.01 | 0.146 (0.004) |
| Height | Pancreas | 0.05 | 0.153 (0.004) |
| Height | Pancreas | 0.1 | 0.154 (0.004) |
| Height | Pancreas | 0.5 | 0.154 (0.004) |
| Height | Pancreas | 1 | 0.155 (0.004) |
| Height | Pancreas | All | 0.155 (0.004) |
| Height | Pituitary | 1e.06 | 0.113 (0.004) |
| Height | Pituitary | 1e.05 | 0.121 (0.004) |
| Height | Pituitary | 1e.04 | 0.124 (0.004) |
| Height | Pituitary | 0.001 | 0.131 (0.004) |
| Height | Pituitary | 0.01 | 0.136 (0.004) |
| Height | Pituitary | 0.05 | 0.139 (0.004) |
| Height | Pituitary | 0.1 | 0.141 (0.004) |
| Height | Pituitary | 0.5 | 0.142 (0.004) |
| Height | Pituitary | 1 | 0.142 (0.004) |
| Height | Pituitary | All | 0.143 (0.004) |
| Height | Prostate | 1e.06 | 0.08 (0.004) |
| Height | Prostate | 1e.05 | 0.087 (0.004) |
| Height | Prostate | 1e.04 | 0.095 (0.004) |
| Height | Prostate | 0.001 | 0.099 (0.004) |
| Height | Prostate | 0.01 | 0.106 (0.004) |
| Height | Prostate | 0.05 | 0.11 (0.004) |
| Height | Prostate | 0.1 | 0.111 (0.004) |
| Height | Prostate | 0.5 | 0.114 (0.004) |
| Height | Prostate | 1 | 0.113 (0.004) |
| Height | Prostate | All | 0.113 (0.004) |
| Height | Skin_Not_Sun_Exposed_Suprapubic | 1e.06 | 0.128 (0.004) |
| Height | Skin_Not_Sun_Exposed_Suprapubic | 1e.05 | 0.136 (0.004) |
| Height | Skin_Not_Sun_Exposed_Suprapubic | 1e.04 | 0.143 (0.004) |
| Height | Skin_Not_Sun_Exposed_Suprapubic | 0.001 | 0.149 (0.004) |
| Height | Skin_Not_Sun_Exposed_Suprapubic | 0.01 | 0.157 (0.004) |
| Height | Skin_Not_Sun_Exposed_Suprapubic | 0.05 | 0.164 (0.004) |
| Height | Skin_Not_Sun_Exposed_Suprapubic | 0.1 | 0.165 (0.004) |
| Height | Skin_Not_Sun_Exposed_Suprapubic | 0.5 | 0.168 (0.004) |
| Height | Skin_Not_Sun_Exposed_Suprapubic | 1 | 0.168 (0.004) |
| Height | Skin_Not_Sun_Exposed_Suprapubic | All | 0.167 (0.004) |
| Height | Skin_Sun_Exposed_Lower_leg | 1e.06 | 0.137 (0.004) |
| Height | Skin_Sun_Exposed_Lower_leg | 1e.05 | 0.145 (0.004) |
| Height | Skin_Sun_Exposed_Lower_leg | 1e.04 | 0.152 (0.004) |
| Height | Skin_Sun_Exposed_Lower_leg | 0.001 | 0.156 (0.004) |
| Height | Skin_Sun_Exposed_Lower_leg | 0.01 | 0.167 (0.004) |
| Height | Skin_Sun_Exposed_Lower_leg | 0.05 | 0.172 (0.004) |
| Height | Skin_Sun_Exposed_Lower_leg | 0.1 | 0.173 (0.004) |
| Height | Skin_Sun_Exposed_Lower_leg | 0.5 | 0.174 (0.004) |
| Height | Skin_Sun_Exposed_Lower_leg | 1 | 0.175 (0.004) |
| Height | Skin_Sun_Exposed_Lower_leg | All | 0.175 (0.004) |
| Height | Small_Intestine_Terminal_Ileum | 1e.06 | 0.098 (0.004) |
| Height | Small_Intestine_Terminal_Ileum | 1e.05 | 0.103 (0.004) |
| Height | Small_Intestine_Terminal_Ileum | 1e.04 | 0.104 (0.004) |
| Height | Small_Intestine_Terminal_Ileum | 0.001 | 0.113 (0.004) |
| Height | Small_Intestine_Terminal_Ileum | 0.01 | 0.116 (0.004) |
| Height | Small_Intestine_Terminal_Ileum | 0.05 | 0.12 (0.004) |
| Height | Small_Intestine_Terminal_Ileum | 0.1 | 0.121 (0.004) |
| Height | Small_Intestine_Terminal_Ileum | 0.5 | 0.125 (0.004) |
| Height | Small_Intestine_Terminal_Ileum | 1 | 0.125 (0.004) |
| Height | Small_Intestine_Terminal_Ileum | All | 0.126 (0.004) |
| Height | Spleen | 1e.06 | 0.115 (0.004) |
| Height | Spleen | 1e.05 | 0.121 (0.004) |
| Height | Spleen | 1e.04 | 0.126 (0.004) |
| Height | Spleen | 0.001 | 0.13 (0.004) |
| Height | Spleen | 0.01 | 0.138 (0.004) |
| Height | Spleen | 0.05 | 0.141 (0.004) |
| Height | Spleen | 0.1 | 0.142 (0.004) |
| Height | Spleen | 0.5 | 0.143 (0.004) |
| Height | Spleen | 1 | 0.143 (0.004) |
| Height | Spleen | All | 0.145 (0.004) |
| Height | Stomach | 1e.06 | 0.117 (0.004) |
| Height | Stomach | 1e.05 | 0.123 (0.004) |
| Height | Stomach | 1e.04 | 0.132 (0.004) |
| Height | Stomach | 0.001 | 0.137 (0.004) |
| Height | Stomach | 0.01 | 0.143 (0.004) |
| Height | Stomach | 0.05 | 0.147 (0.004) |
| Height | Stomach | 0.1 | 0.148 (0.004) |
| Height | Stomach | 0.5 | 0.151 (0.004) |
| Height | Stomach | 1 | 0.15 (0.004) |
| Height | Stomach | All | 0.151 (0.004) |
| Height | Testis | 1e.06 | 0.138 (0.004) |
| Height | Testis | 1e.05 | 0.145 (0.004) |
| Height | Testis | 1e.04 | 0.152 (0.004) |
| Height | Testis | 0.001 | 0.159 (0.004) |
| Height | Testis | 0.01 | 0.165 (0.004) |
| Height | Testis | 0.05 | 0.169 (0.004) |
| Height | Testis | 0.1 | 0.171 (0.004) |
| Height | Testis | 0.5 | 0.174 (0.004) |
| Height | Testis | 1 | 0.174 (0.004) |
| Height | Testis | All | 0.176 (0.004) |
| Height | Thyroid | 1e.06 | 0.141 (0.004) |
| Height | Thyroid | 1e.05 | 0.148 (0.004) |
| Height | Thyroid | 1e.04 | 0.155 (0.004) |
| Height | Thyroid | 0.001 | 0.161 (0.004) |
| Height | Thyroid | 0.01 | 0.17 (0.004) |
| Height | Thyroid | 0.05 | 0.175 (0.004) |
| Height | Thyroid | 0.1 | 0.177 (0.004) |
| Height | Thyroid | 0.5 | 0.181 (0.004) |
| Height | Thyroid | 1 | 0.181 (0.004) |
| Height | Thyroid | All | 0.181 (0.004) |
| Height | Uterus | 1e.06 | 0.074 (0.004) |
| Height | Uterus | 1e.05 | 0.08 (0.004) |
| Height | Uterus | 1e.04 | 0.084 (0.004) |
| Height | Uterus | 0.001 | 0.091 (0.004) |
| Height | Uterus | 0.01 | 0.099 (0.004) |
| Height | Uterus | 0.05 | 0.102 (0.004) |
| Height | Uterus | 0.1 | 0.104 (0.004) |
| Height | Uterus | 0.5 | 0.107 (0.004) |
| Height | Uterus | 1 | 0.107 (0.004) |
| Height | Uterus | All | 0.107 (0.004) |
| Height | Vagina | 1e.06 | 0.075 (0.004) |
| Height | Vagina | 1e.05 | 0.081 (0.004) |
| Height | Vagina | 1e.04 | 0.09 (0.004) |
| Height | Vagina | 0.001 | 0.091 (0.004) |
| Height | Vagina | 0.01 | 0.098 (0.004) |
| Height | Vagina | 0.05 | 0.104 (0.004) |
| Height | Vagina | 0.1 | 0.106 (0.004) |
| Height | Vagina | 0.5 | 0.107 (0.004) |
| Height | Vagina | 1 | 0.108 (0.004) |
| Height | Vagina | All | 0.109 (0.004) |
| Height | Whole_Blood | 1e.06 | 0.125 (0.004) |
| Height | Whole_Blood | 1e.05 | 0.133 (0.004) |
| Height | Whole_Blood | 1e.04 | 0.139 (0.004) |
| Height | Whole_Blood | 0.001 | 0.148 (0.004) |
| Height | Whole_Blood | 0.01 | 0.155 (0.004) |
| Height | Whole_Blood | 0.05 | 0.159 (0.004) |
| Height | Whole_Blood | 0.1 | 0.16 (0.004) |
| Height | Whole_Blood | 0.5 | 0.162 (0.004) |
| Height | Whole_Blood | 1 | 0.162 (0.004) |
| Height | Whole_Blood | All | 0.162 (0.004) |
| Height | YFS.BLOOD.RNAARR | 1e.06 | 0.124 (0.004) |
| Height | YFS.BLOOD.RNAARR | 1e.05 | 0.132 (0.004) |
| Height | YFS.BLOOD.RNAARR | 1e.04 | 0.138 (0.004) |
| Height | YFS.BLOOD.RNAARR | 0.001 | 0.146 (0.004) |
| Height | YFS.BLOOD.RNAARR | 0.01 | 0.152 (0.004) |
| Height | YFS.BLOOD.RNAARR | 0.05 | 0.16 (0.004) |
| Height | YFS.BLOOD.RNAARR | 0.1 | 0.162 (0.004) |
| Height | YFS.BLOOD.RNAARR | 0.5 | 0.163 (0.004) |
| Height | YFS.BLOOD.RNAARR | 1 | 0.164 (0.004) |
| Height | YFS.BLOOD.RNAARR | All | 0.164 (0.004) |
| T2D | Adipose_Subcutaneous | 1e.06 | 0.064 (0.004) |
| T2D | Adipose_Subcutaneous | 1e.05 | 0.069 (0.004) |
| T2D | Adipose_Subcutaneous | 1e.04 | 0.066 (0.004) |
| T2D | Adipose_Subcutaneous | 0.001 | 0.069 (0.004) |
| T2D | Adipose_Subcutaneous | 0.01 | 0.082 (0.004) |
| T2D | Adipose_Subcutaneous | 0.05 | 0.087 (0.004) |
| T2D | Adipose_Subcutaneous | 0.1 | 0.092 (0.004) |
| T2D | Adipose_Subcutaneous | 0.5 | 0.096 (0.004) |
| T2D | Adipose_Subcutaneous | 1 | 0.096 (0.004) |
| T2D | Adipose_Subcutaneous | All | 0.11 (0.004) |
| T2D | Adipose_Visceral_Omentum | 1e.06 | 0.039 (0.004) |
| T2D | Adipose_Visceral_Omentum | 1e.05 | 0.039 (0.004) |
| T2D | Adipose_Visceral_Omentum | 1e.04 | 0.053 (0.004) |
| T2D | Adipose_Visceral_Omentum | 0.001 | 0.06 (0.004) |
| T2D | Adipose_Visceral_Omentum | 0.01 | 0.066 (0.004) |
| T2D | Adipose_Visceral_Omentum | 0.05 | 0.074 (0.004) |
| T2D | Adipose_Visceral_Omentum | 0.1 | 0.074 (0.004) |
| T2D | Adipose_Visceral_Omentum | 0.5 | 0.081 (0.004) |
| T2D | Adipose_Visceral_Omentum | 1 | 0.081 (0.004) |
| T2D | Adipose_Visceral_Omentum | All | 0.088 (0.004) |
| T2D | Adrenal_Gland | 1e.06 | 0.042 (0.004) |
| T2D | Adrenal_Gland | 1e.05 | 0.044 (0.004) |
| T2D | Adrenal_Gland | 1e.04 | 0.049 (0.004) |
| T2D | Adrenal_Gland | 0.001 | 0.053 (0.004) |
| T2D | Adrenal_Gland | 0.01 | 0.06 (0.004) |
| T2D | Adrenal_Gland | 0.05 | 0.07 (0.004) |
| T2D | Adrenal_Gland | 0.1 | 0.075 (0.004) |
| T2D | Adrenal_Gland | 0.5 | 0.075 (0.004) |
| T2D | Adrenal_Gland | 1 | 0.075 (0.004) |
| T2D | Adrenal_Gland | All | 0.082 (0.004) |
| T2D | Artery_Aorta | 1e.06 | 0.062 (0.004) |
| T2D | Artery_Aorta | 1e.05 | 0.067 (0.004) |
| T2D | Artery_Aorta | 1e.04 | 0.068 (0.004) |
| T2D | Artery_Aorta | 0.001 | 0.068 (0.004) |
| T2D | Artery_Aorta | 0.01 | 0.08 (0.004) |
| T2D | Artery_Aorta | 0.05 | 0.084 (0.004) |
| T2D | Artery_Aorta | 0.1 | 0.084 (0.004) |
| T2D | Artery_Aorta | 0.5 | 0.086 (0.004) |
| T2D | Artery_Aorta | 1 | 0.085 (0.004) |
| T2D | Artery_Aorta | All | 0.101 (0.004) |
| T2D | Artery_Coronary | 1e.06 | 0.01 (0.004) |
| T2D | Artery_Coronary | 1e.05 | 0.03 (0.004) |
| T2D | Artery_Coronary | 1e.04 | 0.033 (0.004) |
| T2D | Artery_Coronary | 0.001 | 0.045 (0.004) |
| T2D | Artery_Coronary | 0.01 | 0.054 (0.004) |
| T2D | Artery_Coronary | 0.05 | 0.064 (0.004) |
| T2D | Artery_Coronary | 0.1 | 0.066 (0.004) |
| T2D | Artery_Coronary | 0.5 | 0.065 (0.004) |
| T2D | Artery_Coronary | 1 | 0.064 (0.004) |
| T2D | Artery_Coronary | All | 0.069 (0.004) |
| T2D | Artery_Tibial | 1e.06 | 0.045 (0.004) |
| T2D | Artery_Tibial | 1e.05 | 0.054 (0.004) |
| T2D | Artery_Tibial | 1e.04 | 0.062 (0.004) |
| T2D | Artery_Tibial | 0.001 | 0.068 (0.004) |
| T2D | Artery_Tibial | 0.01 | 0.084 (0.004) |
| T2D | Artery_Tibial | 0.05 | 0.093 (0.004) |
| T2D | Artery_Tibial | 0.1 | 0.096 (0.004) |
| T2D | Artery_Tibial | 0.5 | 0.1 (0.004) |
| T2D | Artery_Tibial | 1 | 0.099 (0.004) |
| T2D | Artery_Tibial | All | 0.107 (0.004) |
| T2D | Brain_Amygdala | 1e.06 | 0.024 (0.004) |
| T2D | Brain_Amygdala | 1e.05 | 0.034 (0.004) |
| T2D | Brain_Amygdala | 1e.04 | 0.037 (0.004) |
| T2D | Brain_Amygdala | 0.001 | 0.037 (0.004) |
| T2D | Brain_Amygdala | 0.01 | 0.053 (0.004) |
| T2D | Brain_Amygdala | 0.05 | 0.058 (0.004) |
| T2D | Brain_Amygdala | 0.1 | 0.061 (0.004) |
| T2D | Brain_Amygdala | 0.5 | 0.062 (0.004) |
| T2D | Brain_Amygdala | 1 | 0.062 (0.004) |
| T2D | Brain_Amygdala | All | 0.067 (0.004) |
| T2D | Brain_Anterior_cingulate_cortex_BA24 | 1e.06 | 0.026 (0.004) |
| T2D | Brain_Anterior_cingulate_cortex_BA24 | 1e.05 | 0.028 (0.004) |
| T2D | Brain_Anterior_cingulate_cortex_BA24 | 1e.04 | 0.034 (0.004) |
| T2D | Brain_Anterior_cingulate_cortex_BA24 | 0.001 | 0.043 (0.004) |
| T2D | Brain_Anterior_cingulate_cortex_BA24 | 0.01 | 0.058 (0.004) |
| T2D | Brain_Anterior_cingulate_cortex_BA24 | 0.05 | 0.066 (0.004) |
| T2D | Brain_Anterior_cingulate_cortex_BA24 | 0.1 | 0.065 (0.004) |
| T2D | Brain_Anterior_cingulate_cortex_BA24 | 0.5 | 0.062 (0.004) |
| T2D | Brain_Anterior_cingulate_cortex_BA24 | 1 | 0.062 (0.004) |
| T2D | Brain_Anterior_cingulate_cortex_BA24 | All | 0.069 (0.004) |
| T2D | Brain_Caudate_basal_ganglia | 1e.05 | 0.022 (0.004) |
| T2D | Brain_Caudate_basal_ganglia | 1e.04 | 0.035 (0.004) |
| T2D | Brain_Caudate_basal_ganglia | 0.001 | 0.041 (0.004) |
| T2D | Brain_Caudate_basal_ganglia | 0.01 | 0.055 (0.004) |
| T2D | Brain_Caudate_basal_ganglia | 0.05 | 0.062 (0.004) |
| T2D | Brain_Caudate_basal_ganglia | 0.1 | 0.061 (0.004) |
| T2D | Brain_Caudate_basal_ganglia | 0.5 | 0.067 (0.004) |
| T2D | Brain_Caudate_basal_ganglia | 1 | 0.066 (0.004) |
| T2D | Brain_Caudate_basal_ganglia | All | 0.07 (0.004) |
| T2D | Brain_Cerebellar_Hemisphere | 1e.06 | 0.038 (0.004) |
| T2D | Brain_Cerebellar_Hemisphere | 1e.05 | 0.046 (0.004) |
| T2D | Brain_Cerebellar_Hemisphere | 1e.04 | 0.046 (0.004) |
| T2D | Brain_Cerebellar_Hemisphere | 0.001 | 0.056 (0.004) |
| T2D | Brain_Cerebellar_Hemisphere | 0.01 | 0.066 (0.004) |
| T2D | Brain_Cerebellar_Hemisphere | 0.05 | 0.07 (0.004) |
| T2D | Brain_Cerebellar_Hemisphere | 0.1 | 0.07 (0.004) |
| T2D | Brain_Cerebellar_Hemisphere | 0.5 | 0.071 (0.004) |
| T2D | Brain_Cerebellar_Hemisphere | 1 | 0.071 (0.004) |
| T2D | Brain_Cerebellar_Hemisphere | All | 0.081 (0.004) |
| T2D | Brain_Cerebellum | 1e.06 | 0.03 (0.004) |
| T2D | Brain_Cerebellum | 1e.05 | 0.039 (0.004) |
| T2D | Brain_Cerebellum | 1e.04 | 0.048 (0.004) |
| T2D | Brain_Cerebellum | 0.001 | 0.058 (0.004) |
| T2D | Brain_Cerebellum | 0.01 | 0.065 (0.004) |
| T2D | Brain_Cerebellum | 0.05 | 0.074 (0.004) |
| T2D | Brain_Cerebellum | 0.1 | 0.078 (0.004) |
| T2D | Brain_Cerebellum | 0.5 | 0.078 (0.004) |
| T2D | Brain_Cerebellum | 1 | 0.079 (0.004) |
| T2D | Brain_Cerebellum | All | 0.084 (0.004) |
| T2D | Brain_Cortex | 1e.06 | 0.016 (0.004) |
| T2D | Brain_Cortex | 1e.05 | 0.024 (0.004) |
| T2D | Brain_Cortex | 1e.04 | 0.039 (0.004) |
| T2D | Brain_Cortex | 0.001 | 0.038 (0.004) |
| T2D | Brain_Cortex | 0.01 | 0.054 (0.004) |
| T2D | Brain_Cortex | 0.05 | 0.059 (0.004) |
| T2D | Brain_Cortex | 0.1 | 0.06 (0.004) |
| T2D | Brain_Cortex | 0.5 | 0.068 (0.004) |
| T2D | Brain_Cortex | 1 | 0.068 (0.004) |
| T2D | Brain_Cortex | All | 0.07 (0.004) |
| T2D | Brain_Frontal_Cortex_BA9 | 1e.06 | 0.018 (0.004) |
| T2D | Brain_Frontal_Cortex_BA9 | 1e.05 | 0.018 (0.004) |
| T2D | Brain_Frontal_Cortex_BA9 | 1e.04 | 0.034 (0.004) |
| T2D | Brain_Frontal_Cortex_BA9 | 0.001 | 0.038 (0.004) |
| T2D | Brain_Frontal_Cortex_BA9 | 0.01 | 0.054 (0.004) |
| T2D | Brain_Frontal_Cortex_BA9 | 0.05 | 0.059 (0.004) |
| T2D | Brain_Frontal_Cortex_BA9 | 0.1 | 0.064 (0.004) |
| T2D | Brain_Frontal_Cortex_BA9 | 0.5 | 0.068 (0.004) |
| T2D | Brain_Frontal_Cortex_BA9 | 1 | 0.067 (0.004) |
| T2D | Brain_Frontal_Cortex_BA9 | All | 0.071 (0.004) |
| T2D | Brain_Hippocampus | 1e.06 | 0.012 (0.004) |
| T2D | Brain_Hippocampus | 1e.05 | 0.023 (0.004) |
| T2D | Brain_Hippocampus | 1e.04 | 0.025 (0.004) |
| T2D | Brain_Hippocampus | 0.001 | 0.038 (0.004) |
| T2D | Brain_Hippocampus | 0.01 | 0.045 (0.004) |
| T2D | Brain_Hippocampus | 0.05 | 0.055 (0.004) |
| T2D | Brain_Hippocampus | 0.1 | 0.054 (0.004) |
| T2D | Brain_Hippocampus | 0.5 | 0.058 (0.004) |
| T2D | Brain_Hippocampus | 1 | 0.057 (0.004) |
| T2D | Brain_Hippocampus | All | 0.062 (0.004) |
| T2D | Brain_Hypothalamus | 1e.06 | 0.029 (0.004) |
| T2D | Brain_Hypothalamus | 1e.05 | 0.029 (0.004) |
| T2D | Brain_Hypothalamus | 1e.04 | 0.029 (0.004) |
| T2D | Brain_Hypothalamus | 0.001 | 0.039 (0.004) |
| T2D | Brain_Hypothalamus | 0.01 | 0.048 (0.004) |
| T2D | Brain_Hypothalamus | 0.05 | 0.05 (0.004) |
| T2D | Brain_Hypothalamus | 0.1 | 0.055 (0.004) |
| T2D | Brain_Hypothalamus | 0.5 | 0.057 (0.004) |
| T2D | Brain_Hypothalamus | 1 | 0.056 (0.004) |
| T2D | Brain_Hypothalamus | All | 0.061 (0.004) |
| T2D | Brain_Nucleus_accumbens_basal_ganglia | 1e.05 | 0.025 (0.004) |
| T2D | Brain_Nucleus_accumbens_basal_ganglia | 1e.04 | 0.037 (0.004) |
| T2D | Brain_Nucleus_accumbens_basal_ganglia | 0.001 | 0.043 (0.004) |
| T2D | Brain_Nucleus_accumbens_basal_ganglia | 0.01 | 0.06 (0.004) |
| T2D | Brain_Nucleus_accumbens_basal_ganglia | 0.05 | 0.06 (0.004) |
| T2D | Brain_Nucleus_accumbens_basal_ganglia | 0.1 | 0.062 (0.004) |
| T2D | Brain_Nucleus_accumbens_basal_ganglia | 0.5 | 0.068 (0.004) |
| T2D | Brain_Nucleus_accumbens_basal_ganglia | 1 | 0.067 (0.004) |
| T2D | Brain_Nucleus_accumbens_basal_ganglia | All | 0.072 (0.004) |
| T2D | Brain_Putamen_basal_ganglia | 1e.06 | 0.015 (0.004) |
| T2D | Brain_Putamen_basal_ganglia | 1e.05 | 0.02 (0.004) |
| T2D | Brain_Putamen_basal_ganglia | 1e.04 | 0.028 (0.004) |
| T2D | Brain_Putamen_basal_ganglia | 0.001 | 0.037 (0.004) |
| T2D | Brain_Putamen_basal_ganglia | 0.01 | 0.049 (0.004) |
| T2D | Brain_Putamen_basal_ganglia | 0.05 | 0.053 (0.004) |
| T2D | Brain_Putamen_basal_ganglia | 0.1 | 0.059 (0.004) |
| T2D | Brain_Putamen_basal_ganglia | 0.5 | 0.065 (0.004) |
| T2D | Brain_Putamen_basal_ganglia | 1 | 0.065 (0.004) |
| T2D | Brain_Putamen_basal_ganglia | All | 0.067 (0.004) |
| T2D | Brain_Spinal_cord_cervical_c-1 | 1e.06 | 0.011 (0.004) |
| T2D | Brain_Spinal_cord_cervical_c-1 | 1e.05 | 0.014 (0.004) |
| T2D | Brain_Spinal_cord_cervical_c-1 | 1e.04 | 0.032 (0.004) |
| T2D | Brain_Spinal_cord_cervical_c-1 | 0.001 | 0.038 (0.004) |
| T2D | Brain_Spinal_cord_cervical_c-1 | 0.01 | 0.05 (0.004) |
| T2D | Brain_Spinal_cord_cervical_c-1 | 0.05 | 0.057 (0.004) |
| T2D | Brain_Spinal_cord_cervical_c-1 | 0.1 | 0.056 (0.004) |
| T2D | Brain_Spinal_cord_cervical_c-1 | 0.5 | 0.056 (0.004) |
| T2D | Brain_Spinal_cord_cervical_c-1 | 1 | 0.056 (0.004) |
| T2D | Brain_Spinal_cord_cervical_c-1 | All | 0.061 (0.004) |
| T2D | Brain_Substantia_nigra | 1e.06 | 0.021 (0.004) |
| T2D | Brain_Substantia_nigra | 1e.05 | 0.022 (0.004) |
| T2D | Brain_Substantia_nigra | 1e.04 | 0.026 (0.004) |
| T2D | Brain_Substantia_nigra | 0.001 | 0.03 (0.004) |
| T2D | Brain_Substantia_nigra | 0.01 | 0.032 (0.004) |
| T2D | Brain_Substantia_nigra | 0.05 | 0.041 (0.004) |
| T2D | Brain_Substantia_nigra | 0.1 | 0.04 (0.004) |
| T2D | Brain_Substantia_nigra | 0.5 | 0.045 (0.004) |
| T2D | Brain_Substantia_nigra | 1 | 0.047 (0.004) |
| T2D | Brain_Substantia_nigra | All | 0.049 (0.004) |
| T2D | Breast_Mammary_Tissue | 1e.06 | 0.046 (0.004) |
| T2D | Breast_Mammary_Tissue | 1e.05 | 0.051 (0.004) |
| T2D | Breast_Mammary_Tissue | 1e.04 | 0.054 (0.004) |
| T2D | Breast_Mammary_Tissue | 0.001 | 0.061 (0.004) |
| T2D | Breast_Mammary_Tissue | 0.01 | 0.074 (0.004) |
| T2D | Breast_Mammary_Tissue | 0.05 | 0.076 (0.004) |
| T2D | Breast_Mammary_Tissue | 0.1 | 0.078 (0.004) |
| T2D | Breast_Mammary_Tissue | 0.5 | 0.082 (0.004) |
| T2D | Breast_Mammary_Tissue | 1 | 0.08 (0.004) |
| T2D | Breast_Mammary_Tissue | All | 0.088 (0.004) |
| T2D | Cells_EBV-transformed_lymphocytes | 1e.06 | 0.018 (0.004) |
| T2D | Cells_EBV-transformed_lymphocytes | 1e.05 | 0.027 (0.004) |
| T2D | Cells_EBV-transformed_lymphocytes | 1e.04 | 0.032 (0.004) |
| T2D | Cells_EBV-transformed_lymphocytes | 0.001 | 0.036 (0.004) |
| T2D | Cells_EBV-transformed_lymphocytes | 0.01 | 0.047 (0.004) |
| T2D | Cells_EBV-transformed_lymphocytes | 0.05 | 0.058 (0.004) |
| T2D | Cells_EBV-transformed_lymphocytes | 0.1 | 0.057 (0.004) |
| T2D | Cells_EBV-transformed_lymphocytes | 0.5 | 0.06 (0.004) |
| T2D | Cells_EBV-transformed_lymphocytes | 1 | 0.061 (0.004) |
| T2D | Cells_EBV-transformed_lymphocytes | All | 0.063 (0.004) |
| T2D | Cells_Transformed_fibroblasts | 1e.06 | 0.049 (0.004) |
| T2D | Cells_Transformed_fibroblasts | 1e.05 | 0.056 (0.004) |
| T2D | Cells_Transformed_fibroblasts | 1e.04 | 0.065 (0.004) |
| T2D | Cells_Transformed_fibroblasts | 0.001 | 0.07 (0.004) |
| T2D | Cells_Transformed_fibroblasts | 0.01 | 0.078 (0.004) |
| T2D | Cells_Transformed_fibroblasts | 0.05 | 0.086 (0.004) |
| T2D | Cells_Transformed_fibroblasts | 0.1 | 0.09 (0.004) |
| T2D | Cells_Transformed_fibroblasts | 0.5 | 0.097 (0.004) |
| T2D | Cells_Transformed_fibroblasts | 1 | 0.098 (0.004) |
| T2D | Cells_Transformed_fibroblasts | All | 0.104 (0.004) |
| T2D | CMC.BRAIN.RNASEQ | 1e.06 | 0.045 (0.004) |
| T2D | CMC.BRAIN.RNASEQ | 1e.05 | 0.056 (0.004) |
| T2D | CMC.BRAIN.RNASEQ | 1e.04 | 0.059 (0.004) |
| T2D | CMC.BRAIN.RNASEQ | 0.001 | 0.069 (0.004) |
| T2D | CMC.BRAIN.RNASEQ | 0.01 | 0.077 (0.004) |
| T2D | CMC.BRAIN.RNASEQ | 0.05 | 0.086 (0.004) |
| T2D | CMC.BRAIN.RNASEQ | 0.1 | 0.091 (0.004) |
| T2D | CMC.BRAIN.RNASEQ | 0.5 | 0.097 (0.004) |
| T2D | CMC.BRAIN.RNASEQ | 1 | 0.096 (0.004) |
| T2D | CMC.BRAIN.RNASEQ | All | 0.104 (0.004) |
| T2D | CMC.BRAIN.RNASEQ_SPLICING | 1e.06 | 0.029 (0.004) |
| T2D | CMC.BRAIN.RNASEQ_SPLICING | 1e.05 | 0.044 (0.004) |
| T2D | CMC.BRAIN.RNASEQ_SPLICING | 1e.04 | 0.049 (0.004) |
| T2D | CMC.BRAIN.RNASEQ_SPLICING | 0.001 | 0.056 (0.004) |
| T2D | CMC.BRAIN.RNASEQ_SPLICING | 0.01 | 0.062 (0.004) |
| T2D | CMC.BRAIN.RNASEQ_SPLICING | 0.05 | 0.071 (0.004) |
| T2D | CMC.BRAIN.RNASEQ_SPLICING | 0.1 | 0.073 (0.004) |
| T2D | CMC.BRAIN.RNASEQ_SPLICING | 0.5 | 0.076 (0.004) |
| T2D | CMC.BRAIN.RNASEQ_SPLICING | 1 | 0.075 (0.004) |
| T2D | CMC.BRAIN.RNASEQ_SPLICING | All | 0.084 (0.004) |
| T2D | Colon_Sigmoid | 1e.06 | 0.03 (0.004) |
| T2D | Colon_Sigmoid | 1e.05 | 0.033 (0.004) |
| T2D | Colon_Sigmoid | 1e.04 | 0.037 (0.004) |
| T2D | Colon_Sigmoid | 0.001 | 0.053 (0.004) |
| T2D | Colon_Sigmoid | 0.01 | 0.059 (0.004) |
| T2D | Colon_Sigmoid | 0.05 | 0.066 (0.004) |
| T2D | Colon_Sigmoid | 0.1 | 0.068 (0.004) |
| T2D | Colon_Sigmoid | 0.5 | 0.072 (0.004) |
| T2D | Colon_Sigmoid | 1 | 0.071 (0.004) |
| T2D | Colon_Sigmoid | All | 0.076 (0.004) |
| T2D | Colon_Transverse | 1e.06 | 0.014 (0.004) |
| T2D | Colon_Transverse | 1e.05 | 0.031 (0.004) |
| T2D | Colon_Transverse | 1e.04 | 0.035 (0.004) |
| T2D | Colon_Transverse | 0.001 | 0.04 (0.004) |
| T2D | Colon_Transverse | 0.01 | 0.057 (0.004) |
| T2D | Colon_Transverse | 0.05 | 0.072 (0.004) |
| T2D | Colon_Transverse | 0.1 | 0.077 (0.004) |
| T2D | Colon_Transverse | 0.5 | 0.08 (0.004) |
| T2D | Colon_Transverse | 1 | 0.079 (0.004) |
| T2D | Colon_Transverse | All | 0.083 (0.004) |
| T2D | Esophagus_Gastroesophageal_Junction | 1e.06 | 0.04 (0.004) |
| T2D | Esophagus_Gastroesophageal_Junction | 1e.05 | 0.042 (0.004) |
| T2D | Esophagus_Gastroesophageal_Junction | 1e.04 | 0.041 (0.004) |
| T2D | Esophagus_Gastroesophageal_Junction | 0.001 | 0.051 (0.004) |
| T2D | Esophagus_Gastroesophageal_Junction | 0.01 | 0.063 (0.004) |
| T2D | Esophagus_Gastroesophageal_Junction | 0.05 | 0.071 (0.004) |
| T2D | Esophagus_Gastroesophageal_Junction | 0.1 | 0.077 (0.004) |
| T2D | Esophagus_Gastroesophageal_Junction | 0.5 | 0.078 (0.004) |
| T2D | Esophagus_Gastroesophageal_Junction | 1 | 0.078 (0.004) |
| T2D | Esophagus_Gastroesophageal_Junction | All | 0.085 (0.004) |
| T2D | Esophagus_Mucosa | 1e.06 | 0.022 (0.004) |
| T2D | Esophagus_Mucosa | 1e.05 | 0.032 (0.004) |
| T2D | Esophagus_Mucosa | 1e.04 | 0.042 (0.004) |
| T2D | Esophagus_Mucosa | 0.001 | 0.057 (0.004) |
| T2D | Esophagus_Mucosa | 0.01 | 0.066 (0.004) |
| T2D | Esophagus_Mucosa | 0.05 | 0.073 (0.004) |
| T2D | Esophagus_Mucosa | 0.1 | 0.076 (0.004) |
| T2D | Esophagus_Mucosa | 0.5 | 0.081 (0.004) |
| T2D | Esophagus_Mucosa | 1 | 0.081 (0.004) |
| T2D | Esophagus_Mucosa | All | 0.085 (0.004) |
| T2D | Esophagus_Muscularis | 1e.06 | 0.043 (0.004) |
| T2D | Esophagus_Muscularis | 1e.05 | 0.047 (0.004) |
| T2D | Esophagus_Muscularis | 1e.04 | 0.056 (0.004) |
| T2D | Esophagus_Muscularis | 0.001 | 0.065 (0.004) |
| T2D | Esophagus_Muscularis | 0.01 | 0.077 (0.004) |
| T2D | Esophagus_Muscularis | 0.05 | 0.083 (0.004) |
| T2D | Esophagus_Muscularis | 0.1 | 0.084 (0.004) |
| T2D | Esophagus_Muscularis | 0.5 | 0.091 (0.004) |
| T2D | Esophagus_Muscularis | 1 | 0.09 (0.004) |
| T2D | Esophagus_Muscularis | All | 0.097 (0.004) |
| T2D | Heart_Atrial_Appendage | 1e.06 | 0.044 (0.004) |
| T2D | Heart_Atrial_Appendage | 1e.05 | 0.053 (0.004) |
| T2D | Heart_Atrial_Appendage | 1e.04 | 0.059 (0.004) |
| T2D | Heart_Atrial_Appendage | 0.001 | 0.066 (0.004) |
| T2D | Heart_Atrial_Appendage | 0.01 | 0.074 (0.004) |
| T2D | Heart_Atrial_Appendage | 0.05 | 0.079 (0.004) |
| T2D | Heart_Atrial_Appendage | 0.1 | 0.081 (0.004) |
| T2D | Heart_Atrial_Appendage | 0.5 | 0.081 (0.004) |
| T2D | Heart_Atrial_Appendage | 1 | 0.081 (0.004) |
| T2D | Heart_Atrial_Appendage | All | 0.093 (0.004) |
| T2D | Heart_Left_Ventricle | 1e.06 | 0.035 (0.004) |
| T2D | Heart_Left_Ventricle | 1e.05 | 0.038 (0.004) |
| T2D | Heart_Left_Ventricle | 1e.04 | 0.047 (0.004) |
| T2D | Heart_Left_Ventricle | 0.001 | 0.061 (0.004) |
| T2D | Heart_Left_Ventricle | 0.01 | 0.066 (0.004) |
| T2D | Heart_Left_Ventricle | 0.05 | 0.075 (0.004) |
| T2D | Heart_Left_Ventricle | 0.1 | 0.08 (0.004) |
| T2D | Heart_Left_Ventricle | 0.5 | 0.079 (0.004) |
| T2D | Heart_Left_Ventricle | 1 | 0.079 (0.004) |
| T2D | Heart_Left_Ventricle | All | 0.087 (0.004) |
| T2D | Liver | 1e.06 | 0.033 (0.004) |
| T2D | Liver | 1e.05 | 0.042 (0.004) |
| T2D | Liver | 1e.04 | 0.039 (0.004) |
| T2D | Liver | 0.001 | 0.049 (0.004) |
| T2D | Liver | 0.01 | 0.052 (0.004) |
| T2D | Liver | 0.05 | 0.063 (0.004) |
| T2D | Liver | 0.1 | 0.067 (0.004) |
| T2D | Liver | 0.5 | 0.07 (0.004) |
| T2D | Liver | 1 | 0.069 (0.004) |
| T2D | Liver | All | 0.077 (0.004) |
| T2D | Lung | 1e.06 | 0.042 (0.004) |
| T2D | Lung | 1e.05 | 0.052 (0.004) |
| T2D | Lung | 1e.04 | 0.058 (0.004) |
| T2D | Lung | 0.001 | 0.063 (0.004) |
| T2D | Lung | 0.01 | 0.078 (0.004) |
| T2D | Lung | 0.05 | 0.082 (0.004) |
| T2D | Lung | 0.1 | 0.084 (0.004) |
| T2D | Lung | 0.5 | 0.086 (0.004) |
| T2D | Lung | 1 | 0.085 (0.004) |
| T2D | Lung | All | 0.093 (0.004) |
| T2D | METSIM.ADIPOSE.RNASEQ | 1e.06 | 0.029 (0.004) |
| T2D | METSIM.ADIPOSE.RNASEQ | 1e.05 | 0.036 (0.004) |
| T2D | METSIM.ADIPOSE.RNASEQ | 1e.04 | 0.039 (0.004) |
| T2D | METSIM.ADIPOSE.RNASEQ | 0.001 | 0.053 (0.004) |
| T2D | METSIM.ADIPOSE.RNASEQ | 0.01 | 0.06 (0.004) |
| T2D | METSIM.ADIPOSE.RNASEQ | 0.05 | 0.072 (0.004) |
| T2D | METSIM.ADIPOSE.RNASEQ | 0.1 | 0.078 (0.004) |
| T2D | METSIM.ADIPOSE.RNASEQ | 0.5 | 0.085 (0.004) |
| T2D | METSIM.ADIPOSE.RNASEQ | 1 | 0.085 (0.004) |
| T2D | METSIM.ADIPOSE.RNASEQ | All | 0.087 (0.004) |
| T2D | Minor_Salivary_Gland | 1e.06 | 0.012 (0.004) |
| T2D | Minor_Salivary_Gland | 1e.05 | 0.012 (0.004) |
| T2D | Minor_Salivary_Gland | 1e.04 | 0.02 (0.004) |
| T2D | Minor_Salivary_Gland | 0.001 | 0.024 (0.004) |
| T2D | Minor_Salivary_Gland | 0.01 | 0.036 (0.004) |
| T2D | Minor_Salivary_Gland | 0.05 | 0.048 (0.004) |
| T2D | Minor_Salivary_Gland | 0.1 | 0.054 (0.004) |
| T2D | Minor_Salivary_Gland | 0.5 | 0.054 (0.004) |
| T2D | Minor_Salivary_Gland | 1 | 0.053 (0.004) |
| T2D | Minor_Salivary_Gland | All | 0.055 (0.004) |
| T2D | Muscle_Skeletal | 1e.06 | 0.045 (0.004) |
| T2D | Muscle_Skeletal | 1e.05 | 0.053 (0.004) |
| T2D | Muscle_Skeletal | 1e.04 | 0.065 (0.004) |
| T2D | Muscle_Skeletal | 0.001 | 0.072 (0.004) |
| T2D | Muscle_Skeletal | 0.01 | 0.083 (0.004) |
| T2D | Muscle_Skeletal | 0.05 | 0.092 (0.004) |
| T2D | Muscle_Skeletal | 0.1 | 0.094 (0.004) |
| T2D | Muscle_Skeletal | 0.5 | 0.097 (0.004) |
| T2D | Muscle_Skeletal | 1 | 0.096 (0.004) |
| T2D | Muscle_Skeletal | All | 0.104 (0.004) |
| T2D | Nerve_Tibial | 1e.06 | 0.045 (0.004) |
| T2D | Nerve_Tibial | 1e.05 | 0.052 (0.004) |
| T2D | Nerve_Tibial | 1e.04 | 0.055 (0.004) |
| T2D | Nerve_Tibial | 0.001 | 0.08 (0.004) |
| T2D | Nerve_Tibial | 0.01 | 0.09 (0.004) |
| T2D | Nerve_Tibial | 0.05 | 0.098 (0.004) |
| T2D | Nerve_Tibial | 0.1 | 0.101 (0.004) |
| T2D | Nerve_Tibial | 0.5 | 0.098 (0.004) |
| T2D | Nerve_Tibial | 1 | 0.096 (0.004) |
| T2D | Nerve_Tibial | All | 0.109 (0.004) |
| T2D | NTR.BLOOD.RNAARR | 1e.06 | 0.055 (0.004) |
| T2D | NTR.BLOOD.RNAARR | 1e.05 | 0.06 (0.004) |
| T2D | NTR.BLOOD.RNAARR | 1e.04 | 0.06 (0.004) |
| T2D | NTR.BLOOD.RNAARR | 0.001 | 0.062 (0.004) |
| T2D | NTR.BLOOD.RNAARR | 0.01 | 0.061 (0.004) |
| T2D | NTR.BLOOD.RNAARR | 0.05 | 0.065 (0.004) |
| T2D | NTR.BLOOD.RNAARR | 0.1 | 0.064 (0.004) |
| T2D | NTR.BLOOD.RNAARR | 0.5 | 0.069 (0.004) |
| T2D | NTR.BLOOD.RNAARR | 1 | 0.068 (0.004) |
| T2D | NTR.BLOOD.RNAARR | All | 0.082 (0.004) |
| T2D | Ovary | 1e.06 | 0.015 (0.004) |
| T2D | Ovary | 1e.05 | 0.02 (0.004) |
| T2D | Ovary | 1e.04 | 0.03 (0.004) |
| T2D | Ovary | 0.001 | 0.038 (0.004) |
| T2D | Ovary | 0.01 | 0.053 (0.004) |
| T2D | Ovary | 0.05 | 0.063 (0.004) |
| T2D | Ovary | 0.1 | 0.067 (0.004) |
| T2D | Ovary | 0.5 | 0.064 (0.004) |
| T2D | Ovary | 1 | 0.063 (0.004) |
| T2D | Ovary | All | 0.069 (0.004) |
| T2D | Pancreas | 1e.06 | 0.036 (0.004) |
| T2D | Pancreas | 1e.05 | 0.041 (0.004) |
| T2D | Pancreas | 1e.04 | 0.048 (0.004) |
| T2D | Pancreas | 0.001 | 0.057 (0.004) |
| T2D | Pancreas | 0.01 | 0.061 (0.004) |
| T2D | Pancreas | 0.05 | 0.069 (0.004) |
| T2D | Pancreas | 0.1 | 0.074 (0.004) |
| T2D | Pancreas | 0.5 | 0.081 (0.004) |
| T2D | Pancreas | 1 | 0.081 (0.004) |
| T2D | Pancreas | All | 0.086 (0.004) |
| T2D | Pituitary | 1e.06 | 0.019 (0.004) |
| T2D | Pituitary | 1e.05 | 0.03 (0.004) |
| T2D | Pituitary | 1e.04 | 0.037 (0.004) |
| T2D | Pituitary | 0.001 | 0.053 (0.004) |
| T2D | Pituitary | 0.01 | 0.06 (0.004) |
| T2D | Pituitary | 0.05 | 0.064 (0.004) |
| T2D | Pituitary | 0.1 | 0.066 (0.004) |
| T2D | Pituitary | 0.5 | 0.071 (0.004) |
| T2D | Pituitary | 1 | 0.071 (0.004) |
| T2D | Pituitary | All | 0.076 (0.004) |
| T2D | Prostate | 1e.06 | 0.014 (0.004) |
| T2D | Prostate | 1e.05 | 0.02 (0.004) |
| T2D | Prostate | 1e.04 | 0.022 (0.004) |
| T2D | Prostate | 0.001 | 0.031 (0.004) |
| T2D | Prostate | 0.01 | 0.043 (0.004) |
| T2D | Prostate | 0.05 | 0.055 (0.004) |
| T2D | Prostate | 0.1 | 0.055 (0.004) |
| T2D | Prostate | 0.5 | 0.057 (0.004) |
| T2D | Prostate | 1 | 0.057 (0.004) |
| T2D | Prostate | All | 0.059 (0.004) |
| T2D | Skin_Not_Sun_Exposed_Suprapubic | 1e.06 | 0.042 (0.004) |
| T2D | Skin_Not_Sun_Exposed_Suprapubic | 1e.05 | 0.049 (0.004) |
| T2D | Skin_Not_Sun_Exposed_Suprapubic | 1e.04 | 0.059 (0.004) |
| T2D | Skin_Not_Sun_Exposed_Suprapubic | 0.001 | 0.058 (0.004) |
| T2D | Skin_Not_Sun_Exposed_Suprapubic | 0.01 | 0.073 (0.004) |
| T2D | Skin_Not_Sun_Exposed_Suprapubic | 0.05 | 0.079 (0.004) |
| T2D | Skin_Not_Sun_Exposed_Suprapubic | 0.1 | 0.084 (0.004) |
| T2D | Skin_Not_Sun_Exposed_Suprapubic | 0.5 | 0.087 (0.004) |
| T2D | Skin_Not_Sun_Exposed_Suprapubic | 1 | 0.087 (0.004) |
| T2D | Skin_Not_Sun_Exposed_Suprapubic | All | 0.094 (0.004) |
| T2D | Skin_Sun_Exposed_Lower_leg | 1e.06 | 0.036 (0.004) |
| T2D | Skin_Sun_Exposed_Lower_leg | 1e.05 | 0.045 (0.004) |
| T2D | Skin_Sun_Exposed_Lower_leg | 1e.04 | 0.054 (0.004) |
| T2D | Skin_Sun_Exposed_Lower_leg | 0.001 | 0.068 (0.004) |
| T2D | Skin_Sun_Exposed_Lower_leg | 0.01 | 0.076 (0.004) |
| T2D | Skin_Sun_Exposed_Lower_leg | 0.05 | 0.084 (0.004) |
| T2D | Skin_Sun_Exposed_Lower_leg | 0.1 | 0.086 (0.004) |
| T2D | Skin_Sun_Exposed_Lower_leg | 0.5 | 0.091 (0.004) |
| T2D | Skin_Sun_Exposed_Lower_leg | 1 | 0.089 (0.004) |
| T2D | Skin_Sun_Exposed_Lower_leg | All | 0.098 (0.004) |
| T2D | Small_Intestine_Terminal_Ileum | 1e.06 | 0.04 (0.004) |
| T2D | Small_Intestine_Terminal_Ileum | 1e.05 | 0.044 (0.004) |
| T2D | Small_Intestine_Terminal_Ileum | 1e.04 | 0.042 (0.004) |
| T2D | Small_Intestine_Terminal_Ileum | 0.001 | 0.052 (0.004) |
| T2D | Small_Intestine_Terminal_Ileum | 0.01 | 0.062 (0.004) |
| T2D | Small_Intestine_Terminal_Ileum | 0.05 | 0.067 (0.004) |
| T2D | Small_Intestine_Terminal_Ileum | 0.1 | 0.072 (0.004) |
| T2D | Small_Intestine_Terminal_Ileum | 0.5 | 0.069 (0.004) |
| T2D | Small_Intestine_Terminal_Ileum | 1 | 0.068 (0.004) |
| T2D | Small_Intestine_Terminal_Ileum | All | 0.076 (0.004) |
| T2D | Spleen | 1e.06 | 0.036 (0.004) |
| T2D | Spleen | 1e.05 | 0.035 (0.004) |
| T2D | Spleen | 1e.04 | 0.04 (0.004) |
| T2D | Spleen | 0.001 | 0.06 (0.004) |
| T2D | Spleen | 0.01 | 0.064 (0.004) |
| T2D | Spleen | 0.05 | 0.072 (0.004) |
| T2D | Spleen | 0.1 | 0.078 (0.004) |
| T2D | Spleen | 0.5 | 0.078 (0.004) |
| T2D | Spleen | 1 | 0.078 (0.004) |
| T2D | Spleen | All | 0.083 (0.004) |
| T2D | Stomach | 1e.06 | 0.022 (0.004) |
| T2D | Stomach | 1e.05 | 0.023 (0.004) |
| T2D | Stomach | 1e.04 | 0.027 (0.004) |
| T2D | Stomach | 0.001 | 0.046 (0.004) |
| T2D | Stomach | 0.01 | 0.062 (0.004) |
| T2D | Stomach | 0.05 | 0.071 (0.004) |
| T2D | Stomach | 0.1 | 0.074 (0.004) |
| T2D | Stomach | 0.5 | 0.079 (0.004) |
| T2D | Stomach | 1 | 0.079 (0.004) |
| T2D | Stomach | All | 0.081 (0.004) |
| T2D | Testis | 1e.06 | 0.044 (0.004) |
| T2D | Testis | 1e.05 | 0.048 (0.004) |
| T2D | Testis | 1e.04 | 0.055 (0.004) |
| T2D | Testis | 0.001 | 0.066 (0.004) |
| T2D | Testis | 0.01 | 0.08 (0.004) |
| T2D | Testis | 0.05 | 0.088 (0.004) |
| T2D | Testis | 0.1 | 0.088 (0.004) |
| T2D | Testis | 0.5 | 0.09 (0.004) |
| T2D | Testis | 1 | 0.092 (0.004) |
| T2D | Testis | All | 0.098 (0.004) |
| T2D | Thyroid | 1e.06 | 0.056 (0.004) |
| T2D | Thyroid | 1e.05 | 0.058 (0.004) |
| T2D | Thyroid | 1e.04 | 0.063 (0.004) |
| T2D | Thyroid | 0.001 | 0.066 (0.004) |
| T2D | Thyroid | 0.01 | 0.082 (0.004) |
| T2D | Thyroid | 0.05 | 0.09 (0.004) |
| T2D | Thyroid | 0.1 | 0.093 (0.004) |
| T2D | Thyroid | 0.5 | 0.099 (0.004) |
| T2D | Thyroid | 1 | 0.098 (0.004) |
| T2D | Thyroid | All | 0.106 (0.004) |
| T2D | Uterus | 1e.06 | 0.012 (0.004) |
| T2D | Uterus | 1e.05 | 0.02 (0.004) |
| T2D | Uterus | 1e.04 | 0.02 (0.004) |
| T2D | Uterus | 0.001 | 0.025 (0.004) |
| T2D | Uterus | 0.01 | 0.043 (0.004) |
| T2D | Uterus | 0.05 | 0.052 (0.004) |
| T2D | Uterus | 0.1 | 0.056 (0.004) |
| T2D | Uterus | 0.5 | 0.054 (0.004) |
| T2D | Uterus | 1 | 0.055 (0.004) |
| T2D | Uterus | All | 0.057 (0.004) |
| T2D | Vagina | 1e.05 | 0.005 (0.004) |
| T2D | Vagina | 1e.04 | 0.023 (0.004) |
| T2D | Vagina | 0.001 | 0.034 (0.004) |
| T2D | Vagina | 0.01 | 0.047 (0.004) |
| T2D | Vagina | 0.05 | 0.05 (0.004) |
| T2D | Vagina | 0.1 | 0.053 (0.004) |
| T2D | Vagina | 0.5 | 0.052 (0.004) |
| T2D | Vagina | 1 | 0.053 (0.004) |
| T2D | Vagina | All | 0.056 (0.004) |
| T2D | Whole_Blood | 1e.06 | 0.035 (0.004) |
| T2D | Whole_Blood | 1e.05 | 0.038 (0.004) |
| T2D | Whole_Blood | 1e.04 | 0.042 (0.004) |
| T2D | Whole_Blood | 0.001 | 0.05 (0.004) |
| T2D | Whole_Blood | 0.01 | 0.06 (0.004) |
| T2D | Whole_Blood | 0.05 | 0.074 (0.004) |
| T2D | Whole_Blood | 0.1 | 0.078 (0.004) |
| T2D | Whole_Blood | 0.5 | 0.083 (0.004) |
| T2D | Whole_Blood | 1 | 0.082 (0.004) |
| T2D | Whole_Blood | All | 0.087 (0.004) |
| T2D | YFS.BLOOD.RNAARR | 1e.06 | 0.034 (0.004) |
| T2D | YFS.BLOOD.RNAARR | 1e.05 | 0.036 (0.004) |
| T2D | YFS.BLOOD.RNAARR | 1e.04 | 0.044 (0.004) |
| T2D | YFS.BLOOD.RNAARR | 0.001 | 0.053 (0.004) |
| T2D | YFS.BLOOD.RNAARR | 0.01 | 0.065 (0.004) |
| T2D | YFS.BLOOD.RNAARR | 0.05 | 0.075 (0.004) |
| T2D | YFS.BLOOD.RNAARR | 0.1 | 0.078 (0.004) |
| T2D | YFS.BLOOD.RNAARR | 0.5 | 0.084 (0.004) |
| T2D | YFS.BLOOD.RNAARR | 1 | 0.084 (0.004) |
| T2D | YFS.BLOOD.RNAARR | All | 0.086 (0.004) |
| CAD | Adipose_Subcutaneous | 1e.06 | 0.034 (0.004) |
| CAD | Adipose_Subcutaneous | 1e.05 | 0.036 (0.004) |
| CAD | Adipose_Subcutaneous | 1e.04 | 0.048 (0.004) |
| CAD | Adipose_Subcutaneous | 0.001 | 0.05 (0.004) |
| CAD | Adipose_Subcutaneous | 0.01 | 0.055 (0.004) |
| CAD | Adipose_Subcutaneous | 0.05 | 0.064 (0.004) |
| CAD | Adipose_Subcutaneous | 0.1 | 0.068 (0.004) |
| CAD | Adipose_Subcutaneous | 0.5 | 0.071 (0.004) |
| CAD | Adipose_Subcutaneous | 1 | 0.072 (0.004) |
| CAD | Adipose_Subcutaneous | All | 0.076 (0.004) |
| CAD | Adipose_Visceral_Omentum | 1e.06 | 0.04 (0.004) |
| CAD | Adipose_Visceral_Omentum | 1e.05 | 0.042 (0.004) |
| CAD | Adipose_Visceral_Omentum | 1e.04 | 0.043 (0.004) |
| CAD | Adipose_Visceral_Omentum | 0.001 | 0.038 (0.004) |
| CAD | Adipose_Visceral_Omentum | 0.01 | 0.05 (0.004) |
| CAD | Adipose_Visceral_Omentum | 0.05 | 0.056 (0.004) |
| CAD | Adipose_Visceral_Omentum | 0.1 | 0.061 (0.004) |
| CAD | Adipose_Visceral_Omentum | 0.5 | 0.064 (0.004) |
| CAD | Adipose_Visceral_Omentum | 1 | 0.064 (0.004) |
| CAD | Adipose_Visceral_Omentum | All | 0.07 (0.004) |
| CAD | Adrenal_Gland | 1e.06 | 0.02 (0.004) |
| CAD | Adrenal_Gland | 1e.05 | 0.027 (0.004) |
| CAD | Adrenal_Gland | 1e.04 | 0.032 (0.004) |
| CAD | Adrenal_Gland | 0.001 | 0.032 (0.004) |
| CAD | Adrenal_Gland | 0.01 | 0.044 (0.004) |
| CAD | Adrenal_Gland | 0.05 | 0.051 (0.004) |
| CAD | Adrenal_Gland | 0.1 | 0.055 (0.004) |
| CAD | Adrenal_Gland | 0.5 | 0.058 (0.004) |
| CAD | Adrenal_Gland | 1 | 0.058 (0.004) |
| CAD | Adrenal_Gland | All | 0.058 (0.004) |
| CAD | Artery_Aorta | 1e.06 | 0.051 (0.004) |
| CAD | Artery_Aorta | 1e.05 | 0.053 (0.004) |
| CAD | Artery_Aorta | 1e.04 | 0.064 (0.004) |
| CAD | Artery_Aorta | 0.001 | 0.062 (0.004) |
| CAD | Artery_Aorta | 0.01 | 0.064 (0.004) |
| CAD | Artery_Aorta | 0.05 | 0.077 (0.004) |
| CAD | Artery_Aorta | 0.1 | 0.074 (0.004) |
| CAD | Artery_Aorta | 0.5 | 0.078 (0.004) |
| CAD | Artery_Aorta | 1 | 0.078 (0.004) |
| CAD | Artery_Aorta | All | 0.089 (0.004) |
| CAD | Artery_Coronary | 1e.06 | 0.033 (0.004) |
| CAD | Artery_Coronary | 1e.05 | 0.035 (0.004) |
| CAD | Artery_Coronary | 1e.04 | 0.04 (0.004) |
| CAD | Artery_Coronary | 0.001 | 0.042 (0.004) |
| CAD | Artery_Coronary | 0.01 | 0.049 (0.004) |
| CAD | Artery_Coronary | 0.05 | 0.057 (0.004) |
| CAD | Artery_Coronary | 0.1 | 0.057 (0.004) |
| CAD | Artery_Coronary | 0.5 | 0.059 (0.004) |
| CAD | Artery_Coronary | 1 | 0.059 (0.004) |
| CAD | Artery_Coronary | All | 0.064 (0.004) |
| CAD | Artery_Tibial | 1e.06 | 0.041 (0.004) |
| CAD | Artery_Tibial | 1e.05 | 0.048 (0.004) |
| CAD | Artery_Tibial | 1e.04 | 0.055 (0.004) |
| CAD | Artery_Tibial | 0.001 | 0.06 (0.004) |
| CAD | Artery_Tibial | 0.01 | 0.069 (0.004) |
| CAD | Artery_Tibial | 0.05 | 0.081 (0.004) |
| CAD | Artery_Tibial | 0.1 | 0.081 (0.004) |
| CAD | Artery_Tibial | 0.5 | 0.086 (0.004) |
| CAD | Artery_Tibial | 1 | 0.084 (0.004) |
| CAD | Artery_Tibial | All | 0.089 (0.004) |
| CAD | Brain_Amygdala | 1e.06 | 0.011 (0.004) |
| CAD | Brain_Amygdala | 1e.05 | 0.011 (0.004) |
| CAD | Brain_Amygdala | 1e.04 | 0.014 (0.004) |
| CAD | Brain_Amygdala | 0.001 | 0.013 (0.004) |
| CAD | Brain_Amygdala | 0.01 | 0.014 (0.004) |
| CAD | Brain_Amygdala | 0.05 | 0.029 (0.004) |
| CAD | Brain_Amygdala | 0.1 | 0.029 (0.004) |
| CAD | Brain_Amygdala | 0.5 | 0.036 (0.004) |
| CAD | Brain_Amygdala | 1 | 0.036 (0.004) |
| CAD | Brain_Amygdala | All | 0.034 (0.004) |
| CAD | Brain_Anterior_cingulate_cortex_BA24 | 1e.06 | 0.012 (0.004) |
| CAD | Brain_Anterior_cingulate_cortex_BA24 | 1e.05 | 0.015 (0.004) |
| CAD | Brain_Anterior_cingulate_cortex_BA24 | 1e.04 | 0.022 (0.004) |
| CAD | Brain_Anterior_cingulate_cortex_BA24 | 0.001 | 0.021 (0.004) |
| CAD | Brain_Anterior_cingulate_cortex_BA24 | 0.01 | 0.022 (0.004) |
| CAD | Brain_Anterior_cingulate_cortex_BA24 | 0.05 | 0.036 (0.004) |
| CAD | Brain_Anterior_cingulate_cortex_BA24 | 0.1 | 0.038 (0.004) |
| CAD | Brain_Anterior_cingulate_cortex_BA24 | 0.5 | 0.039 (0.004) |
| CAD | Brain_Anterior_cingulate_cortex_BA24 | 1 | 0.04 (0.004) |
| CAD | Brain_Anterior_cingulate_cortex_BA24 | All | 0.042 (0.004) |
| CAD | Brain_Caudate_basal_ganglia | 1e.06 | 0.02 (0.004) |
| CAD | Brain_Caudate_basal_ganglia | 1e.05 | 0.031 (0.004) |
| CAD | Brain_Caudate_basal_ganglia | 1e.04 | 0.034 (0.004) |
| CAD | Brain_Caudate_basal_ganglia | 0.001 | 0.037 (0.004) |
| CAD | Brain_Caudate_basal_ganglia | 0.01 | 0.038 (0.004) |
| CAD | Brain_Caudate_basal_ganglia | 0.05 | 0.049 (0.004) |
| CAD | Brain_Caudate_basal_ganglia | 0.1 | 0.051 (0.004) |
| CAD | Brain_Caudate_basal_ganglia | 0.5 | 0.053 (0.004) |
| CAD | Brain_Caudate_basal_ganglia | 1 | 0.054 (0.004) |
| CAD | Brain_Caudate_basal_ganglia | All | 0.058 (0.004) |
| CAD | Brain_Cerebellar_Hemisphere | 1e.06 | 0.024 (0.004) |
| CAD | Brain_Cerebellar_Hemisphere | 1e.05 | 0.03 (0.004) |
| CAD | Brain_Cerebellar_Hemisphere | 1e.04 | 0.025 (0.004) |
| CAD | Brain_Cerebellar_Hemisphere | 0.001 | 0.026 (0.004) |
| CAD | Brain_Cerebellar_Hemisphere | 0.01 | 0.03 (0.004) |
| CAD | Brain_Cerebellar_Hemisphere | 0.05 | 0.044 (0.004) |
| CAD | Brain_Cerebellar_Hemisphere | 0.1 | 0.048 (0.004) |
| CAD | Brain_Cerebellar_Hemisphere | 0.5 | 0.054 (0.004) |
| CAD | Brain_Cerebellar_Hemisphere | 1 | 0.055 (0.004) |
| CAD | Brain_Cerebellar_Hemisphere | All | 0.057 (0.004) |
| CAD | Brain_Cerebellum | 1e.06 | 0.023 (0.004) |
| CAD | Brain_Cerebellum | 1e.05 | 0.022 (0.004) |
| CAD | Brain_Cerebellum | 1e.04 | 0.025 (0.004) |
| CAD | Brain_Cerebellum | 0.001 | 0.025 (0.004) |
| CAD | Brain_Cerebellum | 0.01 | 0.029 (0.004) |
| CAD | Brain_Cerebellum | 0.05 | 0.044 (0.004) |
| CAD | Brain_Cerebellum | 0.1 | 0.047 (0.004) |
| CAD | Brain_Cerebellum | 0.5 | 0.049 (0.004) |
| CAD | Brain_Cerebellum | 1 | 0.05 (0.004) |
| CAD | Brain_Cerebellum | All | 0.052 (0.004) |
| CAD | Brain_Cortex | 1e.06 | 0.027 (0.004) |
| CAD | Brain_Cortex | 1e.05 | 0.035 (0.004) |
| CAD | Brain_Cortex | 1e.04 | 0.035 (0.004) |
| CAD | Brain_Cortex | 0.001 | 0.038 (0.004) |
| CAD | Brain_Cortex | 0.01 | 0.048 (0.004) |
| CAD | Brain_Cortex | 0.05 | 0.053 (0.004) |
| CAD | Brain_Cortex | 0.1 | 0.056 (0.004) |
| CAD | Brain_Cortex | 0.5 | 0.057 (0.004) |
| CAD | Brain_Cortex | 1 | 0.057 (0.004) |
| CAD | Brain_Cortex | All | 0.061 (0.004) |
| CAD | Brain_Frontal_Cortex_BA9 | 1e.06 | 0.022 (0.004) |
| CAD | Brain_Frontal_Cortex_BA9 | 1e.05 | 0.031 (0.004) |
| CAD | Brain_Frontal_Cortex_BA9 | 1e.04 | 0.031 (0.004) |
| CAD | Brain_Frontal_Cortex_BA9 | 0.001 | 0.023 (0.004) |
| CAD | Brain_Frontal_Cortex_BA9 | 0.01 | 0.028 (0.004) |
| CAD | Brain_Frontal_Cortex_BA9 | 0.05 | 0.038 (0.004) |
| CAD | Brain_Frontal_Cortex_BA9 | 0.1 | 0.038 (0.004) |
| CAD | Brain_Frontal_Cortex_BA9 | 0.5 | 0.039 (0.004) |
| CAD | Brain_Frontal_Cortex_BA9 | 1 | 0.04 (0.004) |
| CAD | Brain_Frontal_Cortex_BA9 | All | 0.047 (0.004) |
| CAD | Brain_Hippocampus | 1e.06 | 0.017 (0.004) |
| CAD | Brain_Hippocampus | 1e.05 | 0.023 (0.004) |
| CAD | Brain_Hippocampus | 1e.04 | 0.026 (0.004) |
| CAD | Brain_Hippocampus | 0.001 | 0.027 (0.004) |
| CAD | Brain_Hippocampus | 0.01 | 0.026 (0.004) |
| CAD | Brain_Hippocampus | 0.05 | 0.036 (0.004) |
| CAD | Brain_Hippocampus | 0.1 | 0.038 (0.004) |
| CAD | Brain_Hippocampus | 0.5 | 0.039 (0.004) |
| CAD | Brain_Hippocampus | 1 | 0.039 (0.004) |
| CAD | Brain_Hippocampus | All | 0.042 (0.004) |
| CAD | Brain_Hypothalamus | 1e.06 | 0.015 (0.004) |
| CAD | Brain_Hypothalamus | 1e.05 | 0.016 (0.004) |
| CAD | Brain_Hypothalamus | 1e.04 | 0.024 (0.004) |
| CAD | Brain_Hypothalamus | 0.001 | 0.029 (0.004) |
| CAD | Brain_Hypothalamus | 0.01 | 0.03 (0.004) |
| CAD | Brain_Hypothalamus | 0.05 | 0.035 (0.004) |
| CAD | Brain_Hypothalamus | 0.1 | 0.034 (0.004) |
| CAD | Brain_Hypothalamus | 0.5 | 0.037 (0.004) |
| CAD | Brain_Hypothalamus | 1 | 0.037 (0.004) |
| CAD | Brain_Hypothalamus | All | 0.038 (0.004) |
| CAD | Brain_Nucleus_accumbens_basal_ganglia | 1e.06 | 0.023 (0.004) |
| CAD | Brain_Nucleus_accumbens_basal_ganglia | 1e.05 | 0.026 (0.004) |
| CAD | Brain_Nucleus_accumbens_basal_ganglia | 1e.04 | 0.023 (0.004) |
| CAD | Brain_Nucleus_accumbens_basal_ganglia | 0.001 | 0.03 (0.004) |
| CAD | Brain_Nucleus_accumbens_basal_ganglia | 0.01 | 0.036 (0.004) |
| CAD | Brain_Nucleus_accumbens_basal_ganglia | 0.05 | 0.043 (0.004) |
| CAD | Brain_Nucleus_accumbens_basal_ganglia | 0.1 | 0.043 (0.004) |
| CAD | Brain_Nucleus_accumbens_basal_ganglia | 0.5 | 0.046 (0.004) |
| CAD | Brain_Nucleus_accumbens_basal_ganglia | 1 | 0.047 (0.004) |
| CAD | Brain_Nucleus_accumbens_basal_ganglia | All | 0.048 (0.004) |
| CAD | Brain_Putamen_basal_ganglia | 1e.06 | 0.013 (0.004) |
| CAD | Brain_Putamen_basal_ganglia | 1e.05 | 0.017 (0.004) |
| CAD | Brain_Putamen_basal_ganglia | 1e.04 | 0.019 (0.004) |
| CAD | Brain_Putamen_basal_ganglia | 0.001 | 0.029 (0.004) |
| CAD | Brain_Putamen_basal_ganglia | 0.01 | 0.034 (0.004) |
| CAD | Brain_Putamen_basal_ganglia | 0.05 | 0.041 (0.004) |
| CAD | Brain_Putamen_basal_ganglia | 0.1 | 0.041 (0.004) |
| CAD | Brain_Putamen_basal_ganglia | 0.5 | 0.043 (0.004) |
| CAD | Brain_Putamen_basal_ganglia | 1 | 0.043 (0.004) |
| CAD | Brain_Putamen_basal_ganglia | All | 0.043 (0.004) |
| CAD | Brain_Spinal_cord_cervical_c-1 | 1e.06 | 0.039 (0.004) |
| CAD | Brain_Spinal_cord_cervical_c-1 | 1e.05 | 0.041 (0.004) |
| CAD | Brain_Spinal_cord_cervical_c-1 | 1e.04 | 0.041 (0.004) |
| CAD | Brain_Spinal_cord_cervical_c-1 | 0.001 | 0.029 (0.004) |
| CAD | Brain_Spinal_cord_cervical_c-1 | 0.01 | 0.029 (0.004) |
| CAD | Brain_Spinal_cord_cervical_c-1 | 0.05 | 0.039 (0.004) |
| CAD | Brain_Spinal_cord_cervical_c-1 | 0.1 | 0.041 (0.004) |
| CAD | Brain_Spinal_cord_cervical_c-1 | 0.5 | 0.04 (0.004) |
| CAD | Brain_Spinal_cord_cervical_c-1 | 1 | 0.042 (0.004) |
| CAD | Brain_Spinal_cord_cervical_c-1 | All | 0.053 (0.004) |
| CAD | Brain_Substantia_nigra | 1e.06 | 0.015 (0.004) |
| CAD | Brain_Substantia_nigra | 1e.05 | 0.015 (0.004) |
| CAD | Brain_Substantia_nigra | 1e.04 | 0.015 (0.004) |
| CAD | Brain_Substantia_nigra | 0.001 | 0.02 (0.004) |
| CAD | Brain_Substantia_nigra | 0.01 | 0.022 (0.004) |
| CAD | Brain_Substantia_nigra | 0.05 | 0.028 (0.004) |
| CAD | Brain_Substantia_nigra | 0.1 | 0.034 (0.004) |
| CAD | Brain_Substantia_nigra | 0.5 | 0.041 (0.004) |
| CAD | Brain_Substantia_nigra | 1 | 0.041 (0.004) |
| CAD | Brain_Substantia_nigra | All | 0.041 (0.004) |
| CAD | Breast_Mammary_Tissue | 1e.06 | 0.023 (0.004) |
| CAD | Breast_Mammary_Tissue | 1e.05 | 0.031 (0.004) |
| CAD | Breast_Mammary_Tissue | 1e.04 | 0.035 (0.004) |
| CAD | Breast_Mammary_Tissue | 0.001 | 0.037 (0.004) |
| CAD | Breast_Mammary_Tissue | 0.01 | 0.041 (0.004) |
| CAD | Breast_Mammary_Tissue | 0.05 | 0.051 (0.004) |
| CAD | Breast_Mammary_Tissue | 0.1 | 0.055 (0.004) |
| CAD | Breast_Mammary_Tissue | 0.5 | 0.058 (0.004) |
| CAD | Breast_Mammary_Tissue | 1 | 0.057 (0.004) |
| CAD | Breast_Mammary_Tissue | All | 0.063 (0.004) |
| CAD | Cells_EBV-transformed_lymphocytes | 1e.06 | 0.018 (0.004) |
| CAD | Cells_EBV-transformed_lymphocytes | 1e.05 | 0.027 (0.004) |
| CAD | Cells_EBV-transformed_lymphocytes | 1e.04 | 0.03 (0.004) |
| CAD | Cells_EBV-transformed_lymphocytes | 0.001 | 0.026 (0.004) |
| CAD | Cells_EBV-transformed_lymphocytes | 0.01 | 0.034 (0.004) |
| CAD | Cells_EBV-transformed_lymphocytes | 0.05 | 0.039 (0.004) |
| CAD | Cells_EBV-transformed_lymphocytes | 0.1 | 0.04 (0.004) |
| CAD | Cells_EBV-transformed_lymphocytes | 0.5 | 0.048 (0.004) |
| CAD | Cells_EBV-transformed_lymphocytes | 1 | 0.049 (0.004) |
| CAD | Cells_EBV-transformed_lymphocytes | All | 0.051 (0.004) |
| CAD | Cells_Transformed_fibroblasts | 1e.06 | 0.037 (0.004) |
| CAD | Cells_Transformed_fibroblasts | 1e.05 | 0.042 (0.004) |
| CAD | Cells_Transformed_fibroblasts | 1e.04 | 0.05 (0.004) |
| CAD | Cells_Transformed_fibroblasts | 0.001 | 0.051 (0.004) |
| CAD | Cells_Transformed_fibroblasts | 0.01 | 0.063 (0.004) |
| CAD | Cells_Transformed_fibroblasts | 0.05 | 0.07 (0.004) |
| CAD | Cells_Transformed_fibroblasts | 0.1 | 0.075 (0.004) |
| CAD | Cells_Transformed_fibroblasts | 0.5 | 0.082 (0.004) |
| CAD | Cells_Transformed_fibroblasts | 1 | 0.082 (0.004) |
| CAD | Cells_Transformed_fibroblasts | All | 0.084 (0.004) |
| CAD | CMC.BRAIN.RNASEQ | 1e.06 | 0.047 (0.004) |
| CAD | CMC.BRAIN.RNASEQ | 1e.05 | 0.05 (0.004) |
| CAD | CMC.BRAIN.RNASEQ | 1e.04 | 0.052 (0.004) |
| CAD | CMC.BRAIN.RNASEQ | 0.001 | 0.061 (0.004) |
| CAD | CMC.BRAIN.RNASEQ | 0.01 | 0.067 (0.004) |
| CAD | CMC.BRAIN.RNASEQ | 0.05 | 0.072 (0.004) |
| CAD | CMC.BRAIN.RNASEQ | 0.1 | 0.073 (0.004) |
| CAD | CMC.BRAIN.RNASEQ | 0.5 | 0.071 (0.004) |
| CAD | CMC.BRAIN.RNASEQ | 1 | 0.072 (0.004) |
| CAD | CMC.BRAIN.RNASEQ | All | 0.081 (0.004) |
| CAD | CMC.BRAIN.RNASEQ_SPLICING | 1e.06 | 0.025 (0.004) |
| CAD | CMC.BRAIN.RNASEQ_SPLICING | 1e.05 | 0.02 (0.004) |
| CAD | CMC.BRAIN.RNASEQ_SPLICING | 1e.04 | 0.024 (0.004) |
| CAD | CMC.BRAIN.RNASEQ_SPLICING | 0.001 | 0.033 (0.004) |
| CAD | CMC.BRAIN.RNASEQ_SPLICING | 0.01 | 0.04 (0.004) |
| CAD | CMC.BRAIN.RNASEQ_SPLICING | 0.05 | 0.047 (0.004) |
| CAD | CMC.BRAIN.RNASEQ_SPLICING | 0.1 | 0.047 (0.004) |
| CAD | CMC.BRAIN.RNASEQ_SPLICING | 0.5 | 0.053 (0.004) |
| CAD | CMC.BRAIN.RNASEQ_SPLICING | 1 | 0.054 (0.004) |
| CAD | CMC.BRAIN.RNASEQ_SPLICING | All | 0.054 (0.004) |
| CAD | Colon_Sigmoid | 1e.06 | 0.025 (0.004) |
| CAD | Colon_Sigmoid | 1e.05 | 0.032 (0.004) |
| CAD | Colon_Sigmoid | 1e.04 | 0.032 (0.004) |
| CAD | Colon_Sigmoid | 0.001 | 0.037 (0.004) |
| CAD | Colon_Sigmoid | 0.01 | 0.048 (0.004) |
| CAD | Colon_Sigmoid | 0.05 | 0.054 (0.004) |
| CAD | Colon_Sigmoid | 0.1 | 0.054 (0.004) |
| CAD | Colon_Sigmoid | 0.5 | 0.06 (0.004) |
| CAD | Colon_Sigmoid | 1 | 0.059 (0.004) |
| CAD | Colon_Sigmoid | All | 0.061 (0.004) |
| CAD | Colon_Transverse | 1e.06 | 0.029 (0.004) |
| CAD | Colon_Transverse | 1e.05 | 0.035 (0.004) |
| CAD | Colon_Transverse | 1e.04 | 0.04 (0.004) |
| CAD | Colon_Transverse | 0.001 | 0.034 (0.004) |
| CAD | Colon_Transverse | 0.01 | 0.048 (0.004) |
| CAD | Colon_Transverse | 0.05 | 0.053 (0.004) |
| CAD | Colon_Transverse | 0.1 | 0.057 (0.004) |
| CAD | Colon_Transverse | 0.5 | 0.06 (0.004) |
| CAD | Colon_Transverse | 1 | 0.062 (0.004) |
| CAD | Colon_Transverse | All | 0.064 (0.004) |
| CAD | Esophagus_Gastroesophageal_Junction | 1e.06 | 0.027 (0.004) |
| CAD | Esophagus_Gastroesophageal_Junction | 1e.05 | 0.029 (0.004) |
| CAD | Esophagus_Gastroesophageal_Junction | 1e.04 | 0.03 (0.004) |
| CAD | Esophagus_Gastroesophageal_Junction | 0.001 | 0.029 (0.004) |
| CAD | Esophagus_Gastroesophageal_Junction | 0.01 | 0.033 (0.004) |
| CAD | Esophagus_Gastroesophageal_Junction | 0.05 | 0.047 (0.004) |
| CAD | Esophagus_Gastroesophageal_Junction | 0.1 | 0.046 (0.004) |
| CAD | Esophagus_Gastroesophageal_Junction | 0.5 | 0.054 (0.004) |
| CAD | Esophagus_Gastroesophageal_Junction | 1 | 0.055 (0.004) |
| CAD | Esophagus_Gastroesophageal_Junction | All | 0.058 (0.004) |
| CAD | Esophagus_Mucosa | 1e.06 | 0.039 (0.004) |
| CAD | Esophagus_Mucosa | 1e.05 | 0.043 (0.004) |
| CAD | Esophagus_Mucosa | 1e.04 | 0.047 (0.004) |
| CAD | Esophagus_Mucosa | 0.001 | 0.052 (0.004) |
| CAD | Esophagus_Mucosa | 0.01 | 0.051 (0.004) |
| CAD | Esophagus_Mucosa | 0.05 | 0.061 (0.004) |
| CAD | Esophagus_Mucosa | 0.1 | 0.06 (0.004) |
| CAD | Esophagus_Mucosa | 0.5 | 0.067 (0.004) |
| CAD | Esophagus_Mucosa | 1 | 0.069 (0.004) |
| CAD | Esophagus_Mucosa | All | 0.072 (0.004) |
| CAD | Esophagus_Muscularis | 1e.06 | 0.033 (0.004) |
| CAD | Esophagus_Muscularis | 1e.05 | 0.035 (0.004) |
| CAD | Esophagus_Muscularis | 1e.04 | 0.042 (0.004) |
| CAD | Esophagus_Muscularis | 0.001 | 0.041 (0.004) |
| CAD | Esophagus_Muscularis | 0.01 | 0.049 (0.004) |
| CAD | Esophagus_Muscularis | 0.05 | 0.057 (0.004) |
| CAD | Esophagus_Muscularis | 0.1 | 0.059 (0.004) |
| CAD | Esophagus_Muscularis | 0.5 | 0.066 (0.004) |
| CAD | Esophagus_Muscularis | 1 | 0.067 (0.004) |
| CAD | Esophagus_Muscularis | All | 0.069 (0.004) |
| CAD | Heart_Atrial_Appendage | 1e.06 | 0.021 (0.004) |
| CAD | Heart_Atrial_Appendage | 1e.05 | 0.022 (0.004) |
| CAD | Heart_Atrial_Appendage | 1e.04 | 0.032 (0.004) |
| CAD | Heart_Atrial_Appendage | 0.001 | 0.037 (0.004) |
| CAD | Heart_Atrial_Appendage | 0.01 | 0.047 (0.004) |
| CAD | Heart_Atrial_Appendage | 0.05 | 0.054 (0.004) |
| CAD | Heart_Atrial_Appendage | 0.1 | 0.059 (0.004) |
| CAD | Heart_Atrial_Appendage | 0.5 | 0.062 (0.004) |
| CAD | Heart_Atrial_Appendage | 1 | 0.063 (0.004) |
| CAD | Heart_Atrial_Appendage | All | 0.065 (0.004) |
| CAD | Heart_Left_Ventricle | 1e.06 | 0.03 (0.004) |
| CAD | Heart_Left_Ventricle | 1e.05 | 0.038 (0.004) |
| CAD | Heart_Left_Ventricle | 1e.04 | 0.04 (0.004) |
| CAD | Heart_Left_Ventricle | 0.001 | 0.041 (0.004) |
| CAD | Heart_Left_Ventricle | 0.01 | 0.048 (0.004) |
| CAD | Heart_Left_Ventricle | 0.05 | 0.056 (0.004) |
| CAD | Heart_Left_Ventricle | 0.1 | 0.055 (0.004) |
| CAD | Heart_Left_Ventricle | 0.5 | 0.059 (0.004) |
| CAD | Heart_Left_Ventricle | 1 | 0.06 (0.004) |
| CAD | Heart_Left_Ventricle | All | 0.066 (0.004) |
| CAD | Liver | 1e.06 | 0.028 (0.004) |
| CAD | Liver | 1e.05 | 0.03 (0.004) |
| CAD | Liver | 1e.04 | 0.03 (0.004) |
| CAD | Liver | 0.001 | 0.034 (0.004) |
| CAD | Liver | 0.01 | 0.033 (0.004) |
| CAD | Liver | 0.05 | 0.044 (0.004) |
| CAD | Liver | 0.1 | 0.044 (0.004) |
| CAD | Liver | 0.5 | 0.048 (0.004) |
| CAD | Liver | 1 | 0.048 (0.004) |
| CAD | Liver | All | 0.051 (0.004) |
| CAD | Lung | 1e.06 | 0.031 (0.004) |
| CAD | Lung | 1e.05 | 0.029 (0.004) |
| CAD | Lung | 1e.04 | 0.046 (0.004) |
| CAD | Lung | 0.001 | 0.045 (0.004) |
| CAD | Lung | 0.01 | 0.055 (0.004) |
| CAD | Lung | 0.05 | 0.063 (0.004) |
| CAD | Lung | 0.1 | 0.068 (0.004) |
| CAD | Lung | 0.5 | 0.071 (0.004) |
| CAD | Lung | 1 | 0.072 (0.004) |
| CAD | Lung | All | 0.076 (0.004) |
| CAD | METSIM.ADIPOSE.RNASEQ | 1e.06 | 0.023 (0.004) |
| CAD | METSIM.ADIPOSE.RNASEQ | 1e.05 | 0.032 (0.004) |
| CAD | METSIM.ADIPOSE.RNASEQ | 1e.04 | 0.042 (0.004) |
| CAD | METSIM.ADIPOSE.RNASEQ | 0.001 | 0.049 (0.004) |
| CAD | METSIM.ADIPOSE.RNASEQ | 0.01 | 0.056 (0.004) |
| CAD | METSIM.ADIPOSE.RNASEQ | 0.05 | 0.064 (0.004) |
| CAD | METSIM.ADIPOSE.RNASEQ | 0.1 | 0.069 (0.004) |
| CAD | METSIM.ADIPOSE.RNASEQ | 0.5 | 0.063 (0.004) |
| CAD | METSIM.ADIPOSE.RNASEQ | 1 | 0.063 (0.004) |
| CAD | METSIM.ADIPOSE.RNASEQ | All | 0.07 (0.004) |
| CAD | Minor_Salivary_Gland | 1e.06 | 0.005 (0.004) |
| CAD | Minor_Salivary_Gland | 1e.05 | 0.013 (0.004) |
| CAD | Minor_Salivary_Gland | 1e.04 | 0.021 (0.004) |
| CAD | Minor_Salivary_Gland | 0.001 | 0.017 (0.004) |
| CAD | Minor_Salivary_Gland | 0.01 | 0.03 (0.004) |
| CAD | Minor_Salivary_Gland | 0.05 | 0.038 (0.004) |
| CAD | Minor_Salivary_Gland | 0.1 | 0.04 (0.004) |
| CAD | Minor_Salivary_Gland | 0.5 | 0.042 (0.004) |
| CAD | Minor_Salivary_Gland | 1 | 0.041 (0.004) |
| CAD | Minor_Salivary_Gland | All | 0.043 (0.004) |
| CAD | Muscle_Skeletal | 1e.06 | 0.054 (0.004) |
| CAD | Muscle_Skeletal | 1e.05 | 0.054 (0.004) |
| CAD | Muscle_Skeletal | 1e.04 | 0.053 (0.004) |
| CAD | Muscle_Skeletal | 0.001 | 0.058 (0.004) |
| CAD | Muscle_Skeletal | 0.01 | 0.06 (0.004) |
| CAD | Muscle_Skeletal | 0.05 | 0.067 (0.004) |
| CAD | Muscle_Skeletal | 0.1 | 0.072 (0.004) |
| CAD | Muscle_Skeletal | 0.5 | 0.075 (0.004) |
| CAD | Muscle_Skeletal | 1 | 0.075 (0.004) |
| CAD | Muscle_Skeletal | All | 0.085 (0.004) |
| CAD | Nerve_Tibial | 1e.06 | 0.039 (0.004) |
| CAD | Nerve_Tibial | 1e.05 | 0.05 (0.004) |
| CAD | Nerve_Tibial | 1e.04 | 0.052 (0.004) |
| CAD | Nerve_Tibial | 0.001 | 0.05 (0.004) |
| CAD | Nerve_Tibial | 0.01 | 0.058 (0.004) |
| CAD | Nerve_Tibial | 0.05 | 0.072 (0.004) |
| CAD | Nerve_Tibial | 0.1 | 0.076 (0.004) |
| CAD | Nerve_Tibial | 0.5 | 0.08 (0.004) |
| CAD | Nerve_Tibial | 1 | 0.08 (0.004) |
| CAD | Nerve_Tibial | All | 0.086 (0.004) |
| CAD | NTR.BLOOD.RNAARR | 1e.06 | 0.03 (0.004) |
| CAD | NTR.BLOOD.RNAARR | 1e.05 | 0.032 (0.004) |
| CAD | NTR.BLOOD.RNAARR | 1e.04 | 0.037 (0.004) |
| CAD | NTR.BLOOD.RNAARR | 0.001 | 0.042 (0.004) |
| CAD | NTR.BLOOD.RNAARR | 0.01 | 0.05 (0.004) |
| CAD | NTR.BLOOD.RNAARR | 0.05 | 0.054 (0.004) |
| CAD | NTR.BLOOD.RNAARR | 0.1 | 0.057 (0.004) |
| CAD | NTR.BLOOD.RNAARR | 0.5 | 0.059 (0.004) |
| CAD | NTR.BLOOD.RNAARR | 1 | 0.059 (0.004) |
| CAD | NTR.BLOOD.RNAARR | All | 0.063 (0.004) |
| CAD | Ovary | 1e.06 | 0.015 (0.004) |
| CAD | Ovary | 1e.05 | 0.015 (0.004) |
| CAD | Ovary | 1e.04 | 0.023 (0.004) |
| CAD | Ovary | 0.001 | 0.032 (0.004) |
| CAD | Ovary | 0.01 | 0.044 (0.004) |
| CAD | Ovary | 0.05 | 0.044 (0.004) |
| CAD | Ovary | 0.1 | 0.046 (0.004) |
| CAD | Ovary | 0.5 | 0.05 (0.004) |
| CAD | Ovary | 1 | 0.051 (0.004) |
| CAD | Ovary | All | 0.054 (0.004) |
| CAD | Pancreas | 1e.06 | 0.033 (0.004) |
| CAD | Pancreas | 1e.05 | 0.037 (0.004) |
| CAD | Pancreas | 1e.04 | 0.039 (0.004) |
| CAD | Pancreas | 0.001 | 0.039 (0.004) |
| CAD | Pancreas | 0.01 | 0.047 (0.004) |
| CAD | Pancreas | 0.05 | 0.056 (0.004) |
| CAD | Pancreas | 0.1 | 0.061 (0.004) |
| CAD | Pancreas | 0.5 | 0.065 (0.004) |
| CAD | Pancreas | 1 | 0.065 (0.004) |
| CAD | Pancreas | All | 0.068 (0.004) |
| CAD | Pituitary | 1e.06 | 0.021 (0.004) |
| CAD | Pituitary | 1e.05 | 0.027 (0.004) |
| CAD | Pituitary | 1e.04 | 0.027 (0.004) |
| CAD | Pituitary | 0.001 | 0.031 (0.004) |
| CAD | Pituitary | 0.01 | 0.041 (0.004) |
| CAD | Pituitary | 0.05 | 0.049 (0.004) |
| CAD | Pituitary | 0.1 | 0.052 (0.004) |
| CAD | Pituitary | 0.5 | 0.055 (0.004) |
| CAD | Pituitary | 1 | 0.055 (0.004) |
| CAD | Pituitary | All | 0.057 (0.004) |
| CAD | Prostate | 1e.06 | 0.016 (0.004) |
| CAD | Prostate | 1e.05 | 0.021 (0.004) |
| CAD | Prostate | 1e.04 | 0.032 (0.004) |
| CAD | Prostate | 0.001 | 0.024 (0.004) |
| CAD | Prostate | 0.01 | 0.026 (0.004) |
| CAD | Prostate | 0.05 | 0.032 (0.004) |
| CAD | Prostate | 0.1 | 0.033 (0.004) |
| CAD | Prostate | 0.5 | 0.04 (0.004) |
| CAD | Prostate | 1 | 0.04 (0.004) |
| CAD | Prostate | All | 0.046 (0.004) |
| CAD | Skin_Not_Sun_Exposed_Suprapubic | 1e.06 | 0.036 (0.004) |
| CAD | Skin_Not_Sun_Exposed_Suprapubic | 1e.05 | 0.045 (0.004) |
| CAD | Skin_Not_Sun_Exposed_Suprapubic | 1e.04 | 0.045 (0.004) |
| CAD | Skin_Not_Sun_Exposed_Suprapubic | 0.001 | 0.043 (0.004) |
| CAD | Skin_Not_Sun_Exposed_Suprapubic | 0.01 | 0.043 (0.004) |
| CAD | Skin_Not_Sun_Exposed_Suprapubic | 0.05 | 0.054 (0.004) |
| CAD | Skin_Not_Sun_Exposed_Suprapubic | 0.1 | 0.06 (0.004) |
| CAD | Skin_Not_Sun_Exposed_Suprapubic | 0.5 | 0.065 (0.004) |
| CAD | Skin_Not_Sun_Exposed_Suprapubic | 1 | 0.066 (0.004) |
| CAD | Skin_Not_Sun_Exposed_Suprapubic | All | 0.072 (0.004) |
| CAD | Skin_Sun_Exposed_Lower_leg | 1e.06 | 0.033 (0.004) |
| CAD | Skin_Sun_Exposed_Lower_leg | 1e.05 | 0.041 (0.004) |
| CAD | Skin_Sun_Exposed_Lower_leg | 1e.04 | 0.047 (0.004) |
| CAD | Skin_Sun_Exposed_Lower_leg | 0.001 | 0.045 (0.004) |
| CAD | Skin_Sun_Exposed_Lower_leg | 0.01 | 0.05 (0.004) |
| CAD | Skin_Sun_Exposed_Lower_leg | 0.05 | 0.062 (0.004) |
| CAD | Skin_Sun_Exposed_Lower_leg | 0.1 | 0.068 (0.004) |
| CAD | Skin_Sun_Exposed_Lower_leg | 0.5 | 0.073 (0.004) |
| CAD | Skin_Sun_Exposed_Lower_leg | 1 | 0.074 (0.004) |
| CAD | Skin_Sun_Exposed_Lower_leg | All | 0.077 (0.004) |
| CAD | Small_Intestine_Terminal_Ileum | 1e.06 | 0.024 (0.004) |
| CAD | Small_Intestine_Terminal_Ileum | 1e.05 | 0.021 (0.004) |
| CAD | Small_Intestine_Terminal_Ileum | 1e.04 | 0.024 (0.004) |
| CAD | Small_Intestine_Terminal_Ileum | 0.001 | 0.016 (0.004) |
| CAD | Small_Intestine_Terminal_Ileum | 0.01 | 0.025 (0.004) |
| CAD | Small_Intestine_Terminal_Ileum | 0.05 | 0.035 (0.004) |
| CAD | Small_Intestine_Terminal_Ileum | 0.1 | 0.038 (0.004) |
| CAD | Small_Intestine_Terminal_Ileum | 0.5 | 0.042 (0.004) |
| CAD | Small_Intestine_Terminal_Ileum | 1 | 0.043 (0.004) |
| CAD | Small_Intestine_Terminal_Ileum | All | 0.048 (0.004) |
| CAD | Spleen | 1e.06 | 0.028 (0.004) |
| CAD | Spleen | 1e.05 | 0.03 (0.004) |
| CAD | Spleen | 1e.04 | 0.045 (0.004) |
| CAD | Spleen | 0.001 | 0.046 (0.004) |
| CAD | Spleen | 0.01 | 0.048 (0.004) |
| CAD | Spleen | 0.05 | 0.054 (0.004) |
| CAD | Spleen | 0.1 | 0.055 (0.004) |
| CAD | Spleen | 0.5 | 0.058 (0.004) |
| CAD | Spleen | 1 | 0.059 (0.004) |
| CAD | Spleen | All | 0.064 (0.004) |
| CAD | Stomach | 1e.06 | 0.02 (0.004) |
| CAD | Stomach | 1e.05 | 0.019 (0.004) |
| CAD | Stomach | 1e.04 | 0.023 (0.004) |
| CAD | Stomach | 0.001 | 0.03 (0.004) |
| CAD | Stomach | 0.01 | 0.04 (0.004) |
| CAD | Stomach | 0.05 | 0.046 (0.004) |
| CAD | Stomach | 0.1 | 0.052 (0.004) |
| CAD | Stomach | 0.5 | 0.059 (0.004) |
| CAD | Stomach | 1 | 0.059 (0.004) |
| CAD | Stomach | All | 0.058 (0.004) |
| CAD | Testis | 1e.06 | 0.033 (0.004) |
| CAD | Testis | 1e.05 | 0.04 (0.004) |
| CAD | Testis | 1e.04 | 0.048 (0.004) |
| CAD | Testis | 0.001 | 0.041 (0.004) |
| CAD | Testis | 0.01 | 0.046 (0.004) |
| CAD | Testis | 0.05 | 0.056 (0.004) |
| CAD | Testis | 0.1 | 0.059 (0.004) |
| CAD | Testis | 0.5 | 0.067 (0.004) |
| CAD | Testis | 1 | 0.067 (0.004) |
| CAD | Testis | All | 0.073 (0.004) |
| CAD | Thyroid | 1e.06 | 0.032 (0.004) |
| CAD | Thyroid | 1e.05 | 0.038 (0.004) |
| CAD | Thyroid | 1e.04 | 0.046 (0.004) |
| CAD | Thyroid | 0.001 | 0.045 (0.004) |
| CAD | Thyroid | 0.01 | 0.057 (0.004) |
| CAD | Thyroid | 0.05 | 0.065 (0.004) |
| CAD | Thyroid | 0.1 | 0.066 (0.004) |
| CAD | Thyroid | 0.5 | 0.077 (0.004) |
| CAD | Thyroid | 1 | 0.077 (0.004) |
| CAD | Thyroid | All | 0.08 (0.004) |
| CAD | Uterus | 1e.06 | 0.013 (0.004) |
| CAD | Uterus | 1e.05 | 0.018 (0.004) |
| CAD | Uterus | 1e.04 | 0.025 (0.004) |
| CAD | Uterus | 0.001 | 0.025 (0.004) |
| CAD | Uterus | 0.01 | 0.023 (0.004) |
| CAD | Uterus | 0.05 | 0.032 (0.004) |
| CAD | Uterus | 0.1 | 0.037 (0.004) |
| CAD | Uterus | 0.5 | 0.043 (0.004) |
| CAD | Uterus | 1 | 0.044 (0.004) |
| CAD | Uterus | All | 0.045 (0.004) |
| CAD | Vagina | 1e.06 | 0.016 (0.004) |
| CAD | Vagina | 1e.05 | 0.016 (0.004) |
| CAD | Vagina | 1e.04 | 0.018 (0.004) |
| CAD | Vagina | 0.001 | 0.025 (0.004) |
| CAD | Vagina | 0.01 | 0.026 (0.004) |
| CAD | Vagina | 0.05 | 0.032 (0.004) |
| CAD | Vagina | 0.1 | 0.034 (0.004) |
| CAD | Vagina | 0.5 | 0.039 (0.004) |
| CAD | Vagina | 1 | 0.039 (0.004) |
| CAD | Vagina | All | 0.039 (0.004) |
| CAD | Whole_Blood | 1e.06 | 0.03 (0.004) |
| CAD | Whole_Blood | 1e.05 | 0.034 (0.004) |
| CAD | Whole_Blood | 1e.04 | 0.044 (0.004) |
| CAD | Whole_Blood | 0.001 | 0.048 (0.004) |
| CAD | Whole_Blood | 0.01 | 0.054 (0.004) |
| CAD | Whole_Blood | 0.05 | 0.065 (0.004) |
| CAD | Whole_Blood | 0.1 | 0.069 (0.004) |
| CAD | Whole_Blood | 0.5 | 0.07 (0.004) |
| CAD | Whole_Blood | 1 | 0.07 (0.004) |
| CAD | Whole_Blood | All | 0.074 (0.004) |
| CAD | YFS.BLOOD.RNAARR | 1e.06 | 0.03 (0.004) |
| CAD | YFS.BLOOD.RNAARR | 1e.05 | 0.04 (0.004) |
| CAD | YFS.BLOOD.RNAARR | 1e.04 | 0.047 (0.004) |
| CAD | YFS.BLOOD.RNAARR | 0.001 | 0.051 (0.004) |
| CAD | YFS.BLOOD.RNAARR | 0.01 | 0.061 (0.004) |
| CAD | YFS.BLOOD.RNAARR | 0.05 | 0.062 (0.004) |
| CAD | YFS.BLOOD.RNAARR | 0.1 | 0.063 (0.004) |
| CAD | YFS.BLOOD.RNAARR | 0.5 | 0.063 (0.004) |
| CAD | YFS.BLOOD.RNAARR | 1 | 0.063 (0.004) |
| CAD | YFS.BLOOD.RNAARR | All | 0.071 (0.004) |
| IBD | Adipose_Subcutaneous | 1e.06 | 0.045 (0.004) |
| IBD | Adipose_Subcutaneous | 1e.05 | 0.047 (0.004) |
| IBD | Adipose_Subcutaneous | 1e.04 | 0.05 (0.004) |
| IBD | Adipose_Subcutaneous | 0.001 | 0.054 (0.004) |
| IBD | Adipose_Subcutaneous | 0.01 | 0.058 (0.004) |
| IBD | Adipose_Subcutaneous | 0.05 | 0.062 (0.004) |
| IBD | Adipose_Subcutaneous | 0.1 | 0.06 (0.004) |
| IBD | Adipose_Subcutaneous | 0.5 | 0.06 (0.004) |
| IBD | Adipose_Subcutaneous | 1 | 0.06 (0.004) |
| IBD | Adipose_Subcutaneous | All | 0.064 (0.004) |
| IBD | Adipose_Visceral_Omentum | 1e.06 | 0.036 (0.004) |
| IBD | Adipose_Visceral_Omentum | 1e.05 | 0.04 (0.004) |
| IBD | Adipose_Visceral_Omentum | 1e.04 | 0.042 (0.004) |
| IBD | Adipose_Visceral_Omentum | 0.001 | 0.049 (0.004) |
| IBD | Adipose_Visceral_Omentum | 0.01 | 0.051 (0.004) |
| IBD | Adipose_Visceral_Omentum | 0.05 | 0.056 (0.004) |
| IBD | Adipose_Visceral_Omentum | 0.1 | 0.057 (0.004) |
| IBD | Adipose_Visceral_Omentum | 0.5 | 0.058 (0.004) |
| IBD | Adipose_Visceral_Omentum | 1 | 0.058 (0.004) |
| IBD | Adipose_Visceral_Omentum | All | 0.06 (0.004) |
| IBD | Adrenal_Gland | 1e.06 | 0.023 (0.004) |
| IBD | Adrenal_Gland | 1e.05 | 0.028 (0.004) |
| IBD | Adrenal_Gland | 1e.04 | 0.035 (0.004) |
| IBD | Adrenal_Gland | 0.001 | 0.039 (0.004) |
| IBD | Adrenal_Gland | 0.01 | 0.043 (0.004) |
| IBD | Adrenal_Gland | 0.05 | 0.048 (0.004) |
| IBD | Adrenal_Gland | 0.1 | 0.048 (0.004) |
| IBD | Adrenal_Gland | 0.5 | 0.05 (0.004) |
| IBD | Adrenal_Gland | 1 | 0.05 (0.004) |
| IBD | Adrenal_Gland | All | 0.05 (0.004) |
| IBD | Artery_Aorta | 1e.06 | 0.035 (0.004) |
| IBD | Artery_Aorta | 1e.05 | 0.038 (0.004) |
| IBD | Artery_Aorta | 1e.04 | 0.038 (0.004) |
| IBD | Artery_Aorta | 0.001 | 0.043 (0.004) |
| IBD | Artery_Aorta | 0.01 | 0.051 (0.004) |
| IBD | Artery_Aorta | 0.05 | 0.052 (0.004) |
| IBD | Artery_Aorta | 0.1 | 0.054 (0.004) |
| IBD | Artery_Aorta | 0.5 | 0.051 (0.004) |
| IBD | Artery_Aorta | 1 | 0.051 (0.004) |
| IBD | Artery_Aorta | All | 0.055 (0.004) |
| IBD | Artery_Coronary | 1e.06 | 0.036 (0.004) |
| IBD | Artery_Coronary | 1e.05 | 0.036 (0.004) |
| IBD | Artery_Coronary | 1e.04 | 0.038 (0.004) |
| IBD | Artery_Coronary | 0.001 | 0.04 (0.004) |
| IBD | Artery_Coronary | 0.01 | 0.043 (0.004) |
| IBD | Artery_Coronary | 0.05 | 0.046 (0.004) |
| IBD | Artery_Coronary | 0.1 | 0.046 (0.004) |
| IBD | Artery_Coronary | 0.5 | 0.043 (0.004) |
| IBD | Artery_Coronary | 1 | 0.043 (0.004) |
| IBD | Artery_Coronary | All | 0.047 (0.004) |
| IBD | Artery_Tibial | 1e.06 | 0.038 (0.004) |
| IBD | Artery_Tibial | 1e.05 | 0.041 (0.004) |
| IBD | Artery_Tibial | 1e.04 | 0.042 (0.004) |
| IBD | Artery_Tibial | 0.001 | 0.047 (0.004) |
| IBD | Artery_Tibial | 0.01 | 0.052 (0.004) |
| IBD | Artery_Tibial | 0.05 | 0.059 (0.004) |
| IBD | Artery_Tibial | 0.1 | 0.058 (0.004) |
| IBD | Artery_Tibial | 0.5 | 0.058 (0.004) |
| IBD | Artery_Tibial | 1 | 0.058 (0.004) |
| IBD | Artery_Tibial | All | 0.06 (0.004) |
| IBD | Brain_Amygdala | 1e.06 | 0.03 (0.004) |
| IBD | Brain_Amygdala | 1e.05 | 0.031 (0.004) |
| IBD | Brain_Amygdala | 1e.04 | 0.032 (0.004) |
| IBD | Brain_Amygdala | 0.001 | 0.028 (0.004) |
| IBD | Brain_Amygdala | 0.01 | 0.029 (0.004) |
| IBD | Brain_Amygdala | 0.05 | 0.033 (0.004) |
| IBD | Brain_Amygdala | 0.1 | 0.033 (0.004) |
| IBD | Brain_Amygdala | 0.5 | 0.034 (0.004) |
| IBD | Brain_Amygdala | 1 | 0.034 (0.004) |
| IBD | Brain_Amygdala | All | 0.036 (0.004) |
| IBD | Brain_Anterior_cingulate_cortex_BA24 | 1e.06 | 0.033 (0.004) |
| IBD | Brain_Anterior_cingulate_cortex_BA24 | 1e.05 | 0.035 (0.004) |
| IBD | Brain_Anterior_cingulate_cortex_BA24 | 1e.04 | 0.037 (0.004) |
| IBD | Brain_Anterior_cingulate_cortex_BA24 | 0.001 | 0.036 (0.004) |
| IBD | Brain_Anterior_cingulate_cortex_BA24 | 0.01 | 0.039 (0.004) |
| IBD | Brain_Anterior_cingulate_cortex_BA24 | 0.05 | 0.038 (0.004) |
| IBD | Brain_Anterior_cingulate_cortex_BA24 | 0.1 | 0.04 (0.004) |
| IBD | Brain_Anterior_cingulate_cortex_BA24 | 0.5 | 0.041 (0.004) |
| IBD | Brain_Anterior_cingulate_cortex_BA24 | 1 | 0.041 (0.004) |
| IBD | Brain_Anterior_cingulate_cortex_BA24 | All | 0.044 (0.004) |
| IBD | Brain_Caudate_basal_ganglia | 1e.06 | 0.024 (0.004) |
| IBD | Brain_Caudate_basal_ganglia | 1e.05 | 0.025 (0.004) |
| IBD | Brain_Caudate_basal_ganglia | 1e.04 | 0.03 (0.004) |
| IBD | Brain_Caudate_basal_ganglia | 0.001 | 0.032 (0.004) |
| IBD | Brain_Caudate_basal_ganglia | 0.01 | 0.04 (0.004) |
| IBD | Brain_Caudate_basal_ganglia | 0.05 | 0.042 (0.004) |
| IBD | Brain_Caudate_basal_ganglia | 0.1 | 0.041 (0.004) |
| IBD | Brain_Caudate_basal_ganglia | 0.5 | 0.043 (0.004) |
| IBD | Brain_Caudate_basal_ganglia | 1 | 0.043 (0.004) |
| IBD | Brain_Caudate_basal_ganglia | All | 0.045 (0.004) |
| IBD | Brain_Cerebellar_Hemisphere | 1e.06 | 0.041 (0.004) |
| IBD | Brain_Cerebellar_Hemisphere | 1e.05 | 0.042 (0.004) |
| IBD | Brain_Cerebellar_Hemisphere | 1e.04 | 0.043 (0.004) |
| IBD | Brain_Cerebellar_Hemisphere | 0.001 | 0.043 (0.004) |
| IBD | Brain_Cerebellar_Hemisphere | 0.01 | 0.046 (0.004) |
| IBD | Brain_Cerebellar_Hemisphere | 0.05 | 0.045 (0.004) |
| IBD | Brain_Cerebellar_Hemisphere | 0.1 | 0.043 (0.004) |
| IBD | Brain_Cerebellar_Hemisphere | 0.5 | 0.048 (0.004) |
| IBD | Brain_Cerebellar_Hemisphere | 1 | 0.046 (0.004) |
| IBD | Brain_Cerebellar_Hemisphere | All | 0.052 (0.004) |
| IBD | Brain_Cerebellum | 1e.06 | 0.042 (0.004) |
| IBD | Brain_Cerebellum | 1e.05 | 0.045 (0.004) |
| IBD | Brain_Cerebellum | 1e.04 | 0.045 (0.004) |
| IBD | Brain_Cerebellum | 0.001 | 0.046 (0.004) |
| IBD | Brain_Cerebellum | 0.01 | 0.048 (0.004) |
| IBD | Brain_Cerebellum | 0.05 | 0.048 (0.004) |
| IBD | Brain_Cerebellum | 0.1 | 0.049 (0.004) |
| IBD | Brain_Cerebellum | 0.5 | 0.054 (0.004) |
| IBD | Brain_Cerebellum | 1 | 0.053 (0.004) |
| IBD | Brain_Cerebellum | All | 0.057 (0.004) |
| IBD | Brain_Cortex | 1e.06 | 0.038 (0.004) |
| IBD | Brain_Cortex | 1e.05 | 0.039 (0.004) |
| IBD | Brain_Cortex | 1e.04 | 0.041 (0.004) |
| IBD | Brain_Cortex | 0.001 | 0.037 (0.004) |
| IBD | Brain_Cortex | 0.01 | 0.039 (0.004) |
| IBD | Brain_Cortex | 0.05 | 0.045 (0.004) |
| IBD | Brain_Cortex | 0.1 | 0.047 (0.004) |
| IBD | Brain_Cortex | 0.5 | 0.049 (0.004) |
| IBD | Brain_Cortex | 1 | 0.048 (0.004) |
| IBD | Brain_Cortex | All | 0.051 (0.004) |
| IBD | Brain_Frontal_Cortex_BA9 | 1e.06 | 0.024 (0.004) |
| IBD | Brain_Frontal_Cortex_BA9 | 1e.05 | 0.026 (0.004) |
| IBD | Brain_Frontal_Cortex_BA9 | 1e.04 | 0.029 (0.004) |
| IBD | Brain_Frontal_Cortex_BA9 | 0.001 | 0.032 (0.004) |
| IBD | Brain_Frontal_Cortex_BA9 | 0.01 | 0.037 (0.004) |
| IBD | Brain_Frontal_Cortex_BA9 | 0.05 | 0.037 (0.004) |
| IBD | Brain_Frontal_Cortex_BA9 | 0.1 | 0.037 (0.004) |
| IBD | Brain_Frontal_Cortex_BA9 | 0.5 | 0.038 (0.004) |
| IBD | Brain_Frontal_Cortex_BA9 | 1 | 0.037 (0.004) |
| IBD | Brain_Frontal_Cortex_BA9 | All | 0.04 (0.004) |
| IBD | Brain_Hippocampus | 1e.06 | 0.03 (0.004) |
| IBD | Brain_Hippocampus | 1e.05 | 0.036 (0.004) |
| IBD | Brain_Hippocampus | 1e.04 | 0.036 (0.004) |
| IBD | Brain_Hippocampus | 0.001 | 0.036 (0.004) |
| IBD | Brain_Hippocampus | 0.01 | 0.034 (0.004) |
| IBD | Brain_Hippocampus | 0.05 | 0.034 (0.004) |
| IBD | Brain_Hippocampus | 0.1 | 0.033 (0.004) |
| IBD | Brain_Hippocampus | 0.5 | 0.037 (0.004) |
| IBD | Brain_Hippocampus | 1 | 0.036 (0.004) |
| IBD | Brain_Hippocampus | All | 0.042 (0.004) |
| IBD | Brain_Hypothalamus | 1e.06 | 0.025 (0.004) |
| IBD | Brain_Hypothalamus | 1e.05 | 0.026 (0.004) |
| IBD | Brain_Hypothalamus | 1e.04 | 0.028 (0.004) |
| IBD | Brain_Hypothalamus | 0.001 | 0.029 (0.004) |
| IBD | Brain_Hypothalamus | 0.01 | 0.031 (0.004) |
| IBD | Brain_Hypothalamus | 0.05 | 0.035 (0.004) |
| IBD | Brain_Hypothalamus | 0.1 | 0.036 (0.004) |
| IBD | Brain_Hypothalamus | 0.5 | 0.038 (0.004) |
| IBD | Brain_Hypothalamus | 1 | 0.037 (0.004) |
| IBD | Brain_Hypothalamus | All | 0.037 (0.004) |
| IBD | Brain_Nucleus_accumbens_basal_ganglia | 1e.06 | 0.038 (0.004) |
| IBD | Brain_Nucleus_accumbens_basal_ganglia | 1e.05 | 0.038 (0.004) |
| IBD | Brain_Nucleus_accumbens_basal_ganglia | 1e.04 | 0.04 (0.004) |
| IBD | Brain_Nucleus_accumbens_basal_ganglia | 0.001 | 0.04 (0.004) |
| IBD | Brain_Nucleus_accumbens_basal_ganglia | 0.01 | 0.044 (0.004) |
| IBD | Brain_Nucleus_accumbens_basal_ganglia | 0.05 | 0.044 (0.004) |
| IBD | Brain_Nucleus_accumbens_basal_ganglia | 0.1 | 0.043 (0.004) |
| IBD | Brain_Nucleus_accumbens_basal_ganglia | 0.5 | 0.044 (0.004) |
| IBD | Brain_Nucleus_accumbens_basal_ganglia | 1 | 0.044 (0.004) |
| IBD | Brain_Nucleus_accumbens_basal_ganglia | All | 0.048 (0.004) |
| IBD | Brain_Putamen_basal_ganglia | 1e.06 | 0.03 (0.004) |
| IBD | Brain_Putamen_basal_ganglia | 1e.05 | 0.037 (0.004) |
| IBD | Brain_Putamen_basal_ganglia | 1e.04 | 0.038 (0.004) |
| IBD | Brain_Putamen_basal_ganglia | 0.001 | 0.032 (0.004) |
| IBD | Brain_Putamen_basal_ganglia | 0.01 | 0.032 (0.004) |
| IBD | Brain_Putamen_basal_ganglia | 0.05 | 0.033 (0.004) |
| IBD | Brain_Putamen_basal_ganglia | 0.1 | 0.036 (0.004) |
| IBD | Brain_Putamen_basal_ganglia | 0.5 | 0.033 (0.004) |
| IBD | Brain_Putamen_basal_ganglia | 1 | 0.033 (0.004) |
| IBD | Brain_Putamen_basal_ganglia | All | 0.042 (0.004) |
| IBD | Brain_Spinal_cord_cervical_c-1 | 1e.06 | 0.026 (0.004) |
| IBD | Brain_Spinal_cord_cervical_c-1 | 1e.05 | 0.027 (0.004) |
| IBD | Brain_Spinal_cord_cervical_c-1 | 1e.04 | 0.027 (0.004) |
| IBD | Brain_Spinal_cord_cervical_c-1 | 0.001 | 0.028 (0.004) |
| IBD | Brain_Spinal_cord_cervical_c-1 | 0.01 | 0.026 (0.004) |
| IBD | Brain_Spinal_cord_cervical_c-1 | 0.05 | 0.023 (0.004) |
| IBD | Brain_Spinal_cord_cervical_c-1 | 0.1 | 0.025 (0.004) |
| IBD | Brain_Spinal_cord_cervical_c-1 | 0.5 | 0.026 (0.004) |
| IBD | Brain_Spinal_cord_cervical_c-1 | 1 | 0.025 (0.004) |
| IBD | Brain_Spinal_cord_cervical_c-1 | All | 0.032 (0.004) |
| IBD | Brain_Substantia_nigra | 1e.06 | 0.022 (0.004) |
| IBD | Brain_Substantia_nigra | 1e.05 | 0.022 (0.004) |
| IBD | Brain_Substantia_nigra | 1e.04 | 0.028 (0.004) |
| IBD | Brain_Substantia_nigra | 0.001 | 0.015 (0.004) |
| IBD | Brain_Substantia_nigra | 0.01 | 0.023 (0.004) |
| IBD | Brain_Substantia_nigra | 0.05 | 0.023 (0.004) |
| IBD | Brain_Substantia_nigra | 0.1 | 0.022 (0.004) |
| IBD | Brain_Substantia_nigra | 0.5 | 0.026 (0.004) |
| IBD | Brain_Substantia_nigra | 1 | 0.026 (0.004) |
| IBD | Brain_Substantia_nigra | All | 0.034 (0.004) |
| IBD | Breast_Mammary_Tissue | 1e.06 | 0.035 (0.004) |
| IBD | Breast_Mammary_Tissue | 1e.05 | 0.038 (0.004) |
| IBD | Breast_Mammary_Tissue | 1e.04 | 0.04 (0.004) |
| IBD | Breast_Mammary_Tissue | 0.001 | 0.04 (0.004) |
| IBD | Breast_Mammary_Tissue | 0.01 | 0.044 (0.004) |
| IBD | Breast_Mammary_Tissue | 0.05 | 0.047 (0.004) |
| IBD | Breast_Mammary_Tissue | 0.1 | 0.05 (0.004) |
| IBD | Breast_Mammary_Tissue | 0.5 | 0.052 (0.004) |
| IBD | Breast_Mammary_Tissue | 1 | 0.052 (0.004) |
| IBD | Breast_Mammary_Tissue | All | 0.054 (0.004) |
| IBD | Cells_EBV-transformed_lymphocytes | 1e.06 | 0.041 (0.004) |
| IBD | Cells_EBV-transformed_lymphocytes | 1e.05 | 0.041 (0.004) |
| IBD | Cells_EBV-transformed_lymphocytes | 1e.04 | 0.043 (0.004) |
| IBD | Cells_EBV-transformed_lymphocytes | 0.001 | 0.042 (0.004) |
| IBD | Cells_EBV-transformed_lymphocytes | 0.01 | 0.042 (0.004) |
| IBD | Cells_EBV-transformed_lymphocytes | 0.05 | 0.042 (0.004) |
| IBD | Cells_EBV-transformed_lymphocytes | 0.1 | 0.038 (0.004) |
| IBD | Cells_EBV-transformed_lymphocytes | 0.5 | 0.038 (0.004) |
| IBD | Cells_EBV-transformed_lymphocytes | 1 | 0.038 (0.004) |
| IBD | Cells_EBV-transformed_lymphocytes | All | 0.047 (0.004) |
| IBD | Cells_Transformed_fibroblasts | 1e.06 | 0.047 (0.004) |
| IBD | Cells_Transformed_fibroblasts | 1e.05 | 0.044 (0.004) |
| IBD | Cells_Transformed_fibroblasts | 1e.04 | 0.046 (0.004) |
| IBD | Cells_Transformed_fibroblasts | 0.001 | 0.049 (0.004) |
| IBD | Cells_Transformed_fibroblasts | 0.01 | 0.05 (0.004) |
| IBD | Cells_Transformed_fibroblasts | 0.05 | 0.057 (0.004) |
| IBD | Cells_Transformed_fibroblasts | 0.1 | 0.059 (0.004) |
| IBD | Cells_Transformed_fibroblasts | 0.5 | 0.057 (0.004) |
| IBD | Cells_Transformed_fibroblasts | 1 | 0.058 (0.004) |
| IBD | Cells_Transformed_fibroblasts | All | 0.061 (0.004) |
| IBD | CMC.BRAIN.RNASEQ | 1e.06 | 0.04 (0.004) |
| IBD | CMC.BRAIN.RNASEQ | 1e.05 | 0.041 (0.004) |
| IBD | CMC.BRAIN.RNASEQ | 1e.04 | 0.048 (0.004) |
| IBD | CMC.BRAIN.RNASEQ | 0.001 | 0.049 (0.004) |
| IBD | CMC.BRAIN.RNASEQ | 0.01 | 0.051 (0.004) |
| IBD | CMC.BRAIN.RNASEQ | 0.05 | 0.053 (0.004) |
| IBD | CMC.BRAIN.RNASEQ | 0.1 | 0.055 (0.004) |
| IBD | CMC.BRAIN.RNASEQ | 0.5 | 0.051 (0.004) |
| IBD | CMC.BRAIN.RNASEQ | 1 | 0.052 (0.004) |
| IBD | CMC.BRAIN.RNASEQ | All | 0.058 (0.004) |
| IBD | CMC.BRAIN.RNASEQ_SPLICING | 1e.06 | 0.04 (0.004) |
| IBD | CMC.BRAIN.RNASEQ_SPLICING | 1e.05 | 0.037 (0.004) |
| IBD | CMC.BRAIN.RNASEQ_SPLICING | 1e.04 | 0.038 (0.004) |
| IBD | CMC.BRAIN.RNASEQ_SPLICING | 0.001 | 0.039 (0.004) |
| IBD | CMC.BRAIN.RNASEQ_SPLICING | 0.01 | 0.041 (0.004) |
| IBD | CMC.BRAIN.RNASEQ_SPLICING | 0.05 | 0.045 (0.004) |
| IBD | CMC.BRAIN.RNASEQ_SPLICING | 0.1 | 0.047 (0.004) |
| IBD | CMC.BRAIN.RNASEQ_SPLICING | 0.5 | 0.044 (0.004) |
| IBD | CMC.BRAIN.RNASEQ_SPLICING | 1 | 0.043 (0.004) |
| IBD | CMC.BRAIN.RNASEQ_SPLICING | All | 0.047 (0.004) |
| IBD | Colon_Sigmoid | 1e.06 | 0.04 (0.004) |
| IBD | Colon_Sigmoid | 1e.05 | 0.042 (0.004) |
| IBD | Colon_Sigmoid | 1e.04 | 0.044 (0.004) |
| IBD | Colon_Sigmoid | 0.001 | 0.043 (0.004) |
| IBD | Colon_Sigmoid | 0.01 | 0.045 (0.004) |
| IBD | Colon_Sigmoid | 0.05 | 0.049 (0.004) |
| IBD | Colon_Sigmoid | 0.1 | 0.05 (0.004) |
| IBD | Colon_Sigmoid | 0.5 | 0.051 (0.004) |
| IBD | Colon_Sigmoid | 1 | 0.05 (0.004) |
| IBD | Colon_Sigmoid | All | 0.054 (0.004) |
| IBD | Colon_Transverse | 1e.06 | 0.042 (0.004) |
| IBD | Colon_Transverse | 1e.05 | 0.044 (0.004) |
| IBD | Colon_Transverse | 1e.04 | 0.042 (0.004) |
| IBD | Colon_Transverse | 0.001 | 0.047 (0.004) |
| IBD | Colon_Transverse | 0.01 | 0.052 (0.004) |
| IBD | Colon_Transverse | 0.05 | 0.05 (0.004) |
| IBD | Colon_Transverse | 0.1 | 0.051 (0.004) |
| IBD | Colon_Transverse | 0.5 | 0.051 (0.004) |
| IBD | Colon_Transverse | 1 | 0.05 (0.004) |
| IBD | Colon_Transverse | All | 0.055 (0.004) |
| IBD | Esophagus_Gastroesophageal_Junction | 1e.06 | 0.031 (0.004) |
| IBD | Esophagus_Gastroesophageal_Junction | 1e.05 | 0.035 (0.004) |
| IBD | Esophagus_Gastroesophageal_Junction | 1e.04 | 0.038 (0.004) |
| IBD | Esophagus_Gastroesophageal_Junction | 0.001 | 0.041 (0.004) |
| IBD | Esophagus_Gastroesophageal_Junction | 0.01 | 0.044 (0.004) |
| IBD | Esophagus_Gastroesophageal_Junction | 0.05 | 0.047 (0.004) |
| IBD | Esophagus_Gastroesophageal_Junction | 0.1 | 0.05 (0.004) |
| IBD | Esophagus_Gastroesophageal_Junction | 0.5 | 0.053 (0.004) |
| IBD | Esophagus_Gastroesophageal_Junction | 1 | 0.051 (0.004) |
| IBD | Esophagus_Gastroesophageal_Junction | All | 0.053 (0.004) |
| IBD | Esophagus_Mucosa | 1e.06 | 0.046 (0.004) |
| IBD | Esophagus_Mucosa | 1e.05 | 0.049 (0.004) |
| IBD | Esophagus_Mucosa | 1e.04 | 0.052 (0.004) |
| IBD | Esophagus_Mucosa | 0.001 | 0.051 (0.004) |
| IBD | Esophagus_Mucosa | 0.01 | 0.053 (0.004) |
| IBD | Esophagus_Mucosa | 0.05 | 0.055 (0.004) |
| IBD | Esophagus_Mucosa | 0.1 | 0.057 (0.004) |
| IBD | Esophagus_Mucosa | 0.5 | 0.059 (0.004) |
| IBD | Esophagus_Mucosa | 1 | 0.059 (0.004) |
| IBD | Esophagus_Mucosa | All | 0.063 (0.004) |
| IBD | Esophagus_Muscularis | 1e.06 | 0.04 (0.004) |
| IBD | Esophagus_Muscularis | 1e.05 | 0.045 (0.004) |
| IBD | Esophagus_Muscularis | 1e.04 | 0.045 (0.004) |
| IBD | Esophagus_Muscularis | 0.001 | 0.048 (0.004) |
| IBD | Esophagus_Muscularis | 0.01 | 0.054 (0.004) |
| IBD | Esophagus_Muscularis | 0.05 | 0.057 (0.004) |
| IBD | Esophagus_Muscularis | 0.1 | 0.058 (0.004) |
| IBD | Esophagus_Muscularis | 0.5 | 0.062 (0.004) |
| IBD | Esophagus_Muscularis | 1 | 0.062 (0.004) |
| IBD | Esophagus_Muscularis | All | 0.063 (0.004) |
| IBD | Heart_Atrial_Appendage | 1e.06 | 0.029 (0.004) |
| IBD | Heart_Atrial_Appendage | 1e.05 | 0.034 (0.004) |
| IBD | Heart_Atrial_Appendage | 1e.04 | 0.039 (0.004) |
| IBD | Heart_Atrial_Appendage | 0.001 | 0.042 (0.004) |
| IBD | Heart_Atrial_Appendage | 0.01 | 0.043 (0.004) |
| IBD | Heart_Atrial_Appendage | 0.05 | 0.047 (0.004) |
| IBD | Heart_Atrial_Appendage | 0.1 | 0.048 (0.004) |
| IBD | Heart_Atrial_Appendage | 0.5 | 0.05 (0.004) |
| IBD | Heart_Atrial_Appendage | 1 | 0.05 (0.004) |
| IBD | Heart_Atrial_Appendage | All | 0.053 (0.004) |
| IBD | Heart_Left_Ventricle | 1e.06 | 0.041 (0.004) |
| IBD | Heart_Left_Ventricle | 1e.05 | 0.04 (0.004) |
| IBD | Heart_Left_Ventricle | 1e.04 | 0.041 (0.004) |
| IBD | Heart_Left_Ventricle | 0.001 | 0.046 (0.004) |
| IBD | Heart_Left_Ventricle | 0.01 | 0.051 (0.004) |
| IBD | Heart_Left_Ventricle | 0.05 | 0.051 (0.004) |
| IBD | Heart_Left_Ventricle | 0.1 | 0.054 (0.004) |
| IBD | Heart_Left_Ventricle | 0.5 | 0.055 (0.004) |
| IBD | Heart_Left_Ventricle | 1 | 0.055 (0.004) |
| IBD | Heart_Left_Ventricle | All | 0.058 (0.004) |
| IBD | Liver | 1e.06 | 0.03 (0.004) |
| IBD | Liver | 1e.05 | 0.033 (0.004) |
| IBD | Liver | 1e.04 | 0.035 (0.004) |
| IBD | Liver | 0.001 | 0.041 (0.004) |
| IBD | Liver | 0.01 | 0.042 (0.004) |
| IBD | Liver | 0.05 | 0.043 (0.004) |
| IBD | Liver | 0.1 | 0.044 (0.004) |
| IBD | Liver | 0.5 | 0.044 (0.004) |
| IBD | Liver | 1 | 0.043 (0.004) |
| IBD | Liver | All | 0.047 (0.004) |
| IBD | Lung | 1e.06 | 0.04 (0.004) |
| IBD | Lung | 1e.05 | 0.047 (0.004) |
| IBD | Lung | 1e.04 | 0.047 (0.004) |
| IBD | Lung | 0.001 | 0.05 (0.004) |
| IBD | Lung | 0.01 | 0.053 (0.004) |
| IBD | Lung | 0.05 | 0.057 (0.004) |
| IBD | Lung | 0.1 | 0.059 (0.004) |
| IBD | Lung | 0.5 | 0.061 (0.004) |
| IBD | Lung | 1 | 0.061 (0.004) |
| IBD | Lung | All | 0.063 (0.004) |
| IBD | METSIM.ADIPOSE.RNASEQ | 1e.06 | 0.042 (0.004) |
| IBD | METSIM.ADIPOSE.RNASEQ | 1e.05 | 0.048 (0.004) |
| IBD | METSIM.ADIPOSE.RNASEQ | 1e.04 | 0.051 (0.004) |
| IBD | METSIM.ADIPOSE.RNASEQ | 0.001 | 0.051 (0.004) |
| IBD | METSIM.ADIPOSE.RNASEQ | 0.01 | 0.056 (0.004) |
| IBD | METSIM.ADIPOSE.RNASEQ | 0.05 | 0.057 (0.004) |
| IBD | METSIM.ADIPOSE.RNASEQ | 0.1 | 0.058 (0.004) |
| IBD | METSIM.ADIPOSE.RNASEQ | 0.5 | 0.058 (0.004) |
| IBD | METSIM.ADIPOSE.RNASEQ | 1 | 0.058 (0.004) |
| IBD | METSIM.ADIPOSE.RNASEQ | All | 0.062 (0.004) |
| IBD | Minor_Salivary_Gland | 1e.06 | 0.036 (0.004) |
| IBD | Minor_Salivary_Gland | 1e.05 | 0.038 (0.004) |
| IBD | Minor_Salivary_Gland | 1e.04 | 0.042 (0.004) |
| IBD | Minor_Salivary_Gland | 0.001 | 0.036 (0.004) |
| IBD | Minor_Salivary_Gland | 0.01 | 0.037 (0.004) |
| IBD | Minor_Salivary_Gland | 0.05 | 0.034 (0.004) |
| IBD | Minor_Salivary_Gland | 0.1 | 0.036 (0.004) |
| IBD | Minor_Salivary_Gland | 0.5 | 0.034 (0.004) |
| IBD | Minor_Salivary_Gland | 1 | 0.034 (0.004) |
| IBD | Minor_Salivary_Gland | All | 0.043 (0.004) |
| IBD | Muscle_Skeletal | 1e.06 | 0.047 (0.004) |
| IBD | Muscle_Skeletal | 1e.05 | 0.049 (0.004) |
| IBD | Muscle_Skeletal | 1e.04 | 0.05 (0.004) |
| IBD | Muscle_Skeletal | 0.001 | 0.051 (0.004) |
| IBD | Muscle_Skeletal | 0.01 | 0.057 (0.004) |
| IBD | Muscle_Skeletal | 0.05 | 0.063 (0.004) |
| IBD | Muscle_Skeletal | 0.1 | 0.064 (0.004) |
| IBD | Muscle_Skeletal | 0.5 | 0.062 (0.004) |
| IBD | Muscle_Skeletal | 1 | 0.061 (0.004) |
| IBD | Muscle_Skeletal | All | 0.066 (0.004) |
| IBD | Nerve_Tibial | 1e.06 | 0.042 (0.004) |
| IBD | Nerve_Tibial | 1e.05 | 0.046 (0.004) |
| IBD | Nerve_Tibial | 1e.04 | 0.048 (0.004) |
| IBD | Nerve_Tibial | 0.001 | 0.051 (0.004) |
| IBD | Nerve_Tibial | 0.01 | 0.058 (0.004) |
| IBD | Nerve_Tibial | 0.05 | 0.059 (0.004) |
| IBD | Nerve_Tibial | 0.1 | 0.064 (0.004) |
| IBD | Nerve_Tibial | 0.5 | 0.061 (0.004) |
| IBD | Nerve_Tibial | 1 | 0.06 (0.004) |
| IBD | Nerve_Tibial | All | 0.065 (0.004) |
| IBD | NTR.BLOOD.RNAARR | 1e.06 | 0.044 (0.004) |
| IBD | NTR.BLOOD.RNAARR | 1e.05 | 0.046 (0.004) |
| IBD | NTR.BLOOD.RNAARR | 1e.04 | 0.047 (0.004) |
| IBD | NTR.BLOOD.RNAARR | 0.001 | 0.045 (0.004) |
| IBD | NTR.BLOOD.RNAARR | 0.01 | 0.05 (0.004) |
| IBD | NTR.BLOOD.RNAARR | 0.05 | 0.049 (0.004) |
| IBD | NTR.BLOOD.RNAARR | 0.1 | 0.05 (0.004) |
| IBD | NTR.BLOOD.RNAARR | 0.5 | 0.051 (0.004) |
| IBD | NTR.BLOOD.RNAARR | 1 | 0.051 (0.004) |
| IBD | NTR.BLOOD.RNAARR | All | 0.055 (0.004) |
| IBD | Ovary | 1e.06 | 0.03 (0.004) |
| IBD | Ovary | 1e.05 | 0.031 (0.004) |
| IBD | Ovary | 1e.04 | 0.035 (0.004) |
| IBD | Ovary | 0.001 | 0.038 (0.004) |
| IBD | Ovary | 0.01 | 0.043 (0.004) |
| IBD | Ovary | 0.05 | 0.047 (0.004) |
| IBD | Ovary | 0.1 | 0.049 (0.004) |
| IBD | Ovary | 0.5 | 0.048 (0.004) |
| IBD | Ovary | 1 | 0.047 (0.004) |
| IBD | Ovary | All | 0.049 (0.004) |
| IBD | Pancreas | 1e.06 | 0.038 (0.004) |
| IBD | Pancreas | 1e.05 | 0.041 (0.004) |
| IBD | Pancreas | 1e.04 | 0.045 (0.004) |
| IBD | Pancreas | 0.001 | 0.046 (0.004) |
| IBD | Pancreas | 0.01 | 0.052 (0.004) |
| IBD | Pancreas | 0.05 | 0.051 (0.004) |
| IBD | Pancreas | 0.1 | 0.049 (0.004) |
| IBD | Pancreas | 0.5 | 0.051 (0.004) |
| IBD | Pancreas | 1 | 0.051 (0.004) |
| IBD | Pancreas | All | 0.055 (0.004) |
| IBD | Pituitary | 1e.06 | 0.03 (0.004) |
| IBD | Pituitary | 1e.05 | 0.033 (0.004) |
| IBD | Pituitary | 1e.04 | 0.034 (0.004) |
| IBD | Pituitary | 0.001 | 0.038 (0.004) |
| IBD | Pituitary | 0.01 | 0.042 (0.004) |
| IBD | Pituitary | 0.05 | 0.043 (0.004) |
| IBD | Pituitary | 0.1 | 0.043 (0.004) |
| IBD | Pituitary | 0.5 | 0.044 (0.004) |
| IBD | Pituitary | 1 | 0.043 (0.004) |
| IBD | Pituitary | All | 0.046 (0.004) |
| IBD | Prostate | 1e.06 | 0.031 (0.004) |
| IBD | Prostate | 1e.05 | 0.035 (0.004) |
| IBD | Prostate | 1e.04 | 0.036 (0.004) |
| IBD | Prostate | 0.001 | 0.036 (0.004) |
| IBD | Prostate | 0.01 | 0.042 (0.004) |
| IBD | Prostate | 0.05 | 0.042 (0.004) |
| IBD | Prostate | 0.1 | 0.043 (0.004) |
| IBD | Prostate | 0.5 | 0.044 (0.004) |
| IBD | Prostate | 1 | 0.045 (0.004) |
| IBD | Prostate | All | 0.047 (0.004) |
| IBD | Skin_Not_Sun_Exposed_Suprapubic | 1e.06 | 0.041 (0.004) |
| IBD | Skin_Not_Sun_Exposed_Suprapubic | 1e.05 | 0.044 (0.004) |
| IBD | Skin_Not_Sun_Exposed_Suprapubic | 1e.04 | 0.045 (0.004) |
| IBD | Skin_Not_Sun_Exposed_Suprapubic | 0.001 | 0.049 (0.004) |
| IBD | Skin_Not_Sun_Exposed_Suprapubic | 0.01 | 0.054 (0.004) |
| IBD | Skin_Not_Sun_Exposed_Suprapubic | 0.05 | 0.054 (0.004) |
| IBD | Skin_Not_Sun_Exposed_Suprapubic | 0.1 | 0.056 (0.004) |
| IBD | Skin_Not_Sun_Exposed_Suprapubic | 0.5 | 0.058 (0.004) |
| IBD | Skin_Not_Sun_Exposed_Suprapubic | 1 | 0.058 (0.004) |
| IBD | Skin_Not_Sun_Exposed_Suprapubic | All | 0.06 (0.004) |
| IBD | Skin_Sun_Exposed_Lower_leg | 1e.06 | 0.041 (0.004) |
| IBD | Skin_Sun_Exposed_Lower_leg | 1e.05 | 0.046 (0.004) |
| IBD | Skin_Sun_Exposed_Lower_leg | 1e.04 | 0.048 (0.004) |
| IBD | Skin_Sun_Exposed_Lower_leg | 0.001 | 0.055 (0.004) |
| IBD | Skin_Sun_Exposed_Lower_leg | 0.01 | 0.058 (0.004) |
| IBD | Skin_Sun_Exposed_Lower_leg | 0.05 | 0.062 (0.004) |
| IBD | Skin_Sun_Exposed_Lower_leg | 0.1 | 0.066 (0.004) |
| IBD | Skin_Sun_Exposed_Lower_leg | 0.5 | 0.067 (0.004) |
| IBD | Skin_Sun_Exposed_Lower_leg | 1 | 0.067 (0.004) |
| IBD | Skin_Sun_Exposed_Lower_leg | All | 0.068 (0.004) |
| IBD | Small_Intestine_Terminal_Ileum | 1e.06 | 0.043 (0.004) |
| IBD | Small_Intestine_Terminal_Ileum | 1e.05 | 0.042 (0.004) |
| IBD | Small_Intestine_Terminal_Ileum | 1e.04 | 0.044 (0.004) |
| IBD | Small_Intestine_Terminal_Ileum | 0.001 | 0.035 (0.004) |
| IBD | Small_Intestine_Terminal_Ileum | 0.01 | 0.037 (0.004) |
| IBD | Small_Intestine_Terminal_Ileum | 0.05 | 0.038 (0.004) |
| IBD | Small_Intestine_Terminal_Ileum | 0.1 | 0.041 (0.004) |
| IBD | Small_Intestine_Terminal_Ileum | 0.5 | 0.043 (0.004) |
| IBD | Small_Intestine_Terminal_Ileum | 1 | 0.042 (0.004) |
| IBD | Small_Intestine_Terminal_Ileum | All | 0.05 (0.004) |
| IBD | Spleen | 1e.06 | 0.04 (0.004) |
| IBD | Spleen | 1e.05 | 0.043 (0.004) |
| IBD | Spleen | 1e.04 | 0.045 (0.004) |
| IBD | Spleen | 0.001 | 0.047 (0.004) |
| IBD | Spleen | 0.01 | 0.049 (0.004) |
| IBD | Spleen | 0.05 | 0.049 (0.004) |
| IBD | Spleen | 0.1 | 0.05 (0.004) |
| IBD | Spleen | 0.5 | 0.051 (0.004) |
| IBD | Spleen | 1 | 0.052 (0.004) |
| IBD | Spleen | All | 0.055 (0.004) |
| IBD | Stomach | 1e.06 | 0.042 (0.004) |
| IBD | Stomach | 1e.05 | 0.04 (0.004) |
| IBD | Stomach | 1e.04 | 0.043 (0.004) |
| IBD | Stomach | 0.001 | 0.044 (0.004) |
| IBD | Stomach | 0.01 | 0.045 (0.004) |
| IBD | Stomach | 0.05 | 0.049 (0.004) |
| IBD | Stomach | 0.1 | 0.05 (0.004) |
| IBD | Stomach | 0.5 | 0.051 (0.004) |
| IBD | Stomach | 1 | 0.052 (0.004) |
| IBD | Stomach | All | 0.054 (0.004) |
| IBD | Testis | 1e.06 | 0.041 (0.004) |
| IBD | Testis | 1e.05 | 0.047 (0.004) |
| IBD | Testis | 1e.04 | 0.049 (0.004) |
| IBD | Testis | 0.001 | 0.047 (0.004) |
| IBD | Testis | 0.01 | 0.051 (0.004) |
| IBD | Testis | 0.05 | 0.059 (0.004) |
| IBD | Testis | 0.1 | 0.06 (0.004) |
| IBD | Testis | 0.5 | 0.061 (0.004) |
| IBD | Testis | 1 | 0.061 (0.004) |
| IBD | Testis | All | 0.065 (0.004) |
| IBD | Thyroid | 1e.06 | 0.044 (0.004) |
| IBD | Thyroid | 1e.05 | 0.047 (0.004) |
| IBD | Thyroid | 1e.04 | 0.048 (0.004) |
| IBD | Thyroid | 0.001 | 0.053 (0.004) |
| IBD | Thyroid | 0.01 | 0.056 (0.004) |
| IBD | Thyroid | 0.05 | 0.061 (0.004) |
| IBD | Thyroid | 0.1 | 0.062 (0.004) |
| IBD | Thyroid | 0.5 | 0.06 (0.004) |
| IBD | Thyroid | 1 | 0.059 (0.004) |
| IBD | Thyroid | All | 0.064 (0.004) |
| IBD | Uterus | 1e.06 | 0.026 (0.004) |
| IBD | Uterus | 1e.05 | 0.025 (0.004) |
| IBD | Uterus | 1e.04 | 0.026 (0.004) |
| IBD | Uterus | 0.001 | 0.021 (0.004) |
| IBD | Uterus | 0.01 | 0.028 (0.004) |
| IBD | Uterus | 0.05 | 0.028 (0.004) |
| IBD | Uterus | 0.1 | 0.033 (0.004) |
| IBD | Uterus | 0.5 | 0.031 (0.004) |
| IBD | Uterus | 1 | 0.031 (0.004) |
| IBD | Uterus | All | 0.04 (0.004) |
| IBD | Vagina | 1e.06 | 0.023 (0.004) |
| IBD | Vagina | 1e.05 | 0.026 (0.004) |
| IBD | Vagina | 1e.04 | 0.026 (0.004) |
| IBD | Vagina | 0.001 | 0.028 (0.004) |
| IBD | Vagina | 0.01 | 0.029 (0.004) |
| IBD | Vagina | 0.05 | 0.03 (0.004) |
| IBD | Vagina | 0.1 | 0.029 (0.004) |
| IBD | Vagina | 0.5 | 0.027 (0.004) |
| IBD | Vagina | 1 | 0.027 (0.004) |
| IBD | Vagina | All | 0.03 (0.004) |
| IBD | Whole_Blood | 1e.06 | 0.045 (0.004) |
| IBD | Whole_Blood | 1e.05 | 0.054 (0.004) |
| IBD | Whole_Blood | 1e.04 | 0.058 (0.004) |
| IBD | Whole_Blood | 0.001 | 0.055 (0.004) |
| IBD | Whole_Blood | 0.01 | 0.064 (0.004) |
| IBD | Whole_Blood | 0.05 | 0.067 (0.004) |
| IBD | Whole_Blood | 0.1 | 0.067 (0.004) |
| IBD | Whole_Blood | 0.5 | 0.065 (0.004) |
| IBD | Whole_Blood | 1 | 0.064 (0.004) |
| IBD | Whole_Blood | All | 0.07 (0.004) |
| IBD | YFS.BLOOD.RNAARR | 1e.06 | 0.045 (0.004) |
| IBD | YFS.BLOOD.RNAARR | 1e.05 | 0.044 (0.004) |
| IBD | YFS.BLOOD.RNAARR | 1e.04 | 0.049 (0.004) |
| IBD | YFS.BLOOD.RNAARR | 0.001 | 0.049 (0.004) |
| IBD | YFS.BLOOD.RNAARR | 0.01 | 0.053 (0.004) |
| IBD | YFS.BLOOD.RNAARR | 0.05 | 0.058 (0.004) |
| IBD | YFS.BLOOD.RNAARR | 0.1 | 0.057 (0.004) |
| IBD | YFS.BLOOD.RNAARR | 0.5 | 0.058 (0.004) |
| IBD | YFS.BLOOD.RNAARR | 1 | 0.059 (0.004) |
| IBD | YFS.BLOOD.RNAARR | All | 0.062 (0.004) |
| RheuArth | Adipose_Subcutaneous | 1e.06 | 0.042 (0.004) |
| RheuArth | Adipose_Subcutaneous | 1e.05 | 0.041 (0.004) |
| RheuArth | Adipose_Subcutaneous | 1e.04 | 0.047 (0.004) |
| RheuArth | Adipose_Subcutaneous | 0.001 | 0.052 (0.004) |
| RheuArth | Adipose_Subcutaneous | 0.01 | 0.061 (0.004) |
| RheuArth | Adipose_Subcutaneous | 0.05 | 0.063 (0.004) |
| RheuArth | Adipose_Subcutaneous | 0.1 | 0.067 (0.004) |
| RheuArth | Adipose_Subcutaneous | 0.5 | 0.064 (0.004) |
| RheuArth | Adipose_Subcutaneous | 1 | 0.065 (0.004) |
| RheuArth | Adipose_Subcutaneous | All | 0.07 (0.004) |
| RheuArth | Adipose_Visceral_Omentum | 1e.06 | 0.063 (0.004) |
| RheuArth | Adipose_Visceral_Omentum | 1e.05 | 0.061 (0.004) |
| RheuArth | Adipose_Visceral_Omentum | 1e.04 | 0.065 (0.004) |
| RheuArth | Adipose_Visceral_Omentum | 0.001 | 0.066 (0.004) |
| RheuArth | Adipose_Visceral_Omentum | 0.01 | 0.07 (0.004) |
| RheuArth | Adipose_Visceral_Omentum | 0.05 | 0.068 (0.004) |
| RheuArth | Adipose_Visceral_Omentum | 0.1 | 0.068 (0.004) |
| RheuArth | Adipose_Visceral_Omentum | 0.5 | 0.069 (0.004) |
| RheuArth | Adipose_Visceral_Omentum | 1 | 0.07 (0.004) |
| RheuArth | Adipose_Visceral_Omentum | All | 0.082 (0.004) |
| RheuArth | Adrenal_Gland | 1e.06 | 0.063 (0.004) |
| RheuArth | Adrenal_Gland | 1e.05 | 0.064 (0.004) |
| RheuArth | Adrenal_Gland | 1e.04 | 0.064 (0.004) |
| RheuArth | Adrenal_Gland | 0.001 | 0.069 (0.004) |
| RheuArth | Adrenal_Gland | 0.01 | 0.067 (0.004) |
| RheuArth | Adrenal_Gland | 0.05 | 0.068 (0.004) |
| RheuArth | Adrenal_Gland | 0.1 | 0.064 (0.004) |
| RheuArth | Adrenal_Gland | 0.5 | 0.06 (0.004) |
| RheuArth | Adrenal_Gland | 1 | 0.059 (0.004) |
| RheuArth | Adrenal_Gland | All | 0.075 (0.004) |
| RheuArth | Artery_Aorta | 1e.06 | 0.062 (0.004) |
| RheuArth | Artery_Aorta | 1e.05 | 0.065 (0.004) |
| RheuArth | Artery_Aorta | 1e.04 | 0.066 (0.004) |
| RheuArth | Artery_Aorta | 0.001 | 0.068 (0.004) |
| RheuArth | Artery_Aorta | 0.01 | 0.067 (0.004) |
| RheuArth | Artery_Aorta | 0.05 | 0.061 (0.004) |
| RheuArth | Artery_Aorta | 0.1 | 0.063 (0.004) |
| RheuArth | Artery_Aorta | 0.5 | 0.064 (0.004) |
| RheuArth | Artery_Aorta | 1 | 0.064 (0.004) |
| RheuArth | Artery_Aorta | All | 0.079 (0.004) |
| RheuArth | Artery_Coronary | 1e.06 | 0.07 (0.004) |
| RheuArth | Artery_Coronary | 1e.05 | 0.072 (0.004) |
| RheuArth | Artery_Coronary | 1e.04 | 0.071 (0.004) |
| RheuArth | Artery_Coronary | 0.001 | 0.072 (0.004) |
| RheuArth | Artery_Coronary | 0.01 | 0.064 (0.004) |
| RheuArth | Artery_Coronary | 0.05 | 0.057 (0.004) |
| RheuArth | Artery_Coronary | 0.1 | 0.055 (0.004) |
| RheuArth | Artery_Coronary | 0.5 | 0.057 (0.004) |
| RheuArth | Artery_Coronary | 1 | 0.057 (0.004) |
| RheuArth | Artery_Coronary | All | 0.079 (0.004) |
| RheuArth | Artery_Tibial | 1e.06 | 0.06 (0.004) |
| RheuArth | Artery_Tibial | 1e.05 | 0.061 (0.004) |
| RheuArth | Artery_Tibial | 1e.04 | 0.065 (0.004) |
| RheuArth | Artery_Tibial | 0.001 | 0.069 (0.004) |
| RheuArth | Artery_Tibial | 0.01 | 0.073 (0.004) |
| RheuArth | Artery_Tibial | 0.05 | 0.074 (0.004) |
| RheuArth | Artery_Tibial | 0.1 | 0.072 (0.004) |
| RheuArth | Artery_Tibial | 0.5 | 0.072 (0.004) |
| RheuArth | Artery_Tibial | 1 | 0.072 (0.004) |
| RheuArth | Artery_Tibial | All | 0.081 (0.004) |
| RheuArth | Brain_Amygdala | 1e.06 | 0.077 (0.004) |
| RheuArth | Brain_Amygdala | 1e.05 | 0.077 (0.004) |
| RheuArth | Brain_Amygdala | 1e.04 | 0.077 (0.004) |
| RheuArth | Brain_Amygdala | 0.001 | 0.073 (0.004) |
| RheuArth | Brain_Amygdala | 0.01 | 0.07 (0.004) |
| RheuArth | Brain_Amygdala | 0.05 | 0.068 (0.004) |
| RheuArth | Brain_Amygdala | 0.1 | 0.067 (0.004) |
| RheuArth | Brain_Amygdala | 0.5 | 0.065 (0.004) |
| RheuArth | Brain_Amygdala | 1 | 0.064 (0.004) |
| RheuArth | Brain_Amygdala | All | 0.083 (0.004) |
| RheuArth | Brain_Anterior_cingulate_cortex_BA24 | 1e.06 | 0.026 (0.004) |
| RheuArth | Brain_Anterior_cingulate_cortex_BA24 | 1e.05 | 0.029 (0.004) |
| RheuArth | Brain_Anterior_cingulate_cortex_BA24 | 1e.04 | 0.031 (0.004) |
| RheuArth | Brain_Anterior_cingulate_cortex_BA24 | 0.001 | 0.037 (0.004) |
| RheuArth | Brain_Anterior_cingulate_cortex_BA24 | 0.01 | 0.038 (0.004) |
| RheuArth | Brain_Anterior_cingulate_cortex_BA24 | 0.05 | 0.042 (0.004) |
| RheuArth | Brain_Anterior_cingulate_cortex_BA24 | 0.1 | 0.042 (0.004) |
| RheuArth | Brain_Anterior_cingulate_cortex_BA24 | 0.5 | 0.044 (0.004) |
| RheuArth | Brain_Anterior_cingulate_cortex_BA24 | 1 | 0.044 (0.004) |
| RheuArth | Brain_Anterior_cingulate_cortex_BA24 | All | 0.047 (0.004) |
| RheuArth | Brain_Caudate_basal_ganglia | 1e.06 | 0.066 (0.004) |
| RheuArth | Brain_Caudate_basal_ganglia | 1e.05 | 0.064 (0.004) |
| RheuArth | Brain_Caudate_basal_ganglia | 1e.04 | 0.064 (0.004) |
| RheuArth | Brain_Caudate_basal_ganglia | 0.001 | 0.063 (0.004) |
| RheuArth | Brain_Caudate_basal_ganglia | 0.01 | 0.064 (0.004) |
| RheuArth | Brain_Caudate_basal_ganglia | 0.05 | 0.064 (0.004) |
| RheuArth | Brain_Caudate_basal_ganglia | 0.1 | 0.064 (0.004) |
| RheuArth | Brain_Caudate_basal_ganglia | 0.5 | 0.062 (0.004) |
| RheuArth | Brain_Caudate_basal_ganglia | 1 | 0.06 (0.004) |
| RheuArth | Brain_Caudate_basal_ganglia | All | 0.077 (0.004) |
| RheuArth | Brain_Cerebellar_Hemisphere | 1e.06 | 0.051 (0.004) |
| RheuArth | Brain_Cerebellar_Hemisphere | 1e.05 | 0.051 (0.004) |
| RheuArth | Brain_Cerebellar_Hemisphere | 1e.04 | 0.052 (0.004) |
| RheuArth | Brain_Cerebellar_Hemisphere | 0.001 | 0.058 (0.004) |
| RheuArth | Brain_Cerebellar_Hemisphere | 0.01 | 0.063 (0.004) |
| RheuArth | Brain_Cerebellar_Hemisphere | 0.05 | 0.061 (0.004) |
| RheuArth | Brain_Cerebellar_Hemisphere | 0.1 | 0.062 (0.004) |
| RheuArth | Brain_Cerebellar_Hemisphere | 0.5 | 0.067 (0.004) |
| RheuArth | Brain_Cerebellar_Hemisphere | 1 | 0.065 (0.004) |
| RheuArth | Brain_Cerebellar_Hemisphere | All | 0.071 (0.004) |
| RheuArth | Brain_Cerebellum | 1e.06 | 0.035 (0.004) |
| RheuArth | Brain_Cerebellum | 1e.05 | 0.036 (0.004) |
| RheuArth | Brain_Cerebellum | 1e.04 | 0.04 (0.004) |
| RheuArth | Brain_Cerebellum | 0.001 | 0.046 (0.004) |
| RheuArth | Brain_Cerebellum | 0.01 | 0.056 (0.004) |
| RheuArth | Brain_Cerebellum | 0.05 | 0.06 (0.004) |
| RheuArth | Brain_Cerebellum | 0.1 | 0.058 (0.004) |
| RheuArth | Brain_Cerebellum | 0.5 | 0.063 (0.004) |
| RheuArth | Brain_Cerebellum | 1 | 0.062 (0.004) |
| RheuArth | Brain_Cerebellum | All | 0.066 (0.004) |
| RheuArth | Brain_Cortex | 1e.06 | 0.084 (0.004) |
| RheuArth | Brain_Cortex | 1e.05 | 0.085 (0.004) |
| RheuArth | Brain_Cortex | 1e.04 | 0.082 (0.004) |
| RheuArth | Brain_Cortex | 0.001 | 0.08 (0.004) |
| RheuArth | Brain_Cortex | 0.01 | 0.078 (0.004) |
| RheuArth | Brain_Cortex | 0.05 | 0.074 (0.004) |
| RheuArth | Brain_Cortex | 0.1 | 0.075 (0.004) |
| RheuArth | Brain_Cortex | 0.5 | 0.072 (0.004) |
| RheuArth | Brain_Cortex | 1 | 0.072 (0.004) |
| RheuArth | Brain_Cortex | All | 0.097 (0.004) |
| RheuArth | Brain_Frontal_Cortex_BA9 | 1e.06 | 0.039 (0.004) |
| RheuArth | Brain_Frontal_Cortex_BA9 | 1e.05 | 0.041 (0.004) |
| RheuArth | Brain_Frontal_Cortex_BA9 | 1e.04 | 0.043 (0.004) |
| RheuArth | Brain_Frontal_Cortex_BA9 | 0.001 | 0.047 (0.004) |
| RheuArth | Brain_Frontal_Cortex_BA9 | 0.01 | 0.051 (0.004) |
| RheuArth | Brain_Frontal_Cortex_BA9 | 0.05 | 0.053 (0.004) |
| RheuArth | Brain_Frontal_Cortex_BA9 | 0.1 | 0.052 (0.004) |
| RheuArth | Brain_Frontal_Cortex_BA9 | 0.5 | 0.052 (0.004) |
| RheuArth | Brain_Frontal_Cortex_BA9 | 1 | 0.053 (0.004) |
| RheuArth | Brain_Frontal_Cortex_BA9 | All | 0.058 (0.004) |
| RheuArth | Brain_Hippocampus | 1e.06 | 0.031 (0.004) |
| RheuArth | Brain_Hippocampus | 1e.05 | 0.031 (0.004) |
| RheuArth | Brain_Hippocampus | 1e.04 | 0.033 (0.004) |
| RheuArth | Brain_Hippocampus | 0.001 | 0.04 (0.004) |
| RheuArth | Brain_Hippocampus | 0.01 | 0.043 (0.004) |
| RheuArth | Brain_Hippocampus | 0.05 | 0.046 (0.004) |
| RheuArth | Brain_Hippocampus | 0.1 | 0.05 (0.004) |
| RheuArth | Brain_Hippocampus | 0.5 | 0.049 (0.004) |
| RheuArth | Brain_Hippocampus | 1 | 0.048 (0.004) |
| RheuArth | Brain_Hippocampus | All | 0.053 (0.004) |
| RheuArth | Brain_Hypothalamus | 1e.06 | 0.053 (0.004) |
| RheuArth | Brain_Hypothalamus | 1e.05 | 0.052 (0.004) |
| RheuArth | Brain_Hypothalamus | 1e.04 | 0.053 (0.004) |
| RheuArth | Brain_Hypothalamus | 0.001 | 0.053 (0.004) |
| RheuArth | Brain_Hypothalamus | 0.01 | 0.054 (0.004) |
| RheuArth | Brain_Hypothalamus | 0.05 | 0.051 (0.004) |
| RheuArth | Brain_Hypothalamus | 0.1 | 0.052 (0.004) |
| RheuArth | Brain_Hypothalamus | 0.5 | 0.048 (0.004) |
| RheuArth | Brain_Hypothalamus | 1 | 0.047 (0.004) |
| RheuArth | Brain_Hypothalamus | All | 0.06 (0.004) |
| RheuArth | Brain_Nucleus_accumbens_basal_ganglia | 1e.06 | 0.077 (0.004) |
| RheuArth | Brain_Nucleus_accumbens_basal_ganglia | 1e.05 | 0.075 (0.004) |
| RheuArth | Brain_Nucleus_accumbens_basal_ganglia | 1e.04 | 0.074 (0.004) |
| RheuArth | Brain_Nucleus_accumbens_basal_ganglia | 0.001 | 0.074 (0.004) |
| RheuArth | Brain_Nucleus_accumbens_basal_ganglia | 0.01 | 0.072 (0.004) |
| RheuArth | Brain_Nucleus_accumbens_basal_ganglia | 0.05 | 0.065 (0.004) |
| RheuArth | Brain_Nucleus_accumbens_basal_ganglia | 0.1 | 0.065 (0.004) |
| RheuArth | Brain_Nucleus_accumbens_basal_ganglia | 0.5 | 0.063 (0.004) |
| RheuArth | Brain_Nucleus_accumbens_basal_ganglia | 1 | 0.063 (0.004) |
| RheuArth | Brain_Nucleus_accumbens_basal_ganglia | All | 0.085 (0.004) |
| RheuArth | Brain_Putamen_basal_ganglia | 1e.06 | 0.034 (0.004) |
| RheuArth | Brain_Putamen_basal_ganglia | 1e.05 | 0.033 (0.004) |
| RheuArth | Brain_Putamen_basal_ganglia | 1e.04 | 0.035 (0.004) |
| RheuArth | Brain_Putamen_basal_ganglia | 0.001 | 0.041 (0.004) |
| RheuArth | Brain_Putamen_basal_ganglia | 0.01 | 0.046 (0.004) |
| RheuArth | Brain_Putamen_basal_ganglia | 0.05 | 0.049 (0.004) |
| RheuArth | Brain_Putamen_basal_ganglia | 0.1 | 0.05 (0.004) |
| RheuArth | Brain_Putamen_basal_ganglia | 0.5 | 0.051 (0.004) |
| RheuArth | Brain_Putamen_basal_ganglia | 1 | 0.05 (0.004) |
| RheuArth | Brain_Putamen_basal_ganglia | All | 0.052 (0.004) |
| RheuArth | Brain_Spinal_cord_cervical_c-1 | 1e.06 | 0.029 (0.004) |
| RheuArth | Brain_Spinal_cord_cervical_c-1 | 1e.05 | 0.029 (0.004) |
| RheuArth | Brain_Spinal_cord_cervical_c-1 | 1e.04 | 0.029 (0.004) |
| RheuArth | Brain_Spinal_cord_cervical_c-1 | 0.001 | 0.033 (0.004) |
| RheuArth | Brain_Spinal_cord_cervical_c-1 | 0.01 | 0.037 (0.004) |
| RheuArth | Brain_Spinal_cord_cervical_c-1 | 0.05 | 0.043 (0.004) |
| RheuArth | Brain_Spinal_cord_cervical_c-1 | 0.1 | 0.041 (0.004) |
| RheuArth | Brain_Spinal_cord_cervical_c-1 | 0.5 | 0.039 (0.004) |
| RheuArth | Brain_Spinal_cord_cervical_c-1 | 1 | 0.038 (0.004) |
| RheuArth | Brain_Spinal_cord_cervical_c-1 | All | 0.042 (0.004) |
| RheuArth | Brain_Substantia_nigra | 1e.06 | 0.076 (0.004) |
| RheuArth | Brain_Substantia_nigra | 1e.05 | 0.076 (0.004) |
| RheuArth | Brain_Substantia_nigra | 1e.04 | 0.074 (0.004) |
| RheuArth | Brain_Substantia_nigra | 0.001 | 0.074 (0.004) |
| RheuArth | Brain_Substantia_nigra | 0.01 | 0.074 (0.004) |
| RheuArth | Brain_Substantia_nigra | 0.05 | 0.075 (0.004) |
| RheuArth | Brain_Substantia_nigra | 0.1 | 0.073 (0.004) |
| RheuArth | Brain_Substantia_nigra | 0.5 | 0.068 (0.004) |
| RheuArth | Brain_Substantia_nigra | 1 | 0.068 (0.004) |
| RheuArth | Brain_Substantia_nigra | All | 0.084 (0.004) |
| RheuArth | Breast_Mammary_Tissue | 1e.06 | 0.058 (0.004) |
| RheuArth | Breast_Mammary_Tissue | 1e.05 | 0.06 (0.004) |
| RheuArth | Breast_Mammary_Tissue | 1e.04 | 0.064 (0.004) |
| RheuArth | Breast_Mammary_Tissue | 0.001 | 0.068 (0.004) |
| RheuArth | Breast_Mammary_Tissue | 0.01 | 0.07 (0.004) |
| RheuArth | Breast_Mammary_Tissue | 0.05 | 0.067 (0.004) |
| RheuArth | Breast_Mammary_Tissue | 0.1 | 0.064 (0.004) |
| RheuArth | Breast_Mammary_Tissue | 0.5 | 0.065 (0.004) |
| RheuArth | Breast_Mammary_Tissue | 1 | 0.065 (0.004) |
| RheuArth | Breast_Mammary_Tissue | All | 0.078 (0.004) |
| RheuArth | Cells_EBV-transformed_lymphocytes | 1e.06 | 0.059 (0.004) |
| RheuArth | Cells_EBV-transformed_lymphocytes | 1e.05 | 0.059 (0.004) |
| RheuArth | Cells_EBV-transformed_lymphocytes | 1e.04 | 0.063 (0.004) |
| RheuArth | Cells_EBV-transformed_lymphocytes | 0.001 | 0.065 (0.004) |
| RheuArth | Cells_EBV-transformed_lymphocytes | 0.01 | 0.066 (0.004) |
| RheuArth | Cells_EBV-transformed_lymphocytes | 0.05 | 0.064 (0.004) |
| RheuArth | Cells_EBV-transformed_lymphocytes | 0.1 | 0.064 (0.004) |
| RheuArth | Cells_EBV-transformed_lymphocytes | 0.5 | 0.06 (0.004) |
| RheuArth | Cells_EBV-transformed_lymphocytes | 1 | 0.059 (0.004) |
| RheuArth | Cells_EBV-transformed_lymphocytes | All | 0.071 (0.004) |
| RheuArth | Cells_Transformed_fibroblasts | 1e.06 | 0.071 (0.004) |
| RheuArth | Cells_Transformed_fibroblasts | 1e.05 | 0.072 (0.004) |
| RheuArth | Cells_Transformed_fibroblasts | 1e.04 | 0.073 (0.004) |
| RheuArth | Cells_Transformed_fibroblasts | 0.001 | 0.076 (0.004) |
| RheuArth | Cells_Transformed_fibroblasts | 0.01 | 0.076 (0.004) |
| RheuArth | Cells_Transformed_fibroblasts | 0.05 | 0.074 (0.004) |
| RheuArth | Cells_Transformed_fibroblasts | 0.1 | 0.072 (0.004) |
| RheuArth | Cells_Transformed_fibroblasts | 0.5 | 0.07 (0.004) |
| RheuArth | Cells_Transformed_fibroblasts | 1 | 0.069 (0.004) |
| RheuArth | Cells_Transformed_fibroblasts | All | 0.086 (0.004) |
| RheuArth | CMC.BRAIN.RNASEQ | 1e.06 | 0.043 (0.004) |
| RheuArth | CMC.BRAIN.RNASEQ | 1e.05 | 0.046 (0.004) |
| RheuArth | CMC.BRAIN.RNASEQ | 1e.04 | 0.05 (0.004) |
| RheuArth | CMC.BRAIN.RNASEQ | 0.001 | 0.054 (0.004) |
| RheuArth | CMC.BRAIN.RNASEQ | 0.01 | 0.059 (0.004) |
| RheuArth | CMC.BRAIN.RNASEQ | 0.05 | 0.064 (0.004) |
| RheuArth | CMC.BRAIN.RNASEQ | 0.1 | 0.065 (0.004) |
| RheuArth | CMC.BRAIN.RNASEQ | 0.5 | 0.069 (0.004) |
| RheuArth | CMC.BRAIN.RNASEQ | 1 | 0.069 (0.004) |
| RheuArth | CMC.BRAIN.RNASEQ | All | 0.073 (0.004) |
| RheuArth | CMC.BRAIN.RNASEQ_SPLICING | 1e.06 | 0.037 (0.004) |
| RheuArth | CMC.BRAIN.RNASEQ_SPLICING | 1e.05 | 0.037 (0.004) |
| RheuArth | CMC.BRAIN.RNASEQ_SPLICING | 1e.04 | 0.04 (0.004) |
| RheuArth | CMC.BRAIN.RNASEQ_SPLICING | 0.001 | 0.043 (0.004) |
| RheuArth | CMC.BRAIN.RNASEQ_SPLICING | 0.01 | 0.043 (0.004) |
| RheuArth | CMC.BRAIN.RNASEQ_SPLICING | 0.05 | 0.044 (0.004) |
| RheuArth | CMC.BRAIN.RNASEQ_SPLICING | 0.1 | 0.047 (0.004) |
| RheuArth | CMC.BRAIN.RNASEQ_SPLICING | 0.5 | 0.047 (0.004) |
| RheuArth | CMC.BRAIN.RNASEQ_SPLICING | 1 | 0.046 (0.004) |
| RheuArth | CMC.BRAIN.RNASEQ_SPLICING | All | 0.056 (0.004) |
| RheuArth | Colon_Sigmoid | 1e.06 | 0.064 (0.004) |
| RheuArth | Colon_Sigmoid | 1e.05 | 0.065 (0.004) |
| RheuArth | Colon_Sigmoid | 1e.04 | 0.069 (0.004) |
| RheuArth | Colon_Sigmoid | 0.001 | 0.07 (0.004) |
| RheuArth | Colon_Sigmoid | 0.01 | 0.071 (0.004) |
| RheuArth | Colon_Sigmoid | 0.05 | 0.069 (0.004) |
| RheuArth | Colon_Sigmoid | 0.1 | 0.066 (0.004) |
| RheuArth | Colon_Sigmoid | 0.5 | 0.066 (0.004) |
| RheuArth | Colon_Sigmoid | 1 | 0.066 (0.004) |
| RheuArth | Colon_Sigmoid | All | 0.081 (0.004) |
| RheuArth | Colon_Transverse | 1e.06 | 0.057 (0.004) |
| RheuArth | Colon_Transverse | 1e.05 | 0.059 (0.004) |
| RheuArth | Colon_Transverse | 1e.04 | 0.059 (0.004) |
| RheuArth | Colon_Transverse | 0.001 | 0.062 (0.004) |
| RheuArth | Colon_Transverse | 0.01 | 0.063 (0.004) |
| RheuArth | Colon_Transverse | 0.05 | 0.065 (0.004) |
| RheuArth | Colon_Transverse | 0.1 | 0.063 (0.004) |
| RheuArth | Colon_Transverse | 0.5 | 0.064 (0.004) |
| RheuArth | Colon_Transverse | 1 | 0.063 (0.004) |
| RheuArth | Colon_Transverse | All | 0.074 (0.004) |
| RheuArth | Esophagus_Gastroesophageal_Junction | 1e.06 | 0.057 (0.004) |
| RheuArth | Esophagus_Gastroesophageal_Junction | 1e.05 | 0.057 (0.004) |
| RheuArth | Esophagus_Gastroesophageal_Junction | 1e.04 | 0.059 (0.004) |
| RheuArth | Esophagus_Gastroesophageal_Junction | 0.001 | 0.063 (0.004) |
| RheuArth | Esophagus_Gastroesophageal_Junction | 0.01 | 0.059 (0.004) |
| RheuArth | Esophagus_Gastroesophageal_Junction | 0.05 | 0.059 (0.004) |
| RheuArth | Esophagus_Gastroesophageal_Junction | 0.1 | 0.06 (0.004) |
| RheuArth | Esophagus_Gastroesophageal_Junction | 0.5 | 0.058 (0.004) |
| RheuArth | Esophagus_Gastroesophageal_Junction | 1 | 0.059 (0.004) |
| RheuArth | Esophagus_Gastroesophageal_Junction | All | 0.071 (0.004) |
| RheuArth | Esophagus_Mucosa | 1e.06 | 0.064 (0.004) |
| RheuArth | Esophagus_Mucosa | 1e.05 | 0.062 (0.004) |
| RheuArth | Esophagus_Mucosa | 1e.04 | 0.063 (0.004) |
| RheuArth | Esophagus_Mucosa | 0.001 | 0.068 (0.004) |
| RheuArth | Esophagus_Mucosa | 0.01 | 0.069 (0.004) |
| RheuArth | Esophagus_Mucosa | 0.05 | 0.069 (0.004) |
| RheuArth | Esophagus_Mucosa | 0.1 | 0.07 (0.004) |
| RheuArth | Esophagus_Mucosa | 0.5 | 0.07 (0.004) |
| RheuArth | Esophagus_Mucosa | 1 | 0.07 (0.004) |
| RheuArth | Esophagus_Mucosa | All | 0.081 (0.004) |
| RheuArth | Esophagus_Muscularis | 1e.06 | 0.07 (0.004) |
| RheuArth | Esophagus_Muscularis | 1e.05 | 0.072 (0.004) |
| RheuArth | Esophagus_Muscularis | 1e.04 | 0.077 (0.004) |
| RheuArth | Esophagus_Muscularis | 0.001 | 0.078 (0.004) |
| RheuArth | Esophagus_Muscularis | 0.01 | 0.075 (0.004) |
| RheuArth | Esophagus_Muscularis | 0.05 | 0.072 (0.004) |
| RheuArth | Esophagus_Muscularis | 0.1 | 0.071 (0.004) |
| RheuArth | Esophagus_Muscularis | 0.5 | 0.07 (0.004) |
| RheuArth | Esophagus_Muscularis | 1 | 0.069 (0.004) |
| RheuArth | Esophagus_Muscularis | All | 0.089 (0.004) |
| RheuArth | Heart_Atrial_Appendage | 1e.06 | 0.076 (0.004) |
| RheuArth | Heart_Atrial_Appendage | 1e.05 | 0.076 (0.004) |
| RheuArth | Heart_Atrial_Appendage | 1e.04 | 0.074 (0.004) |
| RheuArth | Heart_Atrial_Appendage | 0.001 | 0.073 (0.004) |
| RheuArth | Heart_Atrial_Appendage | 0.01 | 0.07 (0.004) |
| RheuArth | Heart_Atrial_Appendage | 0.05 | 0.073 (0.004) |
| RheuArth | Heart_Atrial_Appendage | 0.1 | 0.073 (0.004) |
| RheuArth | Heart_Atrial_Appendage | 0.5 | 0.069 (0.004) |
| RheuArth | Heart_Atrial_Appendage | 1 | 0.07 (0.004) |
| RheuArth | Heart_Atrial_Appendage | All | 0.089 (0.004) |
| RheuArth | Heart_Left_Ventricle | 1e.06 | 0.075 (0.004) |
| RheuArth | Heart_Left_Ventricle | 1e.05 | 0.076 (0.004) |
| RheuArth | Heart_Left_Ventricle | 1e.04 | 0.079 (0.004) |
| RheuArth | Heart_Left_Ventricle | 0.001 | 0.079 (0.004) |
| RheuArth | Heart_Left_Ventricle | 0.01 | 0.078 (0.004) |
| RheuArth | Heart_Left_Ventricle | 0.05 | 0.075 (0.004) |
| RheuArth | Heart_Left_Ventricle | 0.1 | 0.072 (0.004) |
| RheuArth | Heart_Left_Ventricle | 0.5 | 0.07 (0.004) |
| RheuArth | Heart_Left_Ventricle | 1 | 0.071 (0.004) |
| RheuArth | Heart_Left_Ventricle | All | 0.089 (0.004) |
| RheuArth | Liver | 1e.06 | 0.071 (0.004) |
| RheuArth | Liver | 1e.05 | 0.073 (0.004) |
| RheuArth | Liver | 1e.04 | 0.07 (0.004) |
| RheuArth | Liver | 0.001 | 0.072 (0.004) |
| RheuArth | Liver | 0.01 | 0.072 (0.004) |
| RheuArth | Liver | 0.05 | 0.073 (0.004) |
| RheuArth | Liver | 0.1 | 0.071 (0.004) |
| RheuArth | Liver | 0.5 | 0.066 (0.004) |
| RheuArth | Liver | 1 | 0.066 (0.004) |
| RheuArth | Liver | All | 0.081 (0.004) |
| RheuArth | Lung | 1e.06 | 0.074 (0.004) |
| RheuArth | Lung | 1e.05 | 0.073 (0.004) |
| RheuArth | Lung | 1e.04 | 0.073 (0.004) |
| RheuArth | Lung | 0.001 | 0.076 (0.004) |
| RheuArth | Lung | 0.01 | 0.072 (0.004) |
| RheuArth | Lung | 0.05 | 0.067 (0.004) |
| RheuArth | Lung | 0.1 | 0.066 (0.004) |
| RheuArth | Lung | 0.5 | 0.069 (0.004) |
| RheuArth | Lung | 1 | 0.069 (0.004) |
| RheuArth | Lung | All | 0.089 (0.004) |
| RheuArth | METSIM.ADIPOSE.RNASEQ | 1e.06 | 0.083 (0.004) |
| RheuArth | METSIM.ADIPOSE.RNASEQ | 1e.05 | 0.081 (0.004) |
| RheuArth | METSIM.ADIPOSE.RNASEQ | 1e.04 | 0.081 (0.004) |
| RheuArth | METSIM.ADIPOSE.RNASEQ | 0.001 | 0.083 (0.004) |
| RheuArth | METSIM.ADIPOSE.RNASEQ | 0.01 | 0.083 (0.004) |
| RheuArth | METSIM.ADIPOSE.RNASEQ | 0.05 | 0.08 (0.004) |
| RheuArth | METSIM.ADIPOSE.RNASEQ | 0.1 | 0.081 (0.004) |
| RheuArth | METSIM.ADIPOSE.RNASEQ | 0.5 | 0.08 (0.004) |
| RheuArth | METSIM.ADIPOSE.RNASEQ | 1 | 0.079 (0.004) |
| RheuArth | METSIM.ADIPOSE.RNASEQ | All | 0.095 (0.004) |
| RheuArth | Minor_Salivary_Gland | 1e.06 | 0.069 (0.004) |
| RheuArth | Minor_Salivary_Gland | 1e.05 | 0.07 (0.004) |
| RheuArth | Minor_Salivary_Gland | 1e.04 | 0.071 (0.004) |
| RheuArth | Minor_Salivary_Gland | 0.001 | 0.071 (0.004) |
| RheuArth | Minor_Salivary_Gland | 0.01 | 0.069 (0.004) |
| RheuArth | Minor_Salivary_Gland | 0.05 | 0.066 (0.004) |
| RheuArth | Minor_Salivary_Gland | 0.1 | 0.063 (0.004) |
| RheuArth | Minor_Salivary_Gland | 0.5 | 0.06 (0.004) |
| RheuArth | Minor_Salivary_Gland | 1 | 0.059 (0.004) |
| RheuArth | Minor_Salivary_Gland | All | 0.076 (0.004) |
| RheuArth | Muscle_Skeletal | 1e.06 | 0.063 (0.004) |
| RheuArth | Muscle_Skeletal | 1e.05 | 0.065 (0.004) |
| RheuArth | Muscle_Skeletal | 1e.04 | 0.063 (0.004) |
| RheuArth | Muscle_Skeletal | 0.001 | 0.068 (0.004) |
| RheuArth | Muscle_Skeletal | 0.01 | 0.07 (0.004) |
| RheuArth | Muscle_Skeletal | 0.05 | 0.071 (0.004) |
| RheuArth | Muscle_Skeletal | 0.1 | 0.07 (0.004) |
| RheuArth | Muscle_Skeletal | 0.5 | 0.072 (0.004) |
| RheuArth | Muscle_Skeletal | 1 | 0.072 (0.004) |
| RheuArth | Muscle_Skeletal | All | 0.082 (0.004) |
| RheuArth | Nerve_Tibial | 1e.06 | 0.062 (0.004) |
| RheuArth | Nerve_Tibial | 1e.05 | 0.063 (0.004) |
| RheuArth | Nerve_Tibial | 1e.04 | 0.065 (0.004) |
| RheuArth | Nerve_Tibial | 0.001 | 0.069 (0.004) |
| RheuArth | Nerve_Tibial | 0.01 | 0.068 (0.004) |
| RheuArth | Nerve_Tibial | 0.05 | 0.071 (0.004) |
| RheuArth | Nerve_Tibial | 0.1 | 0.069 (0.004) |
| RheuArth | Nerve_Tibial | 0.5 | 0.067 (0.004) |
| RheuArth | Nerve_Tibial | 1 | 0.067 (0.004) |
| RheuArth | Nerve_Tibial | All | 0.083 (0.004) |
| RheuArth | NTR.BLOOD.RNAARR | 1e.06 | 0.042 (0.004) |
| RheuArth | NTR.BLOOD.RNAARR | 1e.05 | 0.049 (0.004) |
| RheuArth | NTR.BLOOD.RNAARR | 1e.04 | 0.055 (0.004) |
| RheuArth | NTR.BLOOD.RNAARR | 0.001 | 0.058 (0.004) |
| RheuArth | NTR.BLOOD.RNAARR | 0.01 | 0.061 (0.004) |
| RheuArth | NTR.BLOOD.RNAARR | 0.05 | 0.063 (0.004) |
| RheuArth | NTR.BLOOD.RNAARR | 0.1 | 0.064 (0.004) |
| RheuArth | NTR.BLOOD.RNAARR | 0.5 | 0.069 (0.004) |
| RheuArth | NTR.BLOOD.RNAARR | 1 | 0.07 (0.004) |
| RheuArth | NTR.BLOOD.RNAARR | All | 0.073 (0.004) |
| RheuArth | Ovary | 1e.06 | 0.066 (0.004) |
| RheuArth | Ovary | 1e.05 | 0.066 (0.004) |
| RheuArth | Ovary | 1e.04 | 0.067 (0.004) |
| RheuArth | Ovary | 0.001 | 0.069 (0.004) |
| RheuArth | Ovary | 0.01 | 0.068 (0.004) |
| RheuArth | Ovary | 0.05 | 0.068 (0.004) |
| RheuArth | Ovary | 0.1 | 0.064 (0.004) |
| RheuArth | Ovary | 0.5 | 0.062 (0.004) |
| RheuArth | Ovary | 1 | 0.061 (0.004) |
| RheuArth | Ovary | All | 0.077 (0.004) |
| RheuArth | Pancreas | 1e.06 | 0.061 (0.004) |
| RheuArth | Pancreas | 1e.05 | 0.059 (0.004) |
| RheuArth | Pancreas | 1e.04 | 0.064 (0.004) |
| RheuArth | Pancreas | 0.001 | 0.066 (0.004) |
| RheuArth | Pancreas | 0.01 | 0.068 (0.004) |
| RheuArth | Pancreas | 0.05 | 0.072 (0.004) |
| RheuArth | Pancreas | 0.1 | 0.07 (0.004) |
| RheuArth | Pancreas | 0.5 | 0.069 (0.004) |
| RheuArth | Pancreas | 1 | 0.07 (0.004) |
| RheuArth | Pancreas | All | 0.078 (0.004) |
| RheuArth | Pituitary | 1e.06 | 0.061 (0.004) |
| RheuArth | Pituitary | 1e.05 | 0.063 (0.004) |
| RheuArth | Pituitary | 1e.04 | 0.061 (0.004) |
| RheuArth | Pituitary | 0.001 | 0.065 (0.004) |
| RheuArth | Pituitary | 0.01 | 0.065 (0.004) |
| RheuArth | Pituitary | 0.05 | 0.064 (0.004) |
| RheuArth | Pituitary | 0.1 | 0.066 (0.004) |
| RheuArth | Pituitary | 0.5 | 0.065 (0.004) |
| RheuArth | Pituitary | 1 | 0.064 (0.004) |
| RheuArth | Pituitary | All | 0.077 (0.004) |
| RheuArth | Prostate | 1e.06 | 0.03 (0.004) |
| RheuArth | Prostate | 1e.05 | 0.032 (0.004) |
| RheuArth | Prostate | 1e.04 | 0.034 (0.004) |
| RheuArth | Prostate | 0.001 | 0.04 (0.004) |
| RheuArth | Prostate | 0.01 | 0.042 (0.004) |
| RheuArth | Prostate | 0.05 | 0.043 (0.004) |
| RheuArth | Prostate | 0.1 | 0.044 (0.004) |
| RheuArth | Prostate | 0.5 | 0.049 (0.004) |
| RheuArth | Prostate | 1 | 0.047 (0.004) |
| RheuArth | Prostate | All | 0.05 (0.004) |
| RheuArth | Skin_Not_Sun_Exposed_Suprapubic | 1e.06 | 0.04 (0.004) |
| RheuArth | Skin_Not_Sun_Exposed_Suprapubic | 1e.05 | 0.041 (0.004) |
| RheuArth | Skin_Not_Sun_Exposed_Suprapubic | 1e.04 | 0.044 (0.004) |
| RheuArth | Skin_Not_Sun_Exposed_Suprapubic | 0.001 | 0.049 (0.004) |
| RheuArth | Skin_Not_Sun_Exposed_Suprapubic | 0.01 | 0.055 (0.004) |
| RheuArth | Skin_Not_Sun_Exposed_Suprapubic | 0.05 | 0.055 (0.004) |
| RheuArth | Skin_Not_Sun_Exposed_Suprapubic | 0.1 | 0.055 (0.004) |
| RheuArth | Skin_Not_Sun_Exposed_Suprapubic | 0.5 | 0.056 (0.004) |
| RheuArth | Skin_Not_Sun_Exposed_Suprapubic | 1 | 0.056 (0.004) |
| RheuArth | Skin_Not_Sun_Exposed_Suprapubic | All | 0.062 (0.004) |
| RheuArth | Skin_Sun_Exposed_Lower_leg | 1e.06 | 0.048 (0.004) |
| RheuArth | Skin_Sun_Exposed_Lower_leg | 1e.05 | 0.049 (0.004) |
| RheuArth | Skin_Sun_Exposed_Lower_leg | 1e.04 | 0.05 (0.004) |
| RheuArth | Skin_Sun_Exposed_Lower_leg | 0.001 | 0.054 (0.004) |
| RheuArth | Skin_Sun_Exposed_Lower_leg | 0.01 | 0.059 (0.004) |
| RheuArth | Skin_Sun_Exposed_Lower_leg | 0.05 | 0.06 (0.004) |
| RheuArth | Skin_Sun_Exposed_Lower_leg | 0.1 | 0.058 (0.004) |
| RheuArth | Skin_Sun_Exposed_Lower_leg | 0.5 | 0.059 (0.004) |
| RheuArth | Skin_Sun_Exposed_Lower_leg | 1 | 0.058 (0.004) |
| RheuArth | Skin_Sun_Exposed_Lower_leg | All | 0.067 (0.004) |
| RheuArth | Small_Intestine_Terminal_Ileum | 1e.06 | 0.067 (0.004) |
| RheuArth | Small_Intestine_Terminal_Ileum | 1e.05 | 0.066 (0.004) |
| RheuArth | Small_Intestine_Terminal_Ileum | 1e.04 | 0.066 (0.004) |
| RheuArth | Small_Intestine_Terminal_Ileum | 0.001 | 0.069 (0.004) |
| RheuArth | Small_Intestine_Terminal_Ileum | 0.01 | 0.066 (0.004) |
| RheuArth | Small_Intestine_Terminal_Ileum | 0.05 | 0.063 (0.004) |
| RheuArth | Small_Intestine_Terminal_Ileum | 0.1 | 0.061 (0.004) |
| RheuArth | Small_Intestine_Terminal_Ileum | 0.5 | 0.059 (0.004) |
| RheuArth | Small_Intestine_Terminal_Ileum | 1 | 0.058 (0.004) |
| RheuArth | Small_Intestine_Terminal_Ileum | All | 0.074 (0.004) |
| RheuArth | Spleen | 1e.06 | 0.068 (0.004) |
| RheuArth | Spleen | 1e.05 | 0.07 (0.004) |
| RheuArth | Spleen | 1e.04 | 0.071 (0.004) |
| RheuArth | Spleen | 0.001 | 0.073 (0.004) |
| RheuArth | Spleen | 0.01 | 0.071 (0.004) |
| RheuArth | Spleen | 0.05 | 0.074 (0.004) |
| RheuArth | Spleen | 0.1 | 0.074 (0.004) |
| RheuArth | Spleen | 0.5 | 0.068 (0.004) |
| RheuArth | Spleen | 1 | 0.068 (0.004) |
| RheuArth | Spleen | All | 0.082 (0.004) |
| RheuArth | Stomach | 1e.06 | 0.076 (0.004) |
| RheuArth | Stomach | 1e.05 | 0.078 (0.004) |
| RheuArth | Stomach | 1e.04 | 0.075 (0.004) |
| RheuArth | Stomach | 0.001 | 0.077 (0.004) |
| RheuArth | Stomach | 0.01 | 0.073 (0.004) |
| RheuArth | Stomach | 0.05 | 0.071 (0.004) |
| RheuArth | Stomach | 0.1 | 0.071 (0.004) |
| RheuArth | Stomach | 0.5 | 0.065 (0.004) |
| RheuArth | Stomach | 1 | 0.065 (0.004) |
| RheuArth | Stomach | All | 0.087 (0.004) |
| RheuArth | Testis | 1e.06 | 0.059 (0.004) |
| RheuArth | Testis | 1e.05 | 0.06 (0.004) |
| RheuArth | Testis | 1e.04 | 0.06 (0.004) |
| RheuArth | Testis | 0.001 | 0.065 (0.004) |
| RheuArth | Testis | 0.01 | 0.069 (0.004) |
| RheuArth | Testis | 0.05 | 0.067 (0.004) |
| RheuArth | Testis | 0.1 | 0.067 (0.004) |
| RheuArth | Testis | 0.5 | 0.067 (0.004) |
| RheuArth | Testis | 1 | 0.066 (0.004) |
| RheuArth | Testis | All | 0.076 (0.004) |
| RheuArth | Thyroid | 1e.06 | 0.068 (0.004) |
| RheuArth | Thyroid | 1e.05 | 0.07 (0.004) |
| RheuArth | Thyroid | 1e.04 | 0.071 (0.004) |
| RheuArth | Thyroid | 0.001 | 0.074 (0.004) |
| RheuArth | Thyroid | 0.01 | 0.069 (0.004) |
| RheuArth | Thyroid | 0.05 | 0.07 (0.004) |
| RheuArth | Thyroid | 0.1 | 0.07 (0.004) |
| RheuArth | Thyroid | 0.5 | 0.066 (0.004) |
| RheuArth | Thyroid | 1 | 0.067 (0.004) |
| RheuArth | Thyroid | All | 0.086 (0.004) |
| RheuArth | Uterus | 1e.06 | 0.064 (0.004) |
| RheuArth | Uterus | 1e.05 | 0.066 (0.004) |
| RheuArth | Uterus | 1e.04 | 0.067 (0.004) |
| RheuArth | Uterus | 0.001 | 0.066 (0.004) |
| RheuArth | Uterus | 0.01 | 0.067 (0.004) |
| RheuArth | Uterus | 0.05 | 0.065 (0.004) |
| RheuArth | Uterus | 0.1 | 0.062 (0.004) |
| RheuArth | Uterus | 0.5 | 0.062 (0.004) |
| RheuArth | Uterus | 1 | 0.06 (0.004) |
| RheuArth | Uterus | All | 0.076 (0.004) |
| RheuArth | Vagina | 1e.06 | 0.074 (0.004) |
| RheuArth | Vagina | 1e.05 | 0.074 (0.004) |
| RheuArth | Vagina | 1e.04 | 0.076 (0.004) |
| RheuArth | Vagina | 0.001 | 0.075 (0.004) |
| RheuArth | Vagina | 0.01 | 0.068 (0.004) |
| RheuArth | Vagina | 0.05 | 0.067 (0.004) |
| RheuArth | Vagina | 0.1 | 0.065 (0.004) |
| RheuArth | Vagina | 0.5 | 0.062 (0.004) |
| RheuArth | Vagina | 1 | 0.061 (0.004) |
| RheuArth | Vagina | All | 0.08 (0.004) |
| RheuArth | Whole_Blood | 1e.06 | 0.06 (0.004) |
| RheuArth | Whole_Blood | 1e.05 | 0.059 (0.004) |
| RheuArth | Whole_Blood | 1e.04 | 0.064 (0.004) |
| RheuArth | Whole_Blood | 0.001 | 0.068 (0.004) |
| RheuArth | Whole_Blood | 0.01 | 0.068 (0.004) |
| RheuArth | Whole_Blood | 0.05 | 0.068 (0.004) |
| RheuArth | Whole_Blood | 0.1 | 0.067 (0.004) |
| RheuArth | Whole_Blood | 0.5 | 0.071 (0.004) |
| RheuArth | Whole_Blood | 1 | 0.07 (0.004) |
| RheuArth | Whole_Blood | All | 0.081 (0.004) |
| RheuArth | YFS.BLOOD.RNAARR | 1e.06 | 0.074 (0.004) |
| RheuArth | YFS.BLOOD.RNAARR | 1e.05 | 0.075 (0.004) |
| RheuArth | YFS.BLOOD.RNAARR | 1e.04 | 0.079 (0.004) |
| RheuArth | YFS.BLOOD.RNAARR | 0.001 | 0.076 (0.004) |
| RheuArth | YFS.BLOOD.RNAARR | 0.01 | 0.079 (0.004) |
| RheuArth | YFS.BLOOD.RNAARR | 0.05 | 0.079 (0.004) |
| RheuArth | YFS.BLOOD.RNAARR | 0.1 | 0.074 (0.004) |
| RheuArth | YFS.BLOOD.RNAARR | 0.5 | 0.073 (0.004) |
| RheuArth | YFS.BLOOD.RNAARR | 1 | 0.074 (0.004) |
| RheuArth | YFS.BLOOD.RNAARR | All | 0.091 (0.004) |
| Phenotype | Weight | Model | R (SE) | P |
|---|---|---|---|---|
| Depression | Adipose_Subcutaneous | All | 0.05 (0.004) | 0e+00 |
| Depression | Adipose_Visceral_Omentum | All | 0.043 (0.004) | 0e+00 |
| Depression | Adrenal_Gland | All | 0.049 (0.004) | 0e+00 |
| Depression | Artery_Aorta | All | 0.051 (0.004) | 0e+00 |
| Depression | Artery_Coronary | 1 | 0.036 (0.004) | 0e+00 |
| Depression | Artery_Tibial | All | 0.05 (0.004) | 0e+00 |
| Depression | Brain_Amygdala | 0.05 | 0.034 (0.004) | 0e+00 |
| Depression | Brain_Anterior_cingulate_cortex_BA24 | All | 0.04 (0.004) | 0e+00 |
| Depression | Brain_Caudate_basal_ganglia | All | 0.041 (0.004) | 0e+00 |
| Depression | Brain_Cerebellar_Hemisphere | All | 0.047 (0.004) | 0e+00 |
| Depression | Brain_Cerebellum | All | 0.044 (0.004) | 0e+00 |
| Depression | Brain_Cortex | All | 0.048 (0.004) | 0e+00 |
| Depression | Brain_Frontal_Cortex_BA9 | All | 0.038 (0.004) | 0e+00 |
| Depression | Brain_Hippocampus | All | 0.037 (0.004) | 0e+00 |
| Depression | Brain_Hypothalamus | All | 0.037 (0.004) | 0e+00 |
| Depression | Brain_Nucleus_accumbens_basal_ganglia | All | 0.039 (0.004) | 0e+00 |
| Depression | Brain_Putamen_basal_ganglia | All | 0.04 (0.004) | 0e+00 |
| Depression | Brain_Spinal_cord_cervical_c-1 | All | 0.036 (0.004) | 0e+00 |
| Depression | Brain_Substantia_nigra | All | 0.033 (0.004) | 0e+00 |
| Depression | Breast_Mammary_Tissue | All | 0.043 (0.004) | 0e+00 |
| Depression | Cells_EBV-transformed_lymphocytes | 0.5 | 0.041 (0.004) | 0e+00 |
| Depression | Cells_Transformed_fibroblasts | 1 | 0.047 (0.004) | 0e+00 |
| Depression | CMC.BRAIN.RNASEQ | 0.5 | 0.052 (0.004) | 0e+00 |
| Depression | CMC.BRAIN.RNASEQ_SPLICING | All | 0.048 (0.004) | 0e+00 |
| Depression | Colon_Sigmoid | All | 0.044 (0.004) | 0e+00 |
| Depression | Colon_Transverse | All | 0.05 (0.004) | 0e+00 |
| Depression | Esophagus_Gastroesophageal_Junction | All | 0.043 (0.004) | 0e+00 |
| Depression | Esophagus_Mucosa | All | 0.05 (0.004) | 0e+00 |
| Depression | Esophagus_Muscularis | All | 0.053 (0.004) | 0e+00 |
| Depression | Heart_Atrial_Appendage | All | 0.045 (0.004) | 0e+00 |
| Depression | Heart_Left_Ventricle | 0.5 | 0.043 (0.004) | 0e+00 |
| Depression | Liver | 1 | 0.034 (0.004) | 0e+00 |
| Depression | Lung | All | 0.052 (0.004) | 0e+00 |
| Depression | METSIM.ADIPOSE.RNASEQ | All | 0.043 (0.004) | 0e+00 |
| Depression | Minor_Salivary_Gland | All | 0.03 (0.004) | 0e+00 |
| Depression | Muscle_Skeletal | 1 | 0.041 (0.004) | 0e+00 |
| Depression | Nerve_Tibial | All | 0.052 (0.004) | 0e+00 |
| Depression | NTR.BLOOD.RNAARR | 1 | 0.037 (0.004) | 0e+00 |
| Depression | Ovary | All | 0.04 (0.004) | 0e+00 |
| Depression | Pancreas | All | 0.048 (0.004) | 0e+00 |
| Depression | Pituitary | 1 | 0.037 (0.004) | 0e+00 |
| Depression | Prostate | All | 0.031 (0.004) | 0e+00 |
| Depression | Skin_Not_Sun_Exposed_Suprapubic | All | 0.051 (0.004) | 0e+00 |
| Depression | Skin_Sun_Exposed_Lower_leg | All | 0.049 (0.004) | 0e+00 |
| Depression | Small_Intestine_Terminal_Ileum | 1 | 0.04 (0.004) | 0e+00 |
| Depression | Spleen | All | 0.043 (0.004) | 0e+00 |
| Depression | Stomach | All | 0.044 (0.004) | 0e+00 |
| Depression | Testis | All | 0.054 (0.004) | 0e+00 |
| Depression | Thyroid | All | 0.058 (0.004) | 0e+00 |
| Depression | Uterus | All | 0.032 (0.004) | 0e+00 |
| Depression | Vagina | All | 0.033 (0.004) | 0e+00 |
| Depression | Whole_Blood | All | 0.049 (0.004) | 0e+00 |
| Depression | YFS.BLOOD.RNAARR | 1 | 0.043 (0.004) | 0e+00 |
| Intelligence | Adipose_Subcutaneous | All | 0.056 (0.004) | 0e+00 |
| Intelligence | Adipose_Visceral_Omentum | All | 0.048 (0.004) | 0e+00 |
| Intelligence | Adrenal_Gland | All | 0.046 (0.004) | 0e+00 |
| Intelligence | Artery_Aorta | All | 0.045 (0.004) | 0e+00 |
| Intelligence | Artery_Coronary | All | 0.041 (0.004) | 0e+00 |
| Intelligence | Artery_Tibial | All | 0.055 (0.004) | 0e+00 |
| Intelligence | Brain_Amygdala | All | 0.04 (0.004) | 0e+00 |
| Intelligence | Brain_Anterior_cingulate_cortex_BA24 | All | 0.041 (0.004) | 0e+00 |
| Intelligence | Brain_Caudate_basal_ganglia | All | 0.044 (0.004) | 0e+00 |
| Intelligence | Brain_Cerebellar_Hemisphere | All | 0.045 (0.004) | 0e+00 |
| Intelligence | Brain_Cerebellum | All | 0.047 (0.004) | 0e+00 |
| Intelligence | Brain_Cortex | All | 0.041 (0.004) | 0e+00 |
| Intelligence | Brain_Frontal_Cortex_BA9 | All | 0.038 (0.004) | 0e+00 |
| Intelligence | Brain_Hippocampus | All | 0.037 (0.004) | 0e+00 |
| Intelligence | Brain_Hypothalamus | All | 0.037 (0.004) | 0e+00 |
| Intelligence | Brain_Nucleus_accumbens_basal_ganglia | All | 0.04 (0.004) | 0e+00 |
| Intelligence | Brain_Putamen_basal_ganglia | All | 0.043 (0.004) | 0e+00 |
| Intelligence | Brain_Spinal_cord_cervical_c-1 | All | 0.034 (0.004) | 0e+00 |
| Intelligence | Brain_Substantia_nigra | All | 0.033 (0.004) | 0e+00 |
| Intelligence | Breast_Mammary_Tissue | All | 0.045 (0.004) | 0e+00 |
| Intelligence | Cells_EBV-transformed_lymphocytes | 0.05 | 0.036 (0.004) | 0e+00 |
| Intelligence | Cells_Transformed_fibroblasts | All | 0.049 (0.004) | 0e+00 |
| Intelligence | CMC.BRAIN.RNASEQ | All | 0.048 (0.004) | 0e+00 |
| Intelligence | CMC.BRAIN.RNASEQ_SPLICING | All | 0.046 (0.004) | 0e+00 |
| Intelligence | Colon_Sigmoid | All | 0.045 (0.004) | 0e+00 |
| Intelligence | Colon_Transverse | All | 0.046 (0.004) | 0e+00 |
| Intelligence | Esophagus_Gastroesophageal_Junction | All | 0.046 (0.004) | 0e+00 |
| Intelligence | Esophagus_Mucosa | All | 0.044 (0.004) | 0e+00 |
| Intelligence | Esophagus_Muscularis | All | 0.053 (0.004) | 0e+00 |
| Intelligence | Heart_Atrial_Appendage | All | 0.051 (0.004) | 0e+00 |
| Intelligence | Heart_Left_Ventricle | 0.5 | 0.044 (0.004) | 0e+00 |
| Intelligence | Liver | All | 0.04 (0.004) | 0e+00 |
| Intelligence | Lung | All | 0.05 (0.004) | 0e+00 |
| Intelligence | METSIM.ADIPOSE.RNASEQ | All | 0.049 (0.004) | 0e+00 |
| Intelligence | Minor_Salivary_Gland | All | 0.035 (0.004) | 0e+00 |
| Intelligence | Muscle_Skeletal | 0.5 | 0.054 (0.004) | 0e+00 |
| Intelligence | Nerve_Tibial | All | 0.052 (0.004) | 0e+00 |
| Intelligence | NTR.BLOOD.RNAARR | All | 0.038 (0.004) | 0e+00 |
| Intelligence | Ovary | 0.5 | 0.039 (0.004) | 0e+00 |
| Intelligence | Pancreas | All | 0.049 (0.004) | 0e+00 |
| Intelligence | Pituitary | All | 0.043 (0.004) | 0e+00 |
| Intelligence | Prostate | All | 0.042 (0.004) | 0e+00 |
| Intelligence | Skin_Not_Sun_Exposed_Suprapubic | All | 0.051 (0.004) | 0e+00 |
| Intelligence | Skin_Sun_Exposed_Lower_leg | All | 0.046 (0.004) | 0e+00 |
| Intelligence | Small_Intestine_Terminal_Ileum | All | 0.035 (0.004) | 0e+00 |
| Intelligence | Spleen | All | 0.047 (0.004) | 0e+00 |
| Intelligence | Stomach | All | 0.048 (0.004) | 0e+00 |
| Intelligence | Testis | All | 0.051 (0.004) | 0e+00 |
| Intelligence | Thyroid | All | 0.052 (0.004) | 0e+00 |
| Intelligence | Uterus | All | 0.04 (0.004) | 0e+00 |
| Intelligence | Vagina | All | 0.039 (0.004) | 0e+00 |
| Intelligence | Whole_Blood | All | 0.043 (0.004) | 0e+00 |
| Intelligence | YFS.BLOOD.RNAARR | All | 0.049 (0.004) | 0e+00 |
| BMI | Adipose_Subcutaneous | All | 0.128 (0.004) | 0e+00 |
| BMI | Adipose_Visceral_Omentum | All | 0.119 (0.004) | 0e+00 |
| BMI | Adrenal_Gland | All | 0.103 (0.004) | 0e+00 |
| BMI | Artery_Aorta | All | 0.116 (0.004) | 0e+00 |
| BMI | Artery_Coronary | All | 0.103 (0.004) | 0e+00 |
| BMI | Artery_Tibial | All | 0.13 (0.004) | 0e+00 |
| BMI | Brain_Amygdala | All | 0.083 (0.004) | 0e+00 |
| BMI | Brain_Anterior_cingulate_cortex_BA24 | All | 0.1 (0.004) | 0e+00 |
| BMI | Brain_Caudate_basal_ganglia | All | 0.102 (0.004) | 0e+00 |
| BMI | Brain_Cerebellar_Hemisphere | All | 0.105 (0.004) | 0e+00 |
| BMI | Brain_Cerebellum | All | 0.11 (0.004) | 0e+00 |
| BMI | Brain_Cortex | All | 0.102 (0.004) | 0e+00 |
| BMI | Brain_Frontal_Cortex_BA9 | All | 0.098 (0.004) | 0e+00 |
| BMI | Brain_Hippocampus | All | 0.084 (0.004) | 0e+00 |
| BMI | Brain_Hypothalamus | All | 0.082 (0.004) | 0e+00 |
| BMI | Brain_Nucleus_accumbens_basal_ganglia | All | 0.095 (0.004) | 0e+00 |
| BMI | Brain_Putamen_basal_ganglia | All | 0.096 (0.004) | 0e+00 |
| BMI | Brain_Spinal_cord_cervical_c-1 | 1 | 0.09 (0.004) | 0e+00 |
| BMI | Brain_Substantia_nigra | All | 0.083 (0.004) | 0e+00 |
| BMI | Breast_Mammary_Tissue | All | 0.111 (0.004) | 0e+00 |
| BMI | Cells_EBV-transformed_lymphocytes | 1 | 0.097 (0.004) | 0e+00 |
| BMI | Cells_Transformed_fibroblasts | All | 0.124 (0.004) | 0e+00 |
| BMI | CMC.BRAIN.RNASEQ | All | 0.126 (0.004) | 0e+00 |
| BMI | CMC.BRAIN.RNASEQ_SPLICING | All | 0.109 (0.004) | 0e+00 |
| BMI | Colon_Sigmoid | All | 0.095 (0.004) | 0e+00 |
| BMI | Colon_Transverse | All | 0.102 (0.004) | 0e+00 |
| BMI | Esophagus_Gastroesophageal_Junction | All | 0.102 (0.004) | 0e+00 |
| BMI | Esophagus_Mucosa | 1 | 0.119 (0.004) | 0e+00 |
| BMI | Esophagus_Muscularis | All | 0.12 (0.004) | 0e+00 |
| BMI | Heart_Atrial_Appendage | All | 0.115 (0.004) | 0e+00 |
| BMI | Heart_Left_Ventricle | 1 | 0.112 (0.004) | 0e+00 |
| BMI | Liver | 0.5 | 0.091 (0.004) | 0e+00 |
| BMI | Lung | All | 0.12 (0.004) | 0e+00 |
| BMI | METSIM.ADIPOSE.RNASEQ | All | 0.109 (0.004) | 0e+00 |
| BMI | Minor_Salivary_Gland | 1 | 0.086 (0.004) | 0e+00 |
| BMI | Muscle_Skeletal | All | 0.12 (0.004) | 0e+00 |
| BMI | Nerve_Tibial | All | 0.127 (0.004) | 0e+00 |
| BMI | NTR.BLOOD.RNAARR | All | 0.094 (0.004) | 0e+00 |
| BMI | Ovary | All | 0.084 (0.004) | 0e+00 |
| BMI | Pancreas | All | 0.116 (0.004) | 0e+00 |
| BMI | Pituitary | All | 0.099 (0.004) | 0e+00 |
| BMI | Prostate | All | 0.093 (0.004) | 0e+00 |
| BMI | Skin_Not_Sun_Exposed_Suprapubic | All | 0.118 (0.004) | 0e+00 |
| BMI | Skin_Sun_Exposed_Lower_leg | All | 0.12 (0.004) | 0e+00 |
| BMI | Small_Intestine_Terminal_Ileum | All | 0.095 (0.004) | 0e+00 |
| BMI | Spleen | All | 0.108 (0.004) | 0e+00 |
| BMI | Stomach | All | 0.111 (0.004) | 0e+00 |
| BMI | Testis | All | 0.125 (0.004) | 0e+00 |
| BMI | Thyroid | All | 0.128 (0.004) | 0e+00 |
| BMI | Uterus | All | 0.083 (0.004) | 0e+00 |
| BMI | Vagina | All | 0.088 (0.004) | 0e+00 |
| BMI | Whole_Blood | All | 0.11 (0.004) | 0e+00 |
| BMI | YFS.BLOOD.RNAARR | 1 | 0.108 (0.004) | 0e+00 |
| Height | Adipose_Subcutaneous | All | 0.179 (0.004) | 0e+00 |
| Height | Adipose_Visceral_Omentum | All | 0.164 (0.004) | 0e+00 |
| Height | Adrenal_Gland | All | 0.148 (0.004) | 0e+00 |
| Height | Artery_Aorta | 1 | 0.161 (0.004) | 0e+00 |
| Height | Artery_Coronary | All | 0.136 (0.004) | 0e+00 |
| Height | Artery_Tibial | All | 0.18 (0.004) | 0e+00 |
| Height | Brain_Amygdala | All | 0.114 (0.004) | 0e+00 |
| Height | Brain_Anterior_cingulate_cortex_BA24 | All | 0.126 (0.004) | 0e+00 |
| Height | Brain_Caudate_basal_ganglia | All | 0.132 (0.004) | 0e+00 |
| Height | Brain_Cerebellar_Hemisphere | All | 0.137 (0.004) | 0e+00 |
| Height | Brain_Cerebellum | All | 0.146 (0.004) | 0e+00 |
| Height | Brain_Cortex | All | 0.138 (0.004) | 0e+00 |
| Height | Brain_Frontal_Cortex_BA9 | All | 0.135 (0.004) | 0e+00 |
| Height | Brain_Hippocampus | 1 | 0.113 (0.004) | 0e+00 |
| Height | Brain_Hypothalamus | 0.5 | 0.113 (0.004) | 0e+00 |
| Height | Brain_Nucleus_accumbens_basal_ganglia | All | 0.125 (0.004) | 0e+00 |
| Height | Brain_Putamen_basal_ganglia | 1 | 0.123 (0.004) | 0e+00 |
| Height | Brain_Spinal_cord_cervical_c-1 | All | 0.113 (0.004) | 0e+00 |
| Height | Brain_Substantia_nigra | All | 0.101 (0.004) | 0e+00 |
| Height | Breast_Mammary_Tissue | All | 0.152 (0.004) | 0e+00 |
| Height | Cells_EBV-transformed_lymphocytes | 0.5 | 0.13 (0.004) | 0e+00 |
| Height | Cells_Transformed_fibroblasts | 1 | 0.17 (0.004) | 0e+00 |
| Height | CMC.BRAIN.RNASEQ | 0.5 | 0.165 (0.004) | 0e+00 |
| Height | CMC.BRAIN.RNASEQ_SPLICING | All | 0.147 (0.004) | 0e+00 |
| Height | Colon_Sigmoid | All | 0.142 (0.004) | 0e+00 |
| Height | Colon_Transverse | All | 0.149 (0.004) | 0e+00 |
| Height | Esophagus_Gastroesophageal_Junction | 1 | 0.15 (0.004) | 0e+00 |
| Height | Esophagus_Mucosa | 0.5 | 0.176 (0.004) | 0e+00 |
| Height | Esophagus_Muscularis | 0.5 | 0.17 (0.004) | 0e+00 |
| Height | Heart_Atrial_Appendage | 0.5 | 0.156 (0.004) | 0e+00 |
| Height | Heart_Left_Ventricle | 0.5 | 0.148 (0.004) | 0e+00 |
| Height | Liver | All | 0.134 (0.004) | 0e+00 |
| Height | Lung | All | 0.169 (0.004) | 0e+00 |
| Height | METSIM.ADIPOSE.RNASEQ | 0.5 | 0.152 (0.004) | 0e+00 |
| Height | Minor_Salivary_Gland | All | 0.109 (0.004) | 0e+00 |
| Height | Muscle_Skeletal | 0.5 | 0.169 (0.004) | 0e+00 |
| Height | Nerve_Tibial | All | 0.182 (0.004) | 0e+00 |
| Height | NTR.BLOOD.RNAARR | All | 0.139 (0.004) | 0e+00 |
| Height | Ovary | All | 0.12 (0.004) | 0e+00 |
| Height | Pancreas | All | 0.155 (0.004) | 0e+00 |
| Height | Pituitary | All | 0.143 (0.004) | 0e+00 |
| Height | Prostate | 0.5 | 0.114 (0.004) | 0e+00 |
| Height | Skin_Not_Sun_Exposed_Suprapubic | 1 | 0.168 (0.004) | 0e+00 |
| Height | Skin_Sun_Exposed_Lower_leg | All | 0.175 (0.004) | 0e+00 |
| Height | Small_Intestine_Terminal_Ileum | All | 0.126 (0.004) | 0e+00 |
| Height | Spleen | All | 0.145 (0.004) | 0e+00 |
| Height | Stomach | All | 0.151 (0.004) | 0e+00 |
| Height | Testis | All | 0.176 (0.004) | 0e+00 |
| Height | Thyroid | 0.5 | 0.181 (0.004) | 0e+00 |
| Height | Uterus | 1 | 0.107 (0.004) | 0e+00 |
| Height | Vagina | All | 0.109 (0.004) | 0e+00 |
| Height | Whole_Blood | All | 0.162 (0.004) | 0e+00 |
| Height | YFS.BLOOD.RNAARR | All | 0.164 (0.004) | 0e+00 |
| T2D | Adipose_Subcutaneous | All | 0.11 (0.004) | 0e+00 |
| T2D | Adipose_Visceral_Omentum | All | 0.088 (0.004) | 0e+00 |
| T2D | Adrenal_Gland | All | 0.082 (0.004) | 0e+00 |
| T2D | Artery_Aorta | All | 0.101 (0.004) | 0e+00 |
| T2D | Artery_Coronary | All | 0.069 (0.004) | 0e+00 |
| T2D | Artery_Tibial | All | 0.107 (0.004) | 0e+00 |
| T2D | Brain_Amygdala | All | 0.067 (0.004) | 0e+00 |
| T2D | Brain_Anterior_cingulate_cortex_BA24 | All | 0.069 (0.004) | 0e+00 |
| T2D | Brain_Caudate_basal_ganglia | All | 0.07 (0.004) | 0e+00 |
| T2D | Brain_Cerebellar_Hemisphere | All | 0.081 (0.004) | 0e+00 |
| T2D | Brain_Cerebellum | All | 0.084 (0.004) | 0e+00 |
| T2D | Brain_Cortex | All | 0.07 (0.004) | 0e+00 |
| T2D | Brain_Frontal_Cortex_BA9 | All | 0.071 (0.004) | 0e+00 |
| T2D | Brain_Hippocampus | All | 0.062 (0.004) | 0e+00 |
| T2D | Brain_Hypothalamus | All | 0.061 (0.004) | 0e+00 |
| T2D | Brain_Nucleus_accumbens_basal_ganglia | All | 0.072 (0.004) | 0e+00 |
| T2D | Brain_Putamen_basal_ganglia | All | 0.067 (0.004) | 0e+00 |
| T2D | Brain_Spinal_cord_cervical_c-1 | All | 0.061 (0.004) | 0e+00 |
| T2D | Brain_Substantia_nigra | All | 0.049 (0.004) | 0e+00 |
| T2D | Breast_Mammary_Tissue | All | 0.088 (0.004) | 0e+00 |
| T2D | Cells_EBV-transformed_lymphocytes | All | 0.063 (0.004) | 0e+00 |
| T2D | Cells_Transformed_fibroblasts | All | 0.104 (0.004) | 0e+00 |
| T2D | CMC.BRAIN.RNASEQ | All | 0.104 (0.004) | 0e+00 |
| T2D | CMC.BRAIN.RNASEQ_SPLICING | All | 0.084 (0.004) | 0e+00 |
| T2D | Colon_Sigmoid | All | 0.076 (0.004) | 0e+00 |
| T2D | Colon_Transverse | All | 0.083 (0.004) | 0e+00 |
| T2D | Esophagus_Gastroesophageal_Junction | All | 0.085 (0.004) | 0e+00 |
| T2D | Esophagus_Mucosa | All | 0.085 (0.004) | 0e+00 |
| T2D | Esophagus_Muscularis | All | 0.097 (0.004) | 0e+00 |
| T2D | Heart_Atrial_Appendage | All | 0.093 (0.004) | 0e+00 |
| T2D | Heart_Left_Ventricle | All | 0.087 (0.004) | 0e+00 |
| T2D | Liver | All | 0.077 (0.004) | 0e+00 |
| T2D | Lung | All | 0.093 (0.004) | 0e+00 |
| T2D | METSIM.ADIPOSE.RNASEQ | All | 0.087 (0.004) | 0e+00 |
| T2D | Minor_Salivary_Gland | All | 0.055 (0.004) | 0e+00 |
| T2D | Muscle_Skeletal | All | 0.104 (0.004) | 0e+00 |
| T2D | Nerve_Tibial | All | 0.109 (0.004) | 0e+00 |
| T2D | NTR.BLOOD.RNAARR | All | 0.082 (0.004) | 0e+00 |
| T2D | Ovary | All | 0.069 (0.004) | 0e+00 |
| T2D | Pancreas | All | 0.086 (0.004) | 0e+00 |
| T2D | Pituitary | All | 0.076 (0.004) | 0e+00 |
| T2D | Prostate | All | 0.059 (0.004) | 0e+00 |
| T2D | Skin_Not_Sun_Exposed_Suprapubic | All | 0.094 (0.004) | 0e+00 |
| T2D | Skin_Sun_Exposed_Lower_leg | All | 0.098 (0.004) | 0e+00 |
| T2D | Small_Intestine_Terminal_Ileum | All | 0.076 (0.004) | 0e+00 |
| T2D | Spleen | All | 0.083 (0.004) | 0e+00 |
| T2D | Stomach | All | 0.081 (0.004) | 0e+00 |
| T2D | Testis | All | 0.098 (0.004) | 0e+00 |
| T2D | Thyroid | All | 0.106 (0.004) | 0e+00 |
| T2D | Uterus | All | 0.057 (0.004) | 0e+00 |
| T2D | Vagina | All | 0.056 (0.004) | 0e+00 |
| T2D | Whole_Blood | All | 0.087 (0.004) | 0e+00 |
| T2D | YFS.BLOOD.RNAARR | All | 0.086 (0.004) | 0e+00 |
| CAD | Adipose_Subcutaneous | All | 0.076 (0.004) | 0e+00 |
| CAD | Adipose_Visceral_Omentum | All | 0.07 (0.004) | 0e+00 |
| CAD | Adrenal_Gland | All | 0.058 (0.004) | 0e+00 |
| CAD | Artery_Aorta | All | 0.089 (0.004) | 0e+00 |
| CAD | Artery_Coronary | All | 0.064 (0.004) | 0e+00 |
| CAD | Artery_Tibial | All | 0.089 (0.004) | 0e+00 |
| CAD | Brain_Amygdala | 1 | 0.036 (0.004) | 0e+00 |
| CAD | Brain_Anterior_cingulate_cortex_BA24 | All | 0.042 (0.004) | 0e+00 |
| CAD | Brain_Caudate_basal_ganglia | All | 0.058 (0.004) | 0e+00 |
| CAD | Brain_Cerebellar_Hemisphere | All | 0.057 (0.004) | 0e+00 |
| CAD | Brain_Cerebellum | All | 0.052 (0.004) | 0e+00 |
| CAD | Brain_Cortex | All | 0.061 (0.004) | 0e+00 |
| CAD | Brain_Frontal_Cortex_BA9 | All | 0.047 (0.004) | 0e+00 |
| CAD | Brain_Hippocampus | All | 0.042 (0.004) | 0e+00 |
| CAD | Brain_Hypothalamus | All | 0.038 (0.004) | 0e+00 |
| CAD | Brain_Nucleus_accumbens_basal_ganglia | All | 0.048 (0.004) | 0e+00 |
| CAD | Brain_Putamen_basal_ganglia | All | 0.043 (0.004) | 0e+00 |
| CAD | Brain_Spinal_cord_cervical_c-1 | All | 0.053 (0.004) | 0e+00 |
| CAD | Brain_Substantia_nigra | 0.5 | 0.041 (0.004) | 0e+00 |
| CAD | Breast_Mammary_Tissue | All | 0.063 (0.004) | 0e+00 |
| CAD | Cells_EBV-transformed_lymphocytes | All | 0.051 (0.004) | 0e+00 |
| CAD | Cells_Transformed_fibroblasts | All | 0.084 (0.004) | 0e+00 |
| CAD | CMC.BRAIN.RNASEQ | All | 0.081 (0.004) | 0e+00 |
| CAD | CMC.BRAIN.RNASEQ_SPLICING | All | 0.054 (0.004) | 0e+00 |
| CAD | Colon_Sigmoid | All | 0.061 (0.004) | 0e+00 |
| CAD | Colon_Transverse | All | 0.064 (0.004) | 0e+00 |
| CAD | Esophagus_Gastroesophageal_Junction | All | 0.058 (0.004) | 0e+00 |
| CAD | Esophagus_Mucosa | All | 0.072 (0.004) | 0e+00 |
| CAD | Esophagus_Muscularis | All | 0.069 (0.004) | 0e+00 |
| CAD | Heart_Atrial_Appendage | All | 0.065 (0.004) | 0e+00 |
| CAD | Heart_Left_Ventricle | All | 0.066 (0.004) | 0e+00 |
| CAD | Liver | All | 0.051 (0.004) | 0e+00 |
| CAD | Lung | All | 0.076 (0.004) | 0e+00 |
| CAD | METSIM.ADIPOSE.RNASEQ | All | 0.07 (0.004) | 0e+00 |
| CAD | Minor_Salivary_Gland | All | 0.043 (0.004) | 0e+00 |
| CAD | Muscle_Skeletal | All | 0.085 (0.004) | 0e+00 |
| CAD | Nerve_Tibial | All | 0.086 (0.004) | 0e+00 |
| CAD | NTR.BLOOD.RNAARR | All | 0.063 (0.004) | 0e+00 |
| CAD | Ovary | All | 0.054 (0.004) | 0e+00 |
| CAD | Pancreas | All | 0.068 (0.004) | 0e+00 |
| CAD | Pituitary | All | 0.057 (0.004) | 0e+00 |
| CAD | Prostate | All | 0.046 (0.004) | 0e+00 |
| CAD | Skin_Not_Sun_Exposed_Suprapubic | All | 0.072 (0.004) | 0e+00 |
| CAD | Skin_Sun_Exposed_Lower_leg | All | 0.077 (0.004) | 0e+00 |
| CAD | Small_Intestine_Terminal_Ileum | All | 0.048 (0.004) | 0e+00 |
| CAD | Spleen | All | 0.064 (0.004) | 0e+00 |
| CAD | Stomach | 1 | 0.059 (0.004) | 0e+00 |
| CAD | Testis | All | 0.073 (0.004) | 0e+00 |
| CAD | Thyroid | All | 0.08 (0.004) | 0e+00 |
| CAD | Uterus | All | 0.045 (0.004) | 0e+00 |
| CAD | Vagina | All | 0.039 (0.004) | 0e+00 |
| CAD | Whole_Blood | All | 0.074 (0.004) | 0e+00 |
| CAD | YFS.BLOOD.RNAARR | All | 0.071 (0.004) | 0e+00 |
| IBD | Adipose_Subcutaneous | All | 0.064 (0.004) | 0e+00 |
| IBD | Adipose_Visceral_Omentum | All | 0.06 (0.004) | 0e+00 |
| IBD | Adrenal_Gland | All | 0.05 (0.004) | 0e+00 |
| IBD | Artery_Aorta | All | 0.055 (0.004) | 0e+00 |
| IBD | Artery_Coronary | All | 0.047 (0.004) | 0e+00 |
| IBD | Artery_Tibial | All | 0.06 (0.004) | 0e+00 |
| IBD | Brain_Amygdala | All | 0.036 (0.004) | 0e+00 |
| IBD | Brain_Anterior_cingulate_cortex_BA24 | All | 0.044 (0.004) | 0e+00 |
| IBD | Brain_Caudate_basal_ganglia | All | 0.045 (0.004) | 0e+00 |
| IBD | Brain_Cerebellar_Hemisphere | All | 0.052 (0.004) | 0e+00 |
| IBD | Brain_Cerebellum | All | 0.057 (0.004) | 0e+00 |
| IBD | Brain_Cortex | All | 0.051 (0.004) | 0e+00 |
| IBD | Brain_Frontal_Cortex_BA9 | All | 0.04 (0.004) | 0e+00 |
| IBD | Brain_Hippocampus | All | 0.042 (0.004) | 0e+00 |
| IBD | Brain_Hypothalamus | 0.5 | 0.038 (0.004) | 0e+00 |
| IBD | Brain_Nucleus_accumbens_basal_ganglia | All | 0.048 (0.004) | 0e+00 |
| IBD | Brain_Putamen_basal_ganglia | All | 0.042 (0.004) | 0e+00 |
| IBD | Brain_Spinal_cord_cervical_c-1 | All | 0.032 (0.004) | 0e+00 |
| IBD | Brain_Substantia_nigra | All | 0.034 (0.004) | 0e+00 |
| IBD | Breast_Mammary_Tissue | All | 0.054 (0.004) | 0e+00 |
| IBD | Cells_EBV-transformed_lymphocytes | All | 0.047 (0.004) | 0e+00 |
| IBD | Cells_Transformed_fibroblasts | All | 0.061 (0.004) | 0e+00 |
| IBD | CMC.BRAIN.RNASEQ | All | 0.058 (0.004) | 0e+00 |
| IBD | CMC.BRAIN.RNASEQ_SPLICING | All | 0.047 (0.004) | 0e+00 |
| IBD | Colon_Sigmoid | All | 0.054 (0.004) | 0e+00 |
| IBD | Colon_Transverse | All | 0.055 (0.004) | 0e+00 |
| IBD | Esophagus_Gastroesophageal_Junction | 0.5 | 0.053 (0.004) | 0e+00 |
| IBD | Esophagus_Mucosa | All | 0.063 (0.004) | 0e+00 |
| IBD | Esophagus_Muscularis | All | 0.063 (0.004) | 0e+00 |
| IBD | Heart_Atrial_Appendage | All | 0.053 (0.004) | 0e+00 |
| IBD | Heart_Left_Ventricle | All | 0.058 (0.004) | 0e+00 |
| IBD | Liver | All | 0.047 (0.004) | 0e+00 |
| IBD | Lung | All | 0.063 (0.004) | 0e+00 |
| IBD | METSIM.ADIPOSE.RNASEQ | All | 0.062 (0.004) | 0e+00 |
| IBD | Minor_Salivary_Gland | All | 0.043 (0.004) | 0e+00 |
| IBD | Muscle_Skeletal | All | 0.066 (0.004) | 0e+00 |
| IBD | Nerve_Tibial | All | 0.065 (0.004) | 0e+00 |
| IBD | NTR.BLOOD.RNAARR | All | 0.055 (0.004) | 0e+00 |
| IBD | Ovary | All | 0.049 (0.004) | 0e+00 |
| IBD | Pancreas | All | 0.055 (0.004) | 0e+00 |
| IBD | Pituitary | All | 0.046 (0.004) | 0e+00 |
| IBD | Prostate | All | 0.047 (0.004) | 0e+00 |
| IBD | Skin_Not_Sun_Exposed_Suprapubic | All | 0.06 (0.004) | 0e+00 |
| IBD | Skin_Sun_Exposed_Lower_leg | All | 0.068 (0.004) | 0e+00 |
| IBD | Small_Intestine_Terminal_Ileum | All | 0.05 (0.004) | 0e+00 |
| IBD | Spleen | All | 0.055 (0.004) | 0e+00 |
| IBD | Stomach | All | 0.054 (0.004) | 0e+00 |
| IBD | Testis | All | 0.065 (0.004) | 0e+00 |
| IBD | Thyroid | All | 0.064 (0.004) | 0e+00 |
| IBD | Uterus | All | 0.04 (0.004) | 0e+00 |
| IBD | Vagina | All | 0.03 (0.004) | 0e+00 |
| IBD | Whole_Blood | All | 0.07 (0.004) | 0e+00 |
| IBD | YFS.BLOOD.RNAARR | All | 0.062 (0.004) | 0e+00 |
| RheuArth | Adipose_Subcutaneous | All | 0.07 (0.004) | 0e+00 |
| RheuArth | Adipose_Visceral_Omentum | All | 0.082 (0.004) | 0e+00 |
| RheuArth | Adrenal_Gland | All | 0.075 (0.004) | 0e+00 |
| RheuArth | Artery_Aorta | All | 0.079 (0.004) | 0e+00 |
| RheuArth | Artery_Coronary | All | 0.079 (0.004) | 0e+00 |
| RheuArth | Artery_Tibial | All | 0.081 (0.004) | 0e+00 |
| RheuArth | Brain_Amygdala | All | 0.083 (0.004) | 0e+00 |
| RheuArth | Brain_Anterior_cingulate_cortex_BA24 | All | 0.047 (0.004) | 0e+00 |
| RheuArth | Brain_Caudate_basal_ganglia | All | 0.077 (0.004) | 0e+00 |
| RheuArth | Brain_Cerebellar_Hemisphere | All | 0.071 (0.004) | 0e+00 |
| RheuArth | Brain_Cerebellum | All | 0.066 (0.004) | 0e+00 |
| RheuArth | Brain_Cortex | All | 0.097 (0.004) | 0e+00 |
| RheuArth | Brain_Frontal_Cortex_BA9 | All | 0.058 (0.004) | 0e+00 |
| RheuArth | Brain_Hippocampus | All | 0.053 (0.004) | 0e+00 |
| RheuArth | Brain_Hypothalamus | All | 0.06 (0.004) | 0e+00 |
| RheuArth | Brain_Nucleus_accumbens_basal_ganglia | All | 0.085 (0.004) | 0e+00 |
| RheuArth | Brain_Putamen_basal_ganglia | All | 0.052 (0.004) | 0e+00 |
| RheuArth | Brain_Spinal_cord_cervical_c-1 | 0.05 | 0.043 (0.004) | 0e+00 |
| RheuArth | Brain_Substantia_nigra | All | 0.084 (0.004) | 0e+00 |
| RheuArth | Breast_Mammary_Tissue | All | 0.078 (0.004) | 0e+00 |
| RheuArth | Cells_EBV-transformed_lymphocytes | All | 0.071 (0.004) | 0e+00 |
| RheuArth | Cells_Transformed_fibroblasts | All | 0.086 (0.004) | 0e+00 |
| RheuArth | CMC.BRAIN.RNASEQ | All | 0.073 (0.004) | 0e+00 |
| RheuArth | CMC.BRAIN.RNASEQ_SPLICING | All | 0.056 (0.004) | 0e+00 |
| RheuArth | Colon_Sigmoid | All | 0.081 (0.004) | 0e+00 |
| RheuArth | Colon_Transverse | All | 0.074 (0.004) | 0e+00 |
| RheuArth | Esophagus_Gastroesophageal_Junction | All | 0.071 (0.004) | 0e+00 |
| RheuArth | Esophagus_Mucosa | All | 0.081 (0.004) | 0e+00 |
| RheuArth | Esophagus_Muscularis | All | 0.089 (0.004) | 0e+00 |
| RheuArth | Heart_Atrial_Appendage | All | 0.089 (0.004) | 0e+00 |
| RheuArth | Heart_Left_Ventricle | All | 0.089 (0.004) | 0e+00 |
| RheuArth | Liver | All | 0.081 (0.004) | 0e+00 |
| RheuArth | Lung | All | 0.089 (0.004) | 0e+00 |
| RheuArth | METSIM.ADIPOSE.RNASEQ | All | 0.095 (0.004) | 0e+00 |
| RheuArth | Minor_Salivary_Gland | All | 0.076 (0.004) | 0e+00 |
| RheuArth | Muscle_Skeletal | All | 0.082 (0.004) | 0e+00 |
| RheuArth | Nerve_Tibial | All | 0.083 (0.004) | 0e+00 |
| RheuArth | NTR.BLOOD.RNAARR | All | 0.073 (0.004) | 0e+00 |
| RheuArth | Ovary | All | 0.077 (0.004) | 0e+00 |
| RheuArth | Pancreas | All | 0.078 (0.004) | 0e+00 |
| RheuArth | Pituitary | All | 0.077 (0.004) | 0e+00 |
| RheuArth | Prostate | All | 0.05 (0.004) | 0e+00 |
| RheuArth | Skin_Not_Sun_Exposed_Suprapubic | All | 0.062 (0.004) | 0e+00 |
| RheuArth | Skin_Sun_Exposed_Lower_leg | All | 0.067 (0.004) | 0e+00 |
| RheuArth | Small_Intestine_Terminal_Ileum | All | 0.074 (0.004) | 0e+00 |
| RheuArth | Spleen | All | 0.082 (0.004) | 0e+00 |
| RheuArth | Stomach | All | 0.087 (0.004) | 0e+00 |
| RheuArth | Testis | All | 0.076 (0.004) | 0e+00 |
| RheuArth | Thyroid | All | 0.086 (0.004) | 0e+00 |
| RheuArth | Uterus | All | 0.076 (0.004) | 0e+00 |
| RheuArth | Vagina | All | 0.08 (0.004) | 0e+00 |
| RheuArth | Whole_Blood | All | 0.081 (0.004) | 0e+00 |
| RheuArth | YFS.BLOOD.RNAARR | All | 0.091 (0.004) | 0e+00 |
Show cis-regulated expression-based heritability
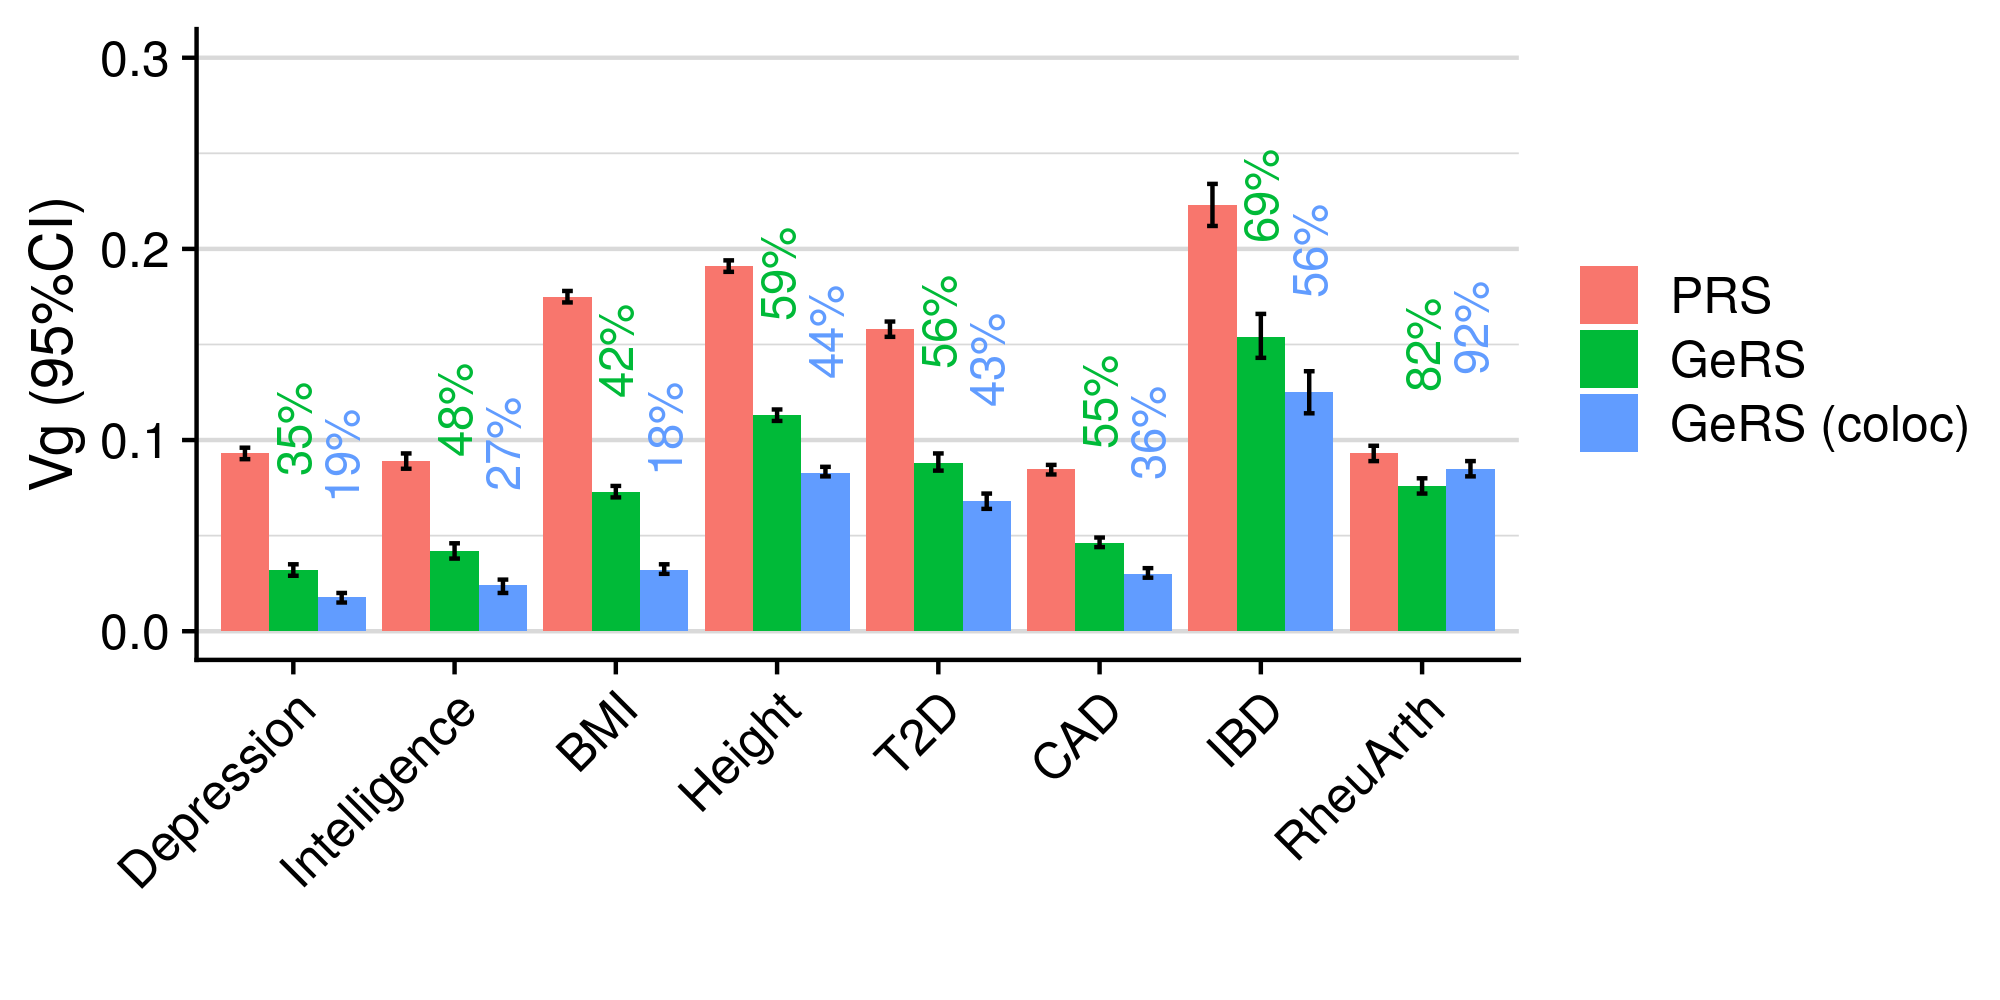
Proportion of heritability explained
Show summary of GeRS tests
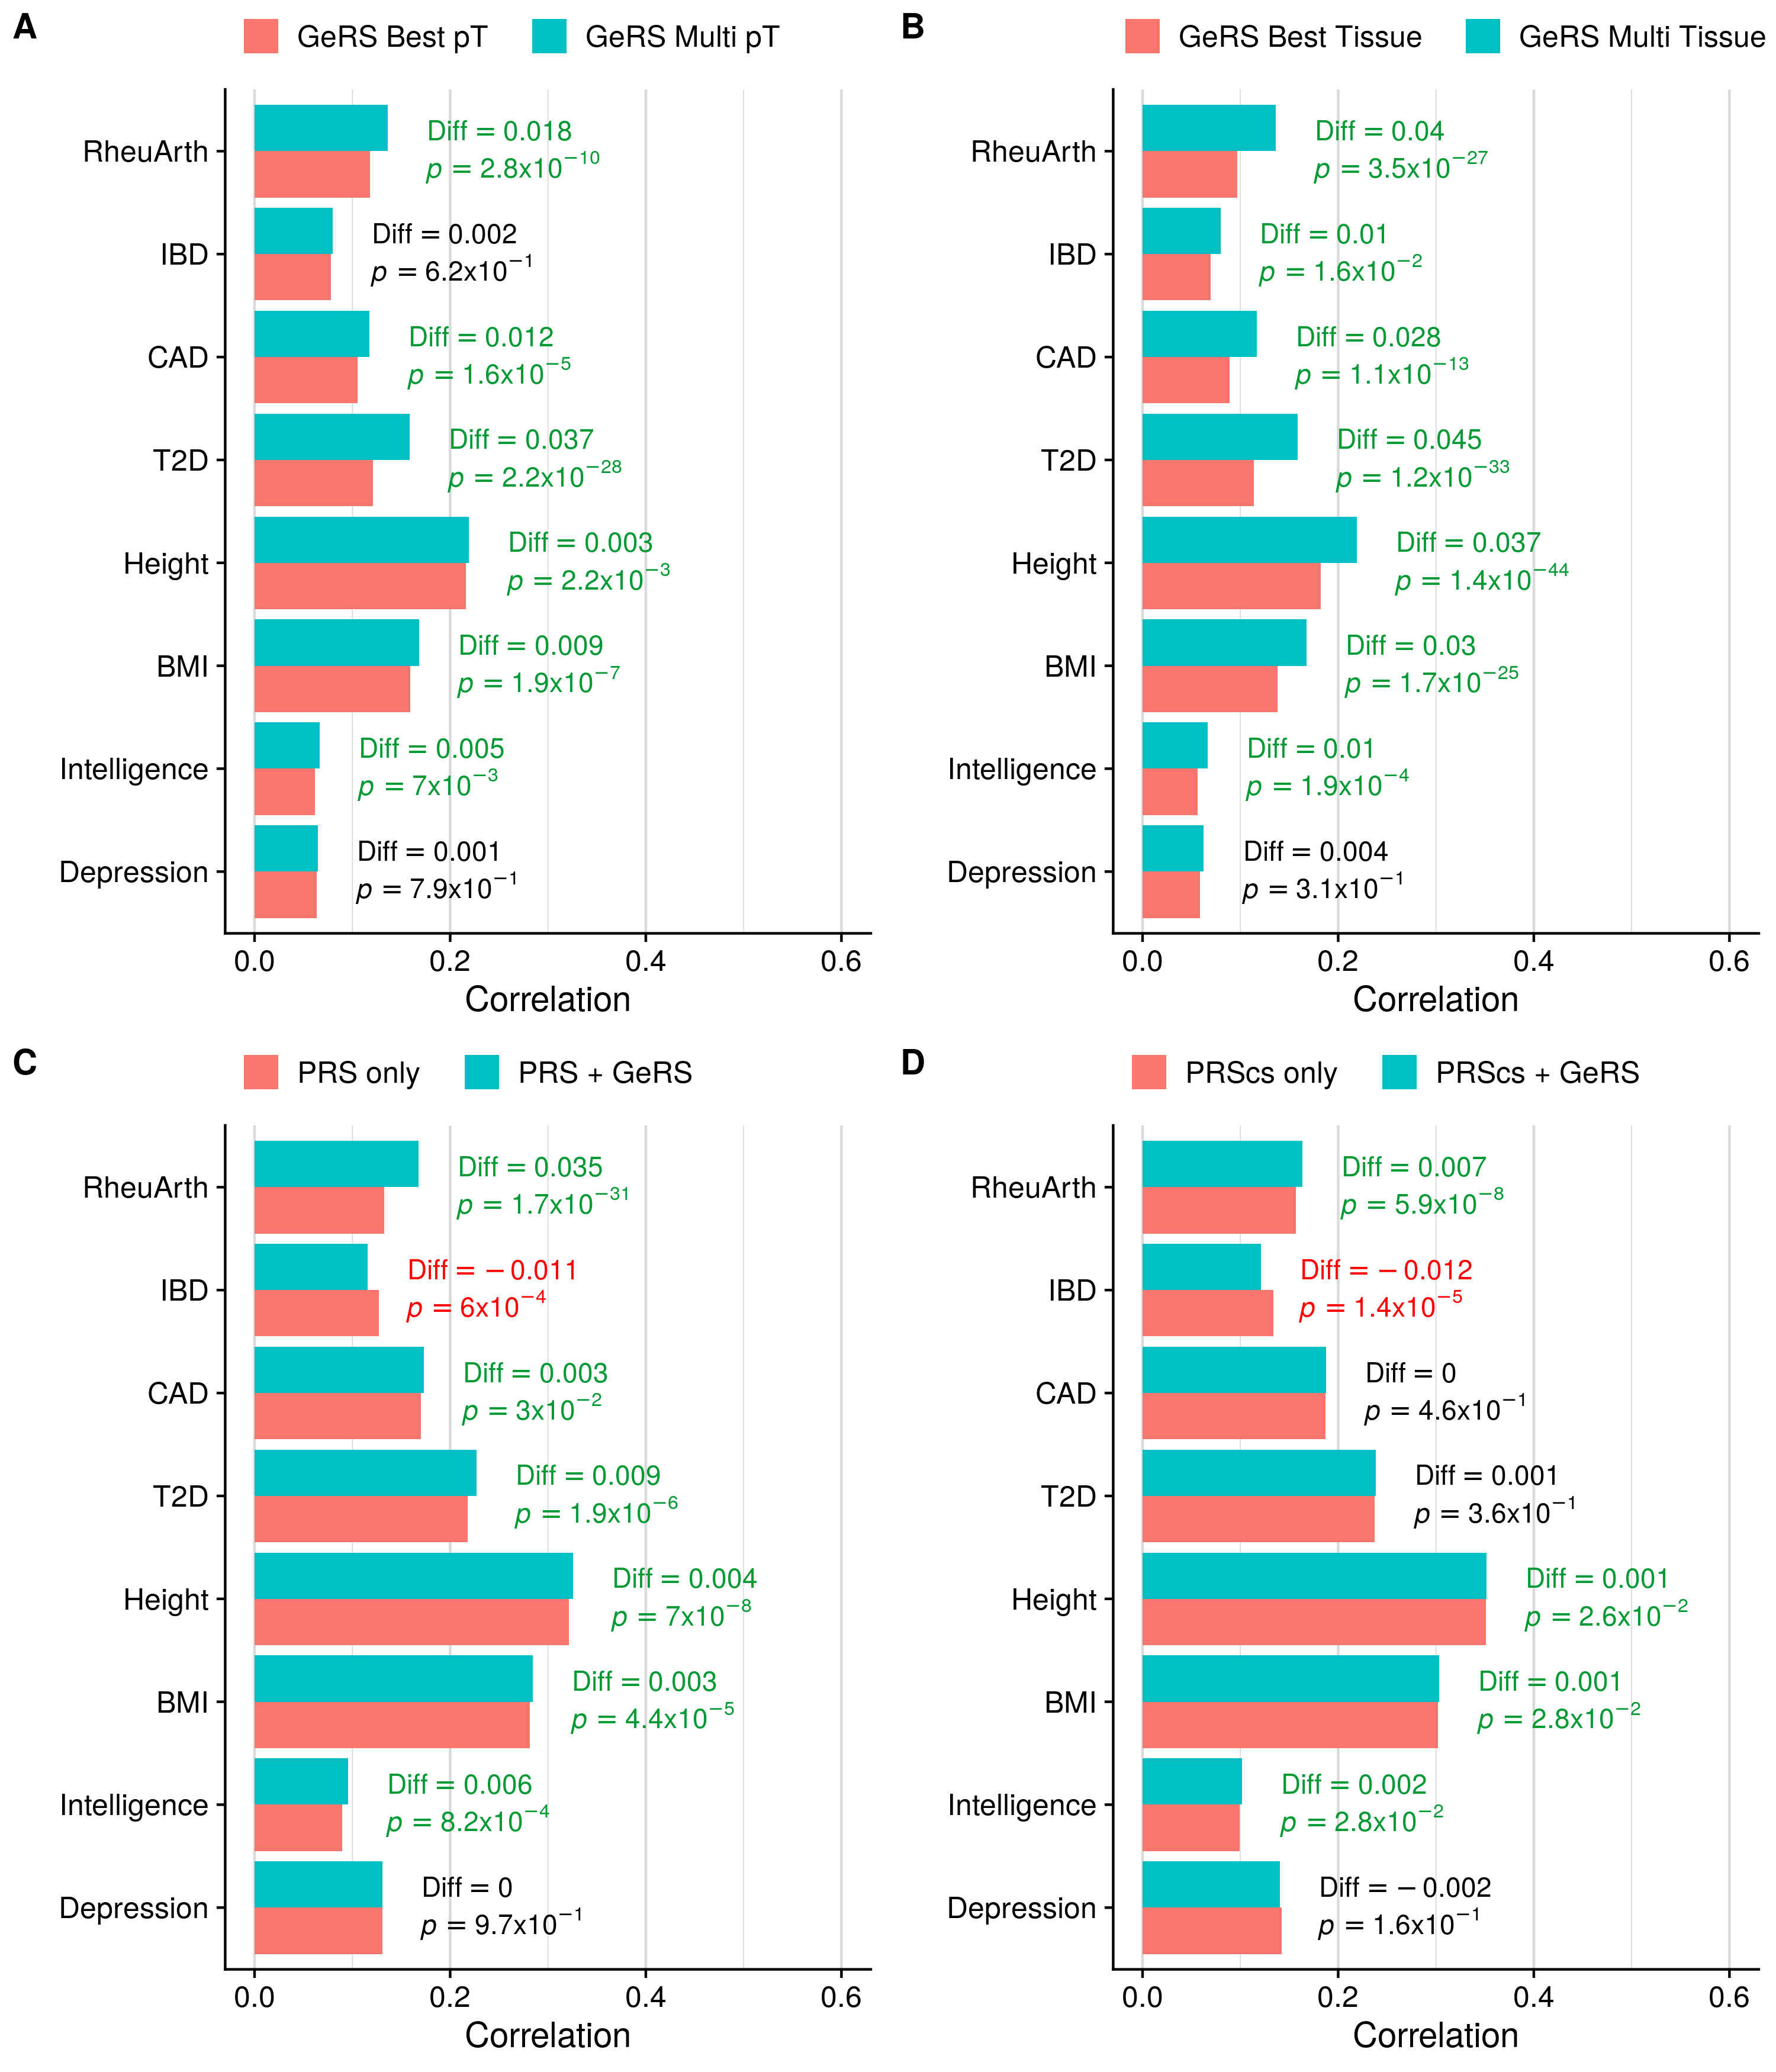
Predictive utility
| FALSE | Phenotype | Test | Model 1 | Model 2 | Model 1 R | Model 2 R | R diff | R perc diff | R diff pval |
|---|---|---|---|---|---|---|---|---|---|
| 1 | Depression | GeRS_multi_pT | All | 1 | 0.064 | 0.064 | 0.001 | 1.1% | 7.93e-01 |
| 6 | Intelligence | GeRS_multi_pT | All | 0.5 | 0.067 | 0.061 | 0.005 | 7.9% | 6.95e-03 |
| 11 | BMI | GeRS_multi_pT | All | 1 | 0.168 | 0.159 | 0.009 | 5.3% | 1.87e-07 |
| 16 | Height | GeRS_multi_pT | All | 0.5 | 0.219 | 0.216 | 0.003 | 1.3% | 2.23e-03 |
| 21 | T2D | GeRS_multi_pT | All | 0.5 | 0.158 | 0.121 | 0.037 | 23.6% | 2.21e-28 |
| 26 | CAD | GeRS_multi_pT | All | 0.5 | 0.118 | 0.106 | 0.012 | 10.2% | 1.56e-05 |
| 31 | IBD | GeRS_multi_pT | All | 0.1 | 0.080 | 0.078 | 0.002 | 2.3% | 6.21e-01 |
| 36 | RheuArth | GeRS_multi_pT | All | 1e.06 | 0.136 | 0.118 | 0.018 | 13.4% | 2.80e-10 |
| 2 | Depression | GeRS_multi_tissue | All | CMC.BRAIN.RNASEQ | 0.063 | 0.059 | 0.004 | 5.8% | 3.10e-01 |
| 7 | Intelligence | GeRS_multi_tissue | All | Adipose.Subcutaneous | 0.067 | 0.056 | 0.010 | 15.5% | 1.89e-04 |
| 12 | BMI | GeRS_multi_tissue | All | CMC.BRAIN.RNASEQ | 0.168 | 0.138 | 0.030 | 17.8% | 1.69e-25 |
| 17 | Height | GeRS_multi_tissue | All | Nerve.Tibial | 0.219 | 0.182 | 0.037 | 16.9% | 1.36e-44 |
| 22 | T2D | GeRS_multi_tissue | All | CMC.BRAIN.RNASEQ | 0.159 | 0.114 | 0.045 | 28.3% | 1.18e-33 |
| 27 | CAD | GeRS_multi_tissue | All | Artery.Tibial | 0.117 | 0.089 | 0.028 | 23.6% | 1.13e-13 |
| 32 | IBD | GeRS_multi_tissue | All | Whole.Blood | 0.080 | 0.070 | 0.010 | 13% | 1.61e-02 |
| 37 | RheuArth | GeRS_multi_tissue | All | Brain.Cortex | 0.136 | 0.097 | 0.040 | 29% | 3.46e-27 |
| 3 | Depression | PRS_and_GeRS | All | PRS | 0.131 | 0.131 | 0.000 | -0.1% | 9.66e-01 |
| 8 | Intelligence | PRS_and_GeRS | All | PRS | 0.095 | 0.090 | 0.006 | 5.9% | 8.24e-04 |
| 13 | BMI | PRS_and_GeRS | All | PRS | 0.284 | 0.281 | 0.003 | 1% | 4.36e-05 |
| 18 | Height | PRS_and_GeRS | All | PRS | 0.325 | 0.322 | 0.004 | 1.2% | 6.98e-08 |
| 23 | T2D | PRS_and_GeRS | All | PRS | 0.227 | 0.218 | 0.009 | 4.1% | 1.89e-06 |
| 28 | CAD | PRS_and_GeRS | All | PRS | 0.173 | 0.170 | 0.003 | 1.6% | 2.95e-02 |
| 33 | IBD | PRS_and_GeRS | All | PRS | 0.116 | 0.127 | -0.011 | -9.6% | 6.01e-04 |
| 38 | RheuArth | PRS_and_GeRS | All | PRS | 0.168 | 0.133 | 0.035 | 20.8% | 1.69e-31 |
| 5 | Depression | PRScs_and_GeRS | All | PRS | 0.141 | 0.142 | -0.002 | -1.2% | 1.62e-01 |
| 10 | Intelligence | PRScs_and_GeRS | All | PRS | 0.102 | 0.099 | 0.002 | 2.5% | 2.82e-02 |
| 15 | BMI | PRScs_and_GeRS | All | PRS | 0.303 | 0.302 | 0.001 | 0.4% | 2.82e-02 |
| 20 | Height | PRScs_and_GeRS | All | PRS | 0.352 | 0.351 | 0.001 | 0.3% | 2.64e-02 |
| 25 | T2D | PRScs_and_GeRS | All | PRS | 0.238 | 0.237 | 0.001 | 0.5% | 3.65e-01 |
| 30 | CAD | PRScs_and_GeRS | All | PRS | 0.187 | 0.187 | 0.000 | 0.2% | 4.62e-01 |
| 35 | IBD | PRScs_and_GeRS | All | PRS | 0.121 | 0.134 | -0.012 | -10.2% | 1.36e-05 |
| 40 | RheuArth | PRScs_and_GeRS | All | PRS | 0.163 | 0.157 | 0.007 | 4% | 5.89e-08 |
| 4 | Depression | Strat_PRS | All | strat.PRS | 0.107 | 0.109 | -0.002 | -1.4% | 4.17e-01 |
| 9 | Intelligence | Strat_PRS | All | strat.PRS | 0.086 | 0.079 | 0.007 | 7.8% | 9.51e-04 |
| 14 | BMI | Strat_PRS | All | strat.PRS | 0.251 | 0.246 | 0.004 | 1.7% | 7.12e-06 |
| 19 | Height | Strat_PRS | All | strat.PRS | 0.309 | 0.306 | 0.003 | 1.1% | 3.19e-06 |
| 24 | T2D | Strat_PRS | All | strat.PRS | 0.214 | 0.206 | 0.009 | 4.1% | 7.92e-06 |
| 29 | CAD | Strat_PRS | All | strat.PRS | 0.162 | 0.160 | 0.001 | 0.9% | 2.28e-01 |
| 34 | IBD | Strat_PRS | All | strat.PRS | 0.098 | 0.108 | -0.010 | -10.7% | 3.48e-03 |
| 39 | RheuArth | Strat_PRS | All | strat.PRS | 0.158 | 0.112 | 0.045 | 28.9% | 4.06e-34 |
| Phenotype | Test | Model 1 | Model 2 | Model 1 R | Model 2 R | R diff | R perc diff | R diff pval |
|---|---|---|---|---|---|---|---|---|
| RheuArth | PRS_and_GeRS | All | PRS | 0.168 | 0.133 | 0.035 | 20.8% | 1.69e-31 |
| RheuArth | PRS_noMHCClump_and_GeRS | All | PRS | 0.160 | 0.147 | 0.013 | 8.4% | 6.40e-11 |
| RheuArth | PRScs_and_GeRS | All | PRS | 0.163 | 0.157 | 0.007 | 4% | 5.89e-08 |
Show summary of GeRS PP4 tests
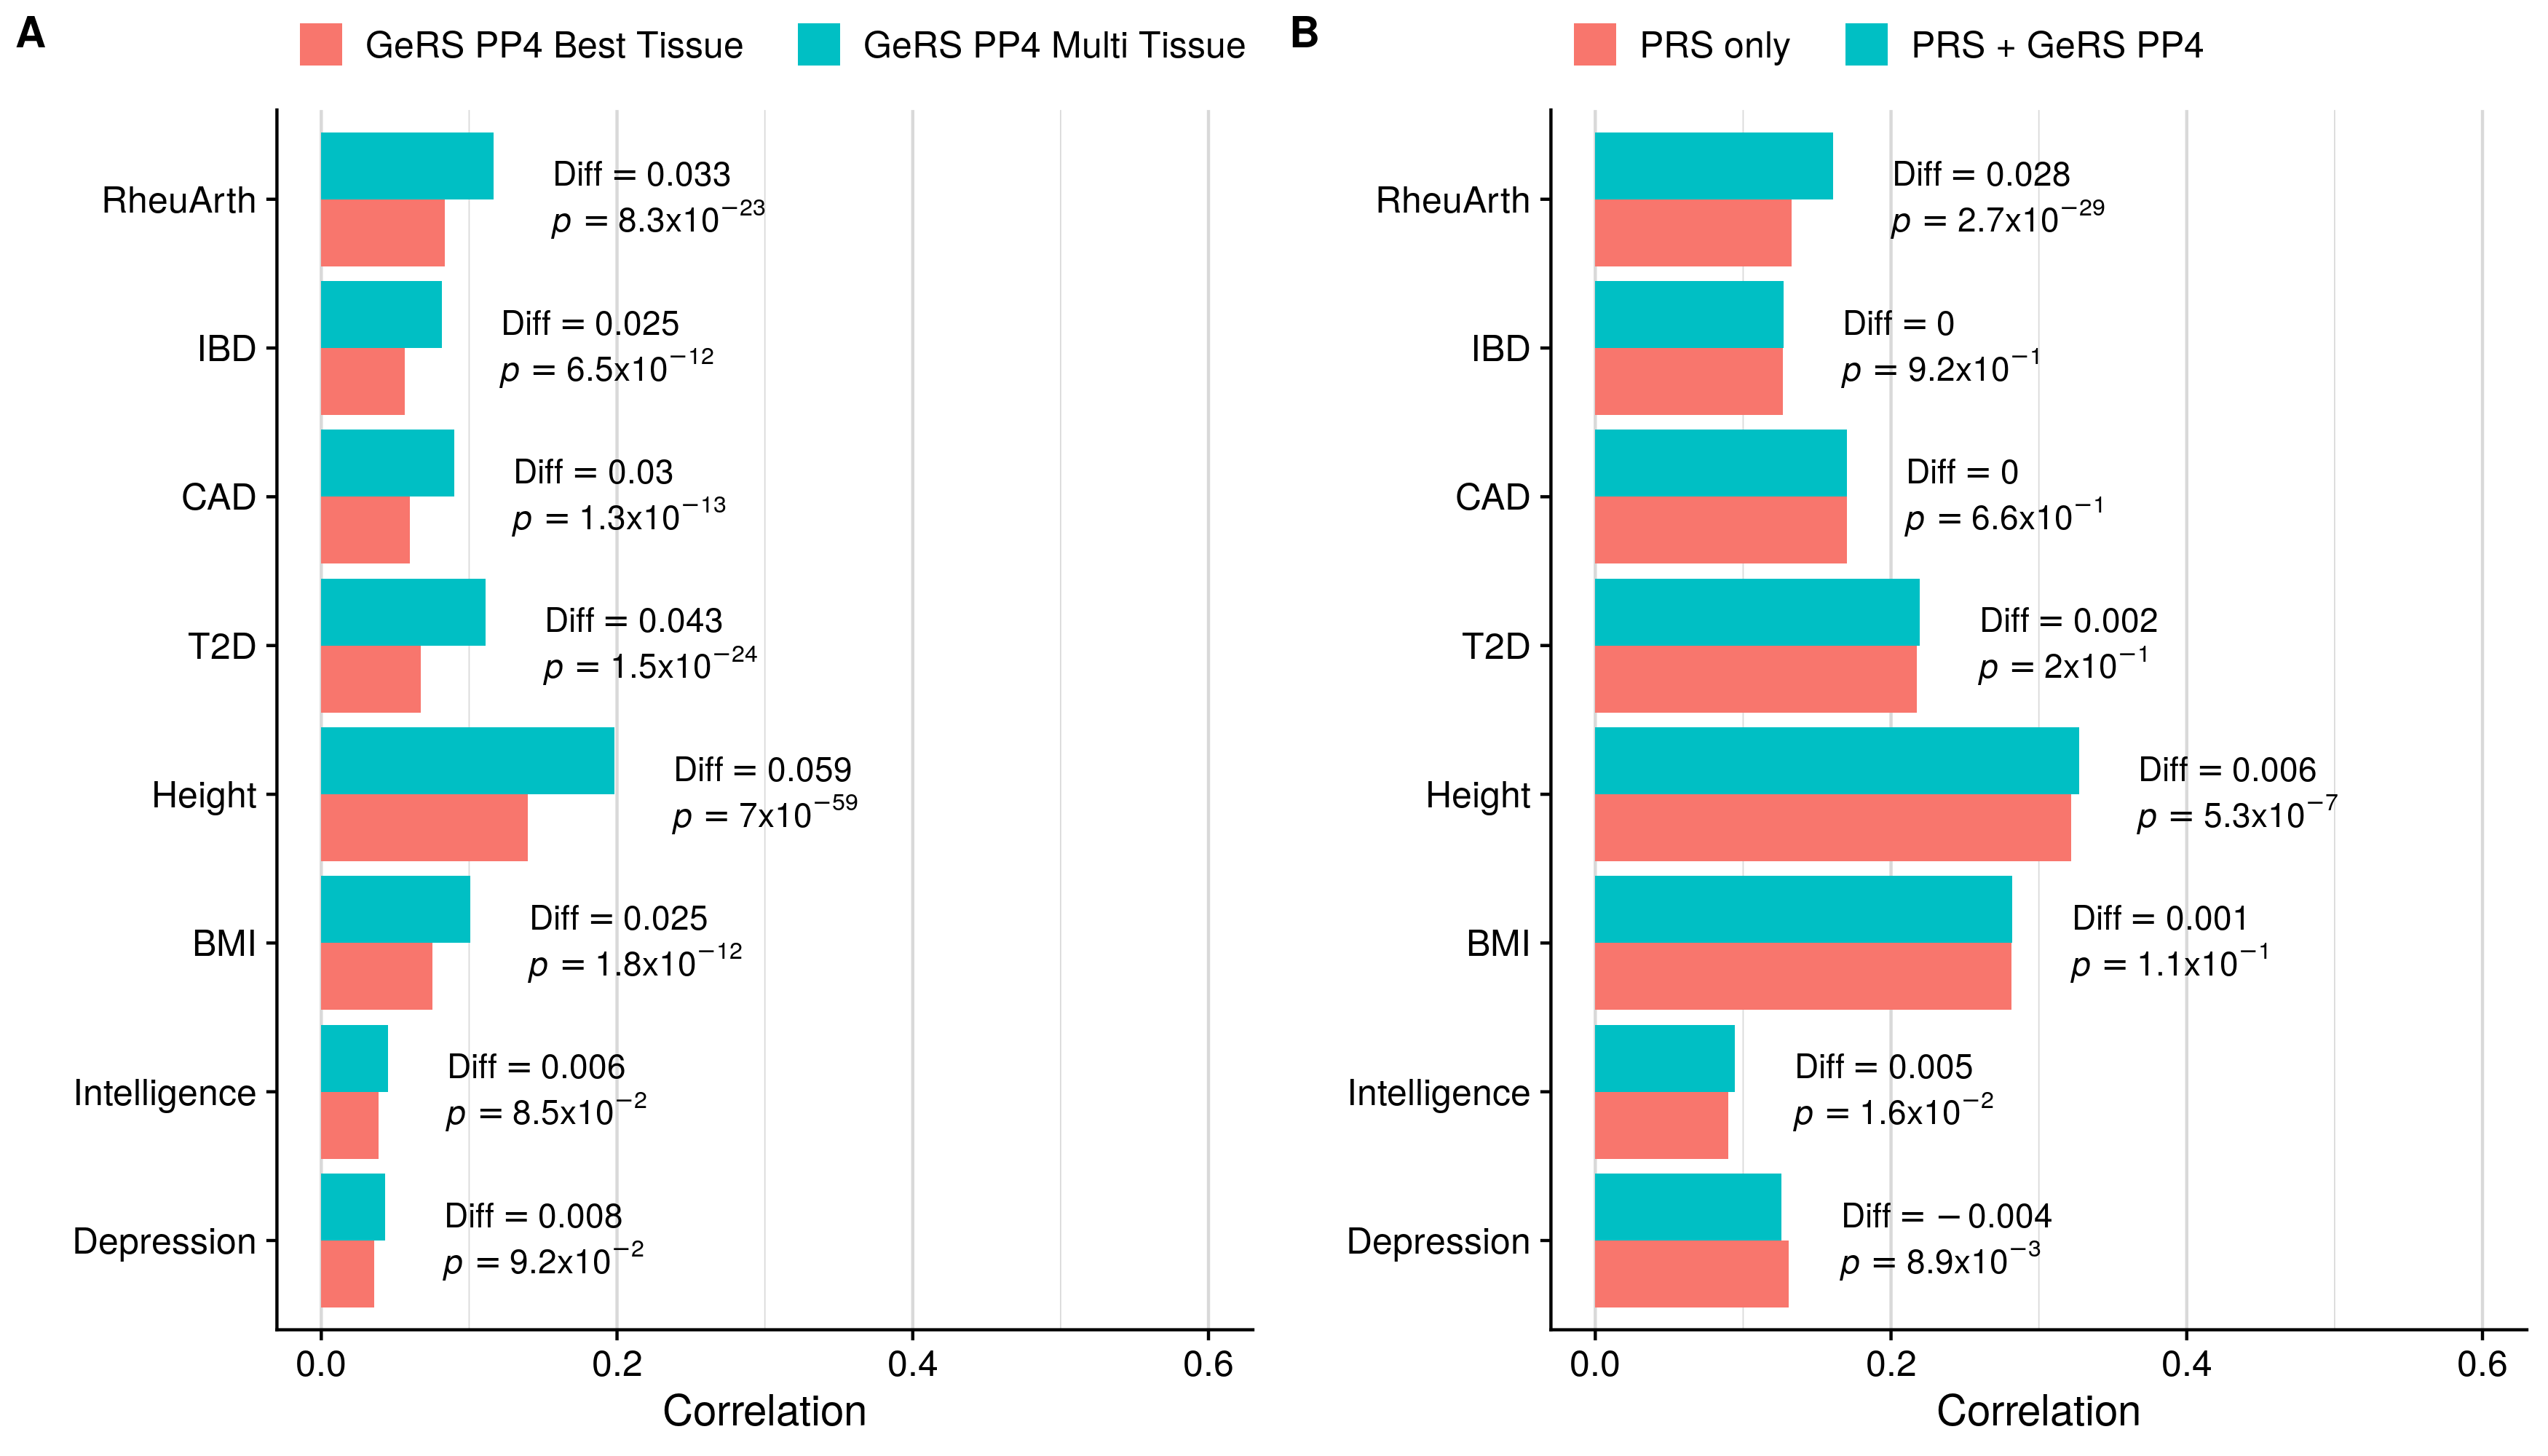
Predictive utility
| FALSE | Phenotype | Test | Model 1 | Model 2 | Model 1 R | Model 2 R | R diff | R diff pval |
|---|---|---|---|---|---|---|---|---|
| 1 | Depression | GeRS_multi_tissue | All | Thyroid | 0.043 | 0.036 | 0.008 | 9.16e-02 |
| 3 | Intelligence | GeRS_multi_tissue | All | Stomach | 0.045 | 0.039 | 0.006 | 8.54e-02 |
| 5 | BMI | GeRS_multi_tissue | All | CMC.BRAIN.RNASEQ | 0.101 | 0.075 | 0.025 | 1.82e-12 |
| 7 | Height | GeRS_multi_tissue | All | CMC.BRAIN.RNASEQ | 0.198 | 0.140 | 0.059 | 6.97e-59 |
| 9 | T2D | GeRS_multi_tissue | All | Adipose.Subcutaneous | 0.111 | 0.068 | 0.043 | 1.50e-24 |
| 11 | CAD | GeRS_multi_tissue | All | Nerve.Tibial | 0.090 | 0.060 | 0.030 | 1.33e-13 |
| 13 | IBD | GeRS_multi_tissue | All | Whole.Blood | 0.082 | 0.057 | 0.025 | 6.46e-12 |
| 15 | RheuArth | GeRS_multi_tissue | All | Brain.Cortex | 0.117 | 0.083 | 0.033 | 8.28e-23 |
| 2 | Depression | PRS_and_GeRS | All | PRS | 0.126 | 0.131 | -0.004 | 8.88e-03 |
| 4 | Intelligence | PRS_and_GeRS | All | PRS | 0.095 | 0.090 | 0.005 | 1.56e-02 |
| 6 | BMI | PRS_and_GeRS | All | PRS | 0.282 | 0.281 | 0.001 | 1.10e-01 |
| 8 | Height | PRS_and_GeRS | All | PRS | 0.327 | 0.322 | 0.006 | 5.31e-07 |
| 10 | T2D | PRS_and_GeRS | All | PRS | 0.220 | 0.218 | 0.002 | 2.02e-01 |
| 12 | CAD | PRS_and_GeRS | All | PRS | 0.170 | 0.170 | 0.000 | 6.58e-01 |
| 14 | IBD | PRS_and_GeRS | All | PRS | 0.127 | 0.127 | 0.000 | 9.24e-01 |
| 16 | RheuArth | PRS_and_GeRS | All | PRS | 0.161 | 0.133 | 0.028 | 2.70e-29 |
Show summary of GeRS TissueSpecific tests
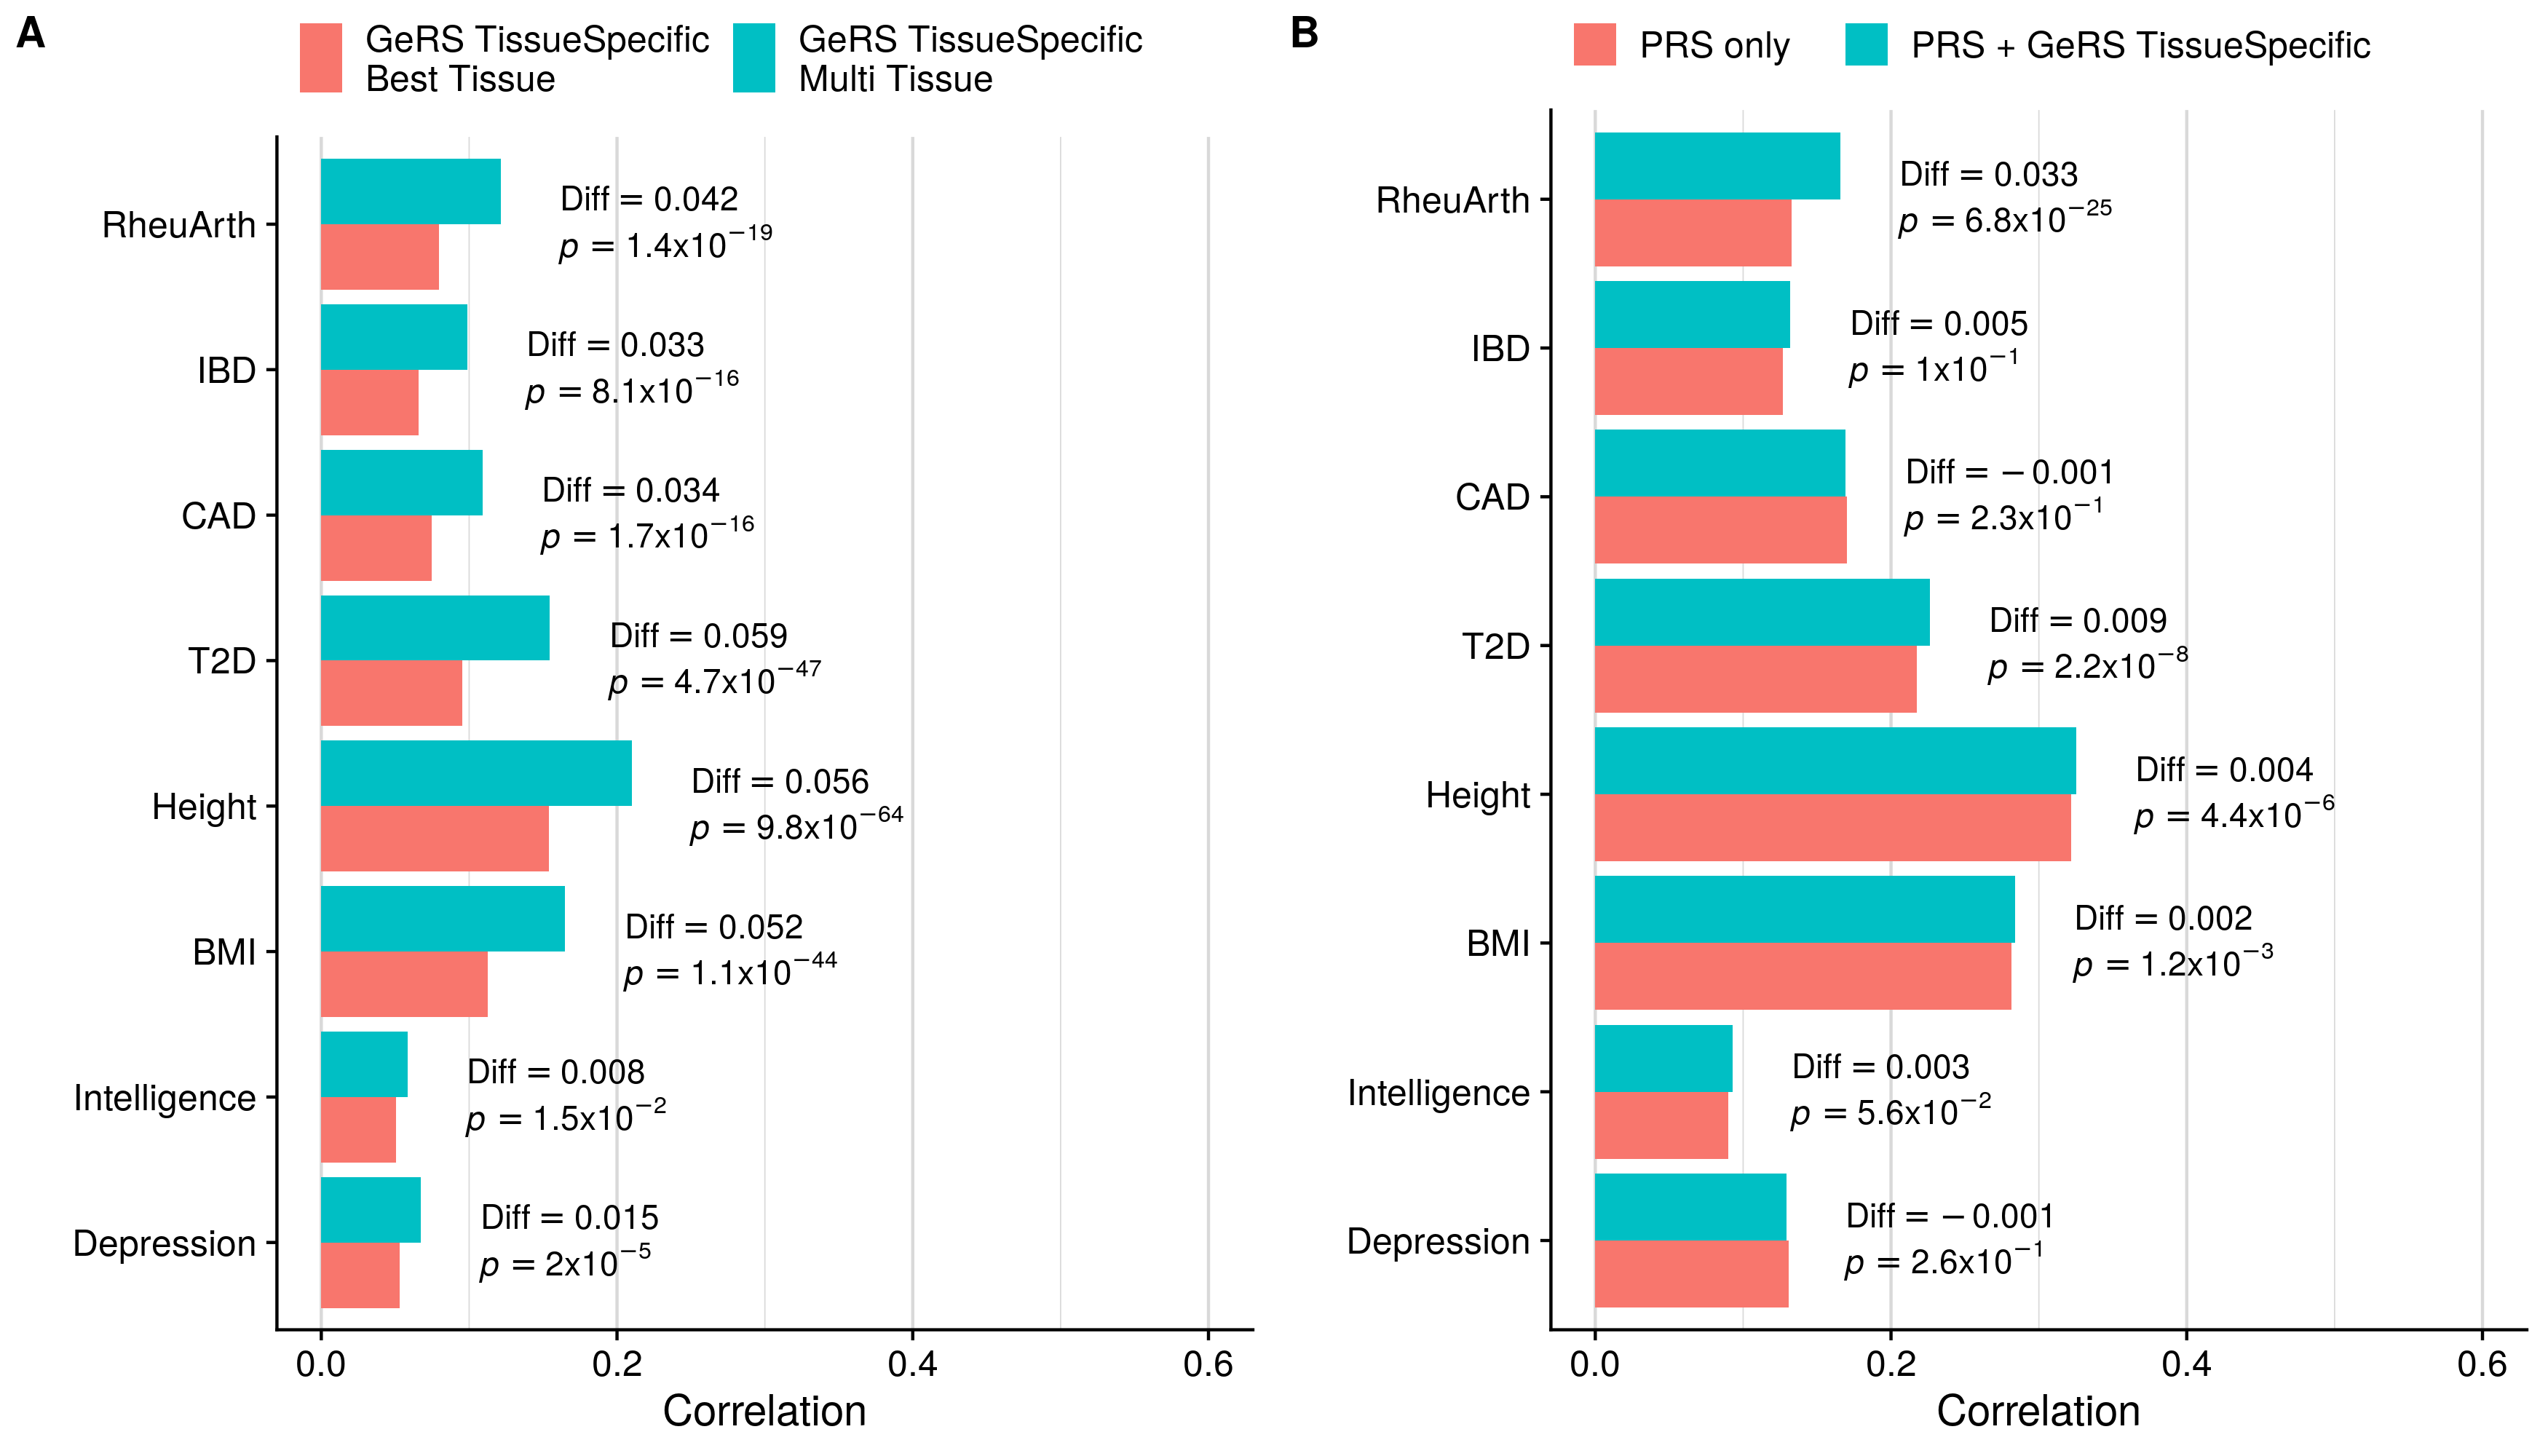
Predictive utility
| FALSE | Phenotype | Test | Model 1 | Model 2 | Model 1 R | Model 2 R | R diff | R diff pval |
|---|---|---|---|---|---|---|---|---|
| 1 | Depression | GeRS_multi_tissue | All | Thyroid | 0.067 | 0.053 | 0.015 | 1.97e-05 |
| 3 | Intelligence | GeRS_multi_tissue | All | CMC.BRAIN.RNASEQ | 0.058 | 0.050 | 0.008 | 1.49e-02 |
| 5 | BMI | GeRS_multi_tissue | All | CMC.BRAIN.RNASEQ | 0.165 | 0.113 | 0.052 | 1.12e-44 |
| 7 | Height | GeRS_multi_tissue | All | Nerve.Tibial | 0.210 | 0.154 | 0.056 | 9.83e-64 |
| 9 | T2D | GeRS_multi_tissue | All | Artery.Tibial | 0.155 | 0.095 | 0.059 | 4.68e-47 |
| 11 | CAD | GeRS_multi_tissue | All | Artery.Tibial | 0.109 | 0.075 | 0.034 | 1.70e-16 |
| 13 | IBD | GeRS_multi_tissue | All | Whole.Blood | 0.099 | 0.066 | 0.033 | 8.13e-16 |
| 15 | RheuArth | GeRS_multi_tissue | All | YFS.BLOOD.RNAARR | 0.121 | 0.080 | 0.042 | 1.40e-19 |
| 2 | Depression | PRS_and_GeRS | All | PRS | 0.129 | 0.131 | -0.001 | 2.64e-01 |
| 4 | Intelligence | PRS_and_GeRS | All | PRS | 0.093 | 0.090 | 0.003 | 5.59e-02 |
| 6 | BMI | PRS_and_GeRS | All | PRS | 0.284 | 0.281 | 0.002 | 1.24e-03 |
| 8 | Height | PRS_and_GeRS | All | PRS | 0.325 | 0.322 | 0.004 | 4.41e-06 |
| 10 | T2D | PRS_and_GeRS | All | PRS | 0.226 | 0.218 | 0.009 | 2.15e-08 |
| 12 | CAD | PRS_and_GeRS | All | PRS | 0.169 | 0.170 | -0.001 | 2.26e-01 |
| 14 | IBD | PRS_and_GeRS | All | PRS | 0.132 | 0.127 | 0.005 | 1.04e-01 |
| 16 | RheuArth | PRS_and_GeRS | All | PRS | 0.166 | 0.133 | 0.033 | 6.75e-25 |
Show GeRS, PRS, stratified-PRS comparison
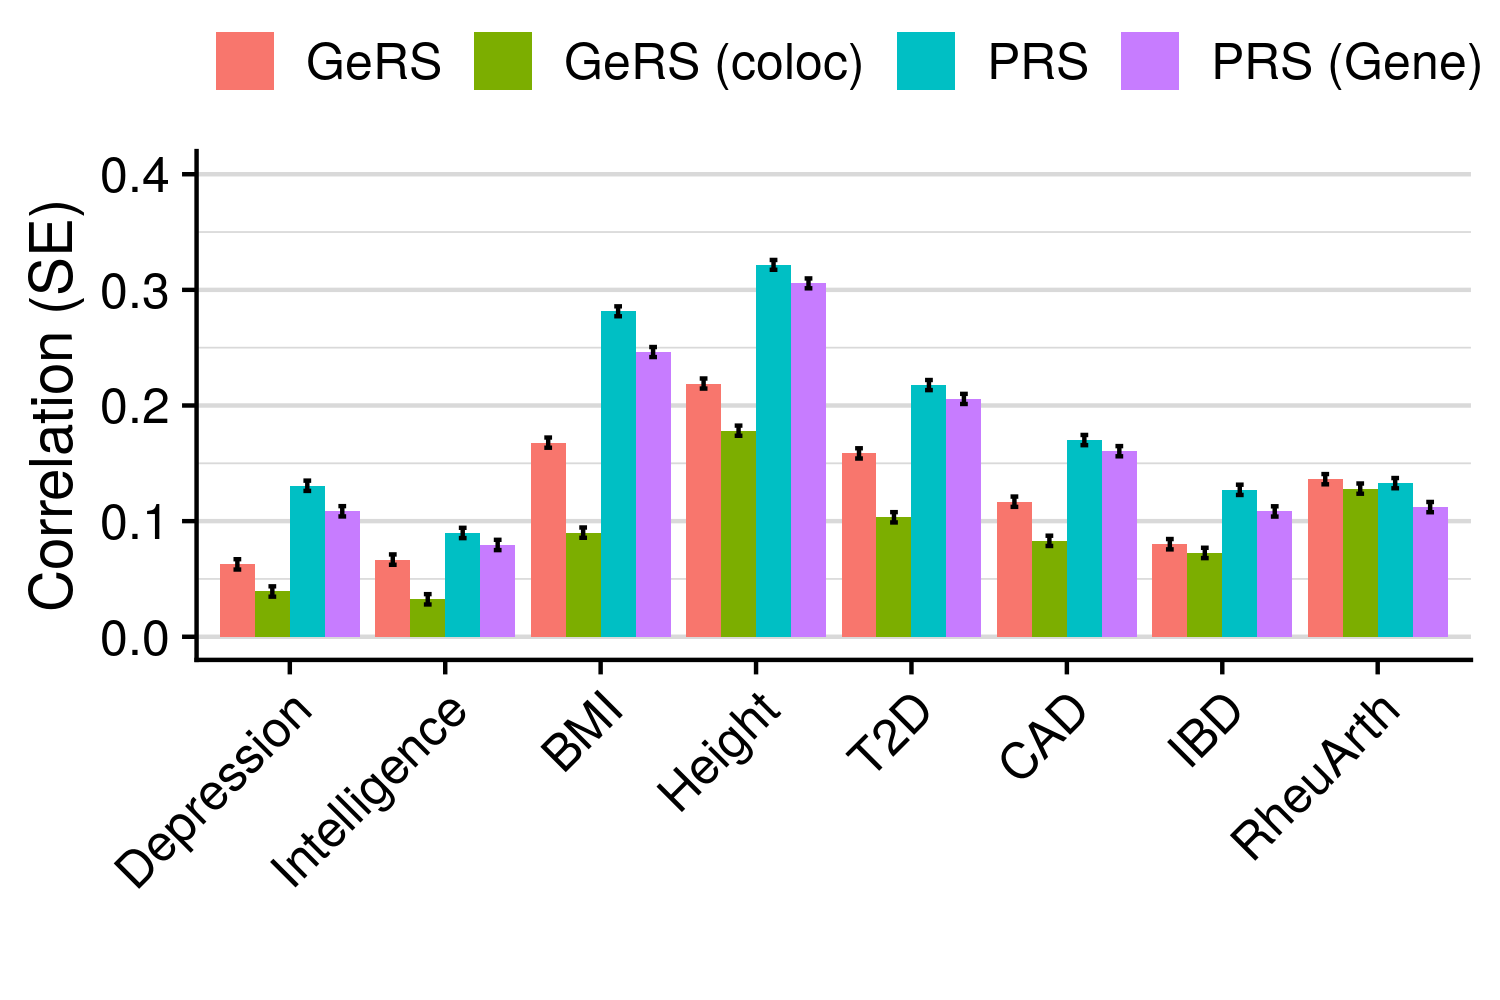
Predictive utility
| Phenotype | Prop_GE | Prop_GE_coloc |
|---|---|---|
| Depression | 0.479 | 0.300 |
| Intelligence | 0.743 | 0.361 |
| BMI | 0.596 | 0.320 |
| Height | 0.681 | 0.554 |
| T2D | 0.729 | 0.475 |
| CAD | 0.687 | 0.488 |
| IBD | 0.630 | 0.571 |
| RheuArth | 1.026 | 0.964 |
Show GeRS coloc and tissue specific comparison
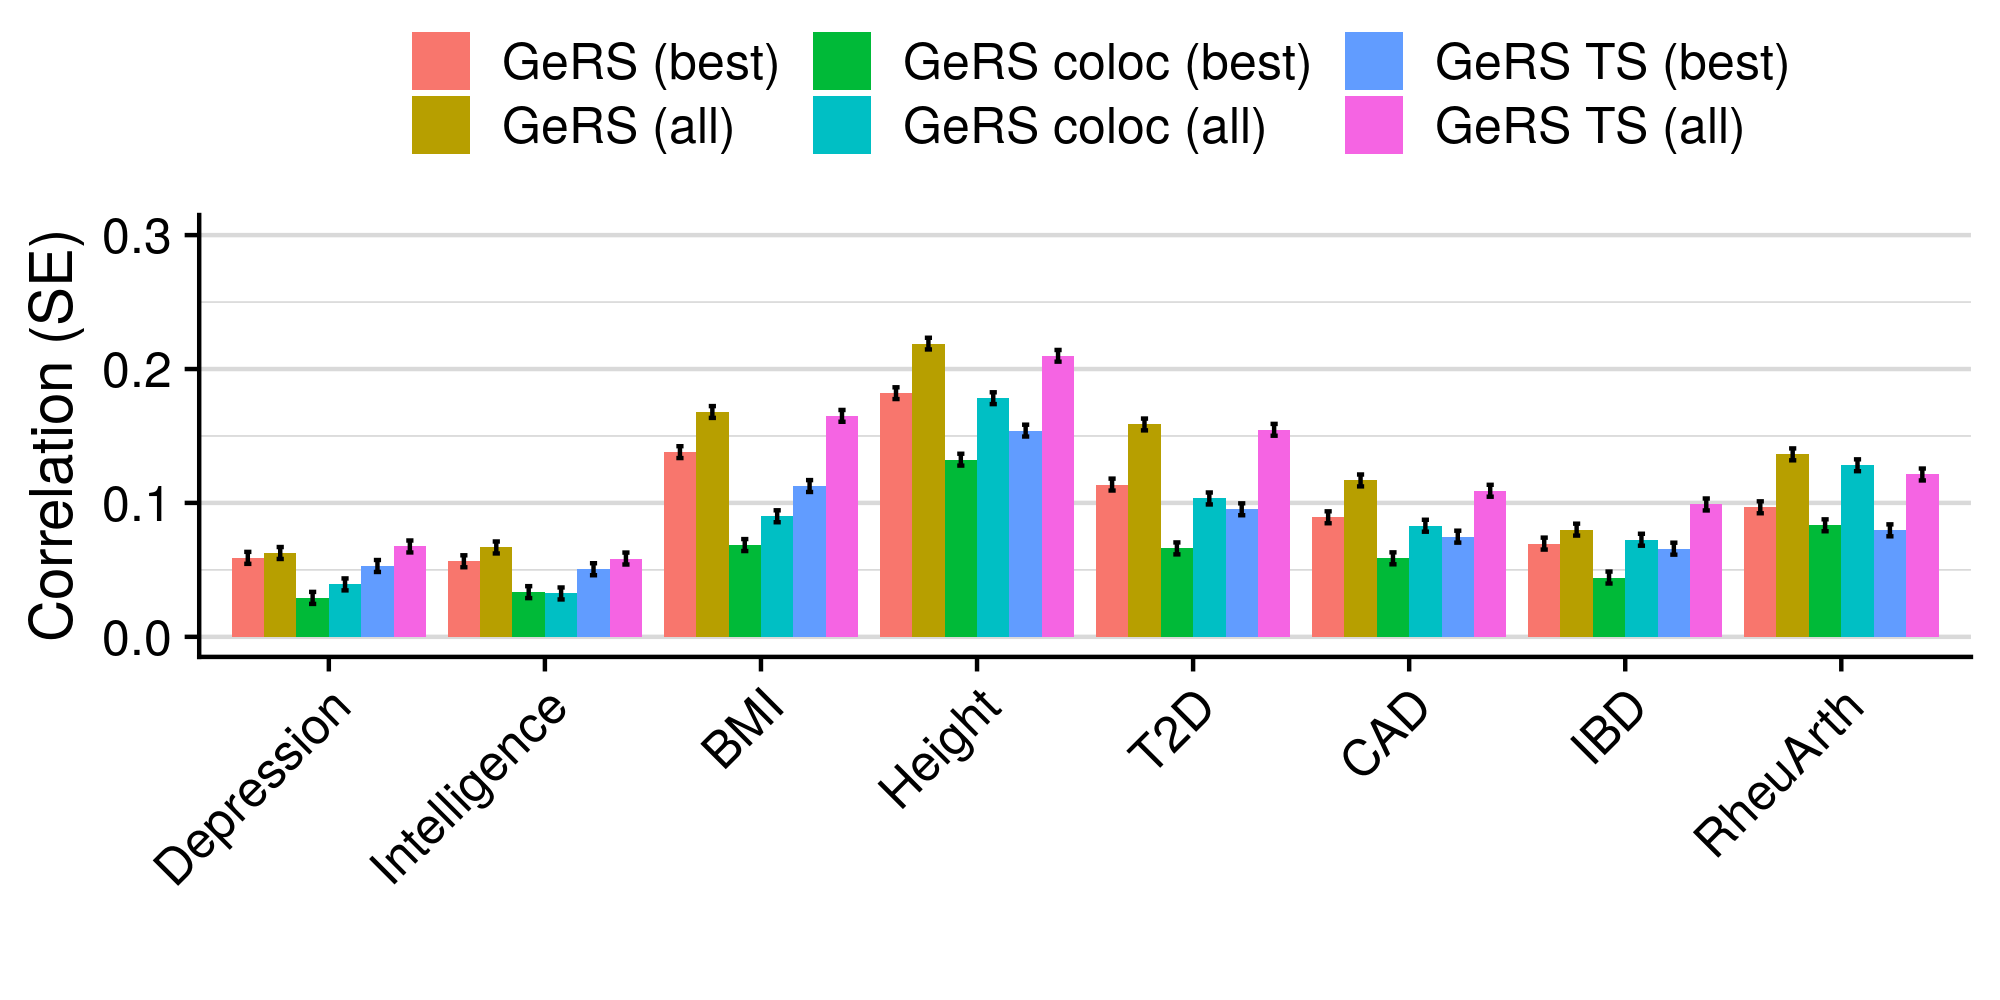
Predictive utility
| Phenotype | Method | R | SE |
|---|---|---|---|
| Depression | GeRS (best) | 0.059 | 0.004 |
| Depression | GeRS (all) | 0.063 | 0.004 |
| Depression | GeRS coloc (best) | 0.029 | 0.004 |
| Depression | GeRS coloc (all) | 0.039 | 0.004 |
| Depression | GeRS TS (best) | 0.053 | 0.004 |
| Depression | GeRS TS (all) | 0.067 | 0.004 |
| Intelligence | GeRS (best) | 0.056 | 0.004 |
| Intelligence | GeRS (all) | 0.067 | 0.004 |
| Intelligence | GeRS coloc (best) | 0.033 | 0.004 |
| Intelligence | GeRS coloc (all) | 0.032 | 0.004 |
| Intelligence | GeRS TS (best) | 0.050 | 0.004 |
| Intelligence | GeRS TS (all) | 0.058 | 0.004 |
| BMI | GeRS (best) | 0.138 | 0.004 |
| BMI | GeRS (all) | 0.168 | 0.004 |
| BMI | GeRS coloc (best) | 0.069 | 0.004 |
| BMI | GeRS coloc (all) | 0.090 | 0.004 |
| BMI | GeRS TS (best) | 0.113 | 0.004 |
| BMI | GeRS TS (all) | 0.165 | 0.004 |
| Height | GeRS (best) | 0.182 | 0.004 |
| Height | GeRS (all) | 0.219 | 0.004 |
| Height | GeRS coloc (best) | 0.132 | 0.004 |
| Height | GeRS coloc (all) | 0.178 | 0.004 |
| Height | GeRS TS (best) | 0.154 | 0.004 |
| Height | GeRS TS (all) | 0.210 | 0.004 |
| T2D | GeRS (best) | 0.114 | 0.004 |
| T2D | GeRS (all) | 0.159 | 0.004 |
| T2D | GeRS coloc (best) | 0.066 | 0.004 |
| T2D | GeRS coloc (all) | 0.103 | 0.004 |
| T2D | GeRS TS (best) | 0.095 | 0.004 |
| T2D | GeRS TS (all) | 0.155 | 0.004 |
| CAD | GeRS (best) | 0.089 | 0.004 |
| CAD | GeRS (all) | 0.117 | 0.004 |
| CAD | GeRS coloc (best) | 0.059 | 0.004 |
| CAD | GeRS coloc (all) | 0.083 | 0.004 |
| CAD | GeRS TS (best) | 0.075 | 0.004 |
| CAD | GeRS TS (all) | 0.109 | 0.004 |
| IBD | GeRS (best) | 0.070 | 0.004 |
| IBD | GeRS (all) | 0.080 | 0.004 |
| IBD | GeRS coloc (best) | 0.044 | 0.004 |
| IBD | GeRS coloc (all) | 0.073 | 0.004 |
| IBD | GeRS TS (best) | 0.066 | 0.004 |
| IBD | GeRS TS (all) | 0.099 | 0.004 |
| RheuArth | GeRS (best) | 0.097 | 0.004 |
| RheuArth | GeRS (all) | 0.136 | 0.004 |
| RheuArth | GeRS coloc (best) | 0.083 | 0.004 |
| RheuArth | GeRS coloc (all) | 0.128 | 0.004 |
| RheuArth | GeRS TS (best) | 0.080 | 0.004 |
| RheuArth | GeRS TS (all) | 0.121 | 0.004 |
Show association with GeRS for each SNP-weight set
Predictive utility
Show association with GeRS PP4 for each SNP-weight set
Predictive utility
Show association with GeRS TissueSpecific for each SNP-weight set
Predictive utility
Show association with GeRS for each SNP-weight set after accounting for number of features
Predictive utility
Show effect of number of features in the SNP-weight set
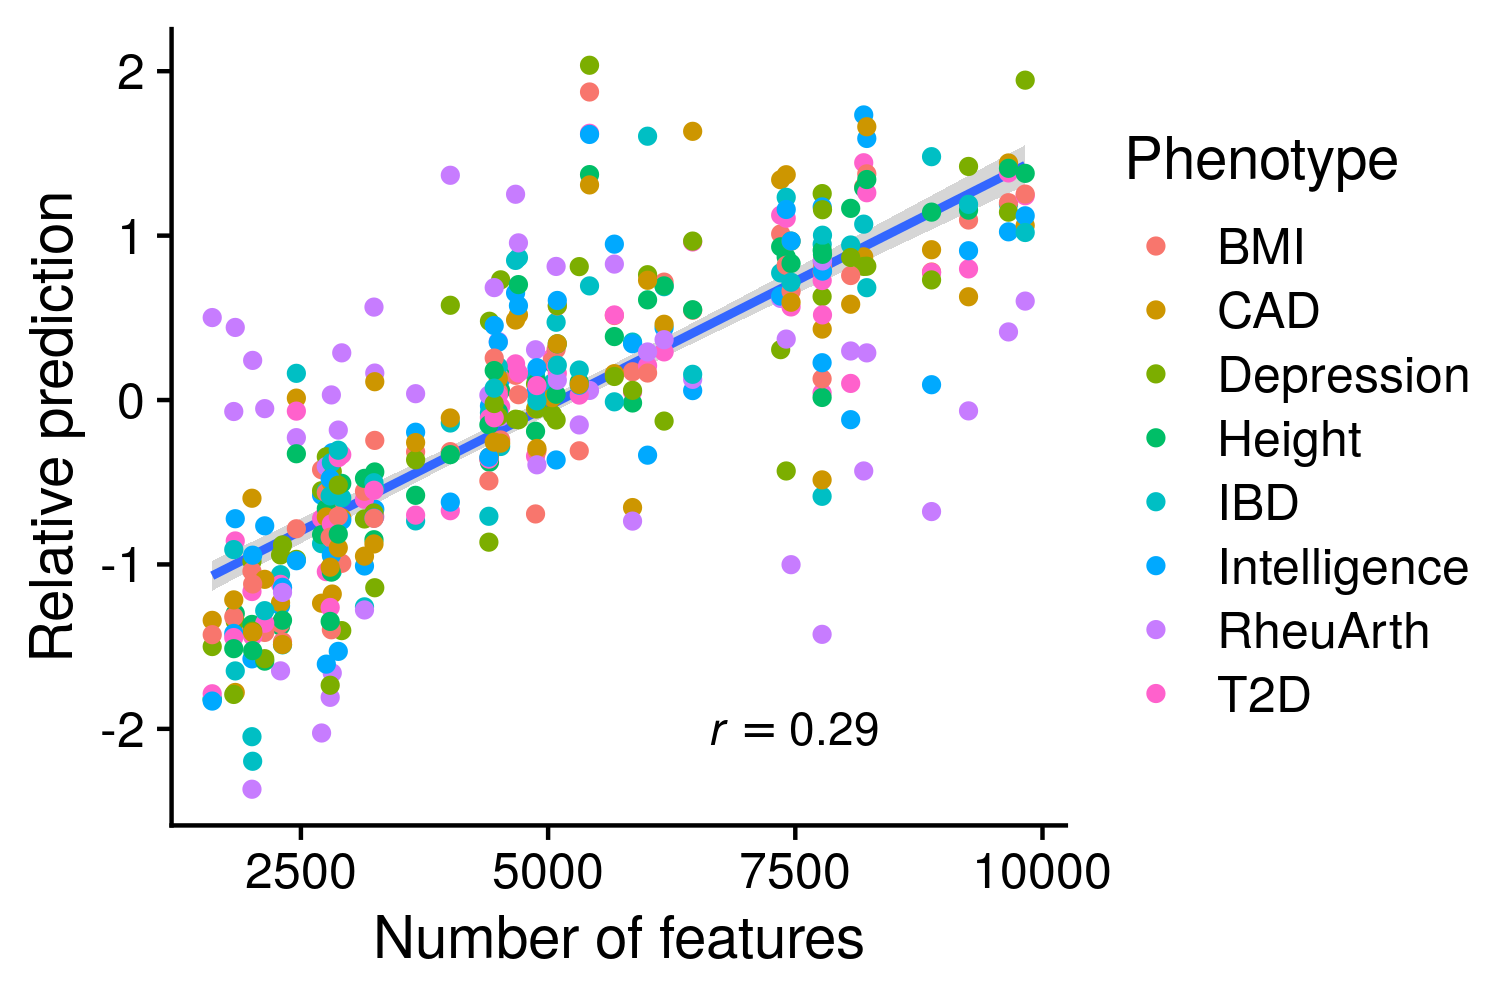
Number of feature effect
4.2 TEDS
Plot per pT GeRS results
#####
# Compare results across pTs for each phenotype
#####
pheno<-c('Height21', 'BMI21', 'GCSE', 'ADHD')
pheno_label<-c('Height', 'BMI', 'GCSE', 'ADHD')
gwas<-c('HEIG03', 'BODY11', 'EDUC03', 'ADHD04')
weights=read.table('/users/k1806347/brc_scratch/Data/TWAS_sumstats/FUSION/snp_weight_list.txt', header=F)$V1

weights_clean<-gsub('_',' ',weights)
weights_clean<-gsub('CMC.BRAIN.RNASEQ','CMC DLPFC',weights_clean)
weights_clean<-gsub('SPLICING','Splicing',weights_clean)
weights_clean<-gsub('NTR.BLOOD.RNAARR','NTR Blood',weights_clean)
weights_clean<-gsub('YFS.BLOOD.RNAARR','YFS Blood',weights_clean)
weights_clean<-gsub('METSIM.ADIPOSE.RNASEQ','METSIM Adipose',weights_clean)
weights_clean[!grepl('CMC|NTR|YFS|METSIM', weights)]<-paste0('GTEx ',weights_clean[!grepl('CMC|NTR|YFS|METSIM', weights)])
#to add gtex to each of the snp weights which don't have CMC NTR or YFS in front
weights_clean<-gsub('Brain', '', weights_clean)
weights_clean <- gsub('Anterior cingulate cortex', 'ACC', weights_clean)
weights_clean <- gsub('basal ganglia', '', weights_clean)
weights_clean <- gsub('BA9', '', weights_clean)
weights_clean <- gsub('BA24', '', weights_clean)
weights_clean <- gsub('  ', ' ', weights_clean)
weights_clean_short<-substr(weights_clean, start = 1, stop = 15)  #start the name at the first character and stop at the 25th
weights_clean_short[nchar(weights_clean) > 15]<-paste0(weights_clean_short[nchar(weights_clean) > 15], "...")

res<-NULL
res_best<-NULL
for(i in 1:length(gwas)){
  for(weight in 1:length(weights)){
    res_i<-read.table(paste0('/users/k1806347/brc_scratch/Analyses/GeRS_comparison/TEDS_outcomes_for_prediction/',pheno[i],'/Association_withGeRSs/TEDS.w_hm3.',weights[weight],'.',gwas[i],'.EUR-GeRSs.pred_eval.txt'), header=T, stringsAsFactors=F)

    res_i$Phenotype<-pheno[i]
    res_i$Weight<-weights[weight]

    if(sum(grepl('R2l',names(res_i)))>0){
        res_i<-res_i[,c('Phenotype','Weight','Model','R','SE','P','R2l')]
        names(res_i)<-c('Phenotype','Weight','Model','R','SE','P','R2')
        res_i$Binary<-T
    } else {
        res_i<-res_i[,c('Phenotype','Weight','Model','R','SE','P','R2o')]
        names(res_i)<-c('Phenotype','Weight','Model','R','SE','P','R2')
        res_i$Binary<-F
    }

    res_i$Model<-gsub('_group','',gsub(paste0(gwas[i],'.'),'',res_i$Model))
    res_i$Model<-factor(res_i$Model, levels=res_i$Model)

    res_i_best<-res_i[res_i$R == max(res_i$R),]

    res<-rbind(res, res_i)
    res_best<-rbind(res_best, res_i_best)
  }
}

res_brief<-res[,c('Phenotype','Weight','Model','R','SE','P')]
res_best_brief<-res_best[,c('Phenotype','Weight','Model','R','SE','P')]

write.csv(res_brief, '/mnt/lustre/users/k1806347/Analyses/GeRS_comparison/TEDS_outcomes_for_prediction/GeRS_per_pT.csv', row.names=F, quote=F)
write.csv(res_best_brief, '/mnt/lustre/users/k1806347/Analyses/GeRS_comparison/TEDS_outcomes_for_prediction/GeRS_best_pT.csv', row.names=F, quote=F)

library(ggplot2)
library(cowplot)

res$Model<-gsub('e.0','*x*10^-', res$Model)
res$Model<-factor(res$Model, levels=unique(res$Model))
res$P<-format(res$P, scientific = TRUE, digits = 1)
res$P<-gsub('e-','*x*10^-',res$P)

res_plot<-list()
for(i in 1:length(gwas)){
  # Extract result for 5 most predictive tissue
  tmp<-res_best[res_best$Phenotype == pheno[i],]
  tmp<-tmp[order(-tmp$R2),]
  tmp<-tmp[1:3,]
  best_weights<-tmp$Weight

  res_tmp<-res[res$Phenotype == pheno[i] & (res$Weight %in% best_weights),]
  ylim_max<-max(res_tmp$R2)
  ylim_max<-ylim_max+ylim_max/1.5
  if(res[res$Phenotype == pheno[i],]$Binary[1] == T){
    ylab<-'Liability R-squared'
  } else {
    ylab<-'R-squared'
  }

  res_plot_tmp<-list()
  for(weight in best_weights){
    weights_index<-which(weights == weight)
    print(weight)
  res_plot_tmp[[as.character(weights[weights_index])]]<-ggplot(res[res$Phenotype == pheno[i] & res$Weight == weights[weights_index],], aes(x=Model, y=R2)) +
                                    geom_bar(stat="identity", position=position_dodge(), fill='#3399FF') +
                                    labs(y=ylab, x='pT', title=paste0('\n\n',weights_clean_short[weights_index])) +
                                    theme_half_open() +
                                    ylim(0,ylim_max) +
                                    geom_text(data=res[res$Phenotype == pheno[i] & res$Weight == weights[weights_index],], aes(x=Model, y=R2, label=P), vjust=0.5, hjust= -0.15, angle=90, size=4, parse=T) +
                                    theme(axis.text.x = element_text(angle = 55, vjust = 1, hjust=1), plot.title = element_text(hjust = 0.5, size=12)) +
                                    background_grid(major = 'y', minor = 'y') +
                                    scale_x_discrete(labels = parse(text = as.character(res[res$Phenotype == pheno[i] & res$Weight == weights[weights_index],]$Model))) +
                                    coord_cartesian(clip='off')

  }
  res_plot[[pheno[i]]]<-plot_grid(plotlist=res_plot_tmp, nrow = 1)
}

png('/mnt/lustre/users/k1806347/Analyses/GeRS_comparison/TEDS_outcomes_for_prediction/GeRS_per_pT_TEDS.png', units='px', res=300, width=3000, height=3750)
  plot_grid(plotlist=res_plot, ncol = 1, labels = paste0(pheno_label))
dev.off()

#######
# Recreate plots using R on the y axis and full SNP-weight set names
#######

res_plot<-list()
for(i in 1:length(gwas)){
  # Extract result for 5 most predictive tissue
  tmp<-res_best[res_best$Phenotype == pheno[i],]
  tmp<-tmp[order(-tmp$R),]
  tmp<-tmp[1:3,]
  best_weights<-tmp$Weight

  res_tmp<-res[res$Phenotype == pheno[i] & (res$Weight %in% best_weights),]
  ylim_max<-max(res_tmp$R)
  ylim_max<-ylim_max+ylim_max*1.5
  if(min(res_tmp$R) < 0){
    ylim_min<-min(res_tmp$R)
    ylim_min<-ylim_min-max(res_tmp$SE)
  } else {
    ylim_min<-NA
  }

  res_plot_tmp<-list()
  for(weight in best_weights){
    weights_index<-which(weights == weight)
    print(weight)
  res_plot_tmp[[as.character(weights[weights_index])]]<-ggplot(res[res$Phenotype == pheno[i] & res$Weight == weights[weights_index],], aes(x=Model, y=R)) +
                                    geom_bar(stat="identity", position=position_dodge(), fill='#3399FF') +
                                    geom_errorbar(aes(ymin=R-SE, ymax=R+SE), width=.2, position=position_dodge(.9)) +
                                    labs(y='Correlation', x='pT', title=paste0('\n\n',weights_clean[weights_index])) +
                                    theme_half_open() +
                                    ylim(ylim_min,ylim_max) +
                                    geom_text(data=res[res$Phenotype == pheno[i] & res$Weight == weights[weights_index],], aes(x=Model, y=R+SE, label=P), vjust=0.3, hjust= -0.15, angle=90, size=4, parse=T) +
                                    theme(axis.text.x = element_text(angle = 55, vjust = 1, hjust=1), plot.title = element_text(hjust = 0.4, size=12)) +
                                    background_grid(major = 'y', minor = 'y') +
                                    scale_x_discrete(labels = parse(text = as.character(res[res$Phenotype == pheno[i] & res$Weight == weights[weights_index],]$Model))) +
                                    coord_cartesian(clip='off')

  }
  res_plot[[pheno[i]]]<-plot_grid(plotlist=res_plot_tmp, nrow = 1)
}

png('/mnt/lustre/users/k1806347/Analyses/GeRS_comparison/TEDS_outcomes_for_prediction/GeRS_per_pT_TEDS_R.png', units='px', res=300, width=3000, height=3750)
  plot_grid(plotlist=res_plot, ncol = 1, labels = paste0(pheno_label))
dev.off()
Plot comparison results
#####
# Compare results from each approach
#####
pheno<-c('Height21', 'BMI21', 'GCSE', 'ADHD')
pheno_label<-c('Height', 'BMI', 'GCSE', 'ADHD')
gwas<-c('HEIG03', 'BODY11', 'EDUC03', 'ADHD04')

res<-list()
for(i in 1:length(gwas)){
res_1<-read.table(paste0('/users/k1806347/brc_scratch/Analyses/GeRS_comparison/TEDS_outcomes_for_prediction/',pheno[i],'/Association_withGeRSs/TEDS.w_hm3.AllTissue.',gwas[i],'.EUR-GeRSs.per_PT.pred_comp.txt'), header=T, stringsAsFactors=F)
res_1<-res_1[res_1$Model_1 == 'All',]
res_1<-res_1[res_1$Model_2 != 'All',]
res_2<-read.table(paste0('/users/k1806347/brc_scratch/Analyses/GeRS_comparison/TEDS_outcomes_for_prediction/',pheno[i],'/Association_withGeRSs/TEDS.w_hm3.AllTissue.',gwas[i],'.EUR-GeRSs.pred_comp.txt'), header=T, stringsAsFactors=F)
res_2<-res_2[res_2$Model_1 == 'All',]
res_2<-res_2[res_2$Model_2 != 'All',]
res_3<-read.table(paste0('/users/k1806347/brc_scratch/Analyses/GeRS_comparison/TEDS_outcomes_for_prediction/',pheno[i],'/Association_withPRS_and_GeRSs/TEDS.w_hm3.AllTissue.',gwas[i],'.EUR-GeRSs.EUR-PRSs.pt_clump.pred_comp.txt'), header=T, stringsAsFactors=F)
res_4<-read.table(paste0('/users/k1806347/brc_scratch/Analyses/GeRS_comparison/TEDS_outcomes_for_prediction/',pheno[i],'/Association_withPRSs/TEDS.w_hm3.',gwas[i],'.EUR-PRSs-TWAS_gene_stratified.pred_comp.txt'), header=T, stringsAsFactors=F)
res_5<-read.table(paste0('/users/k1806347/brc_scratch/Analyses/GeRS_comparison/TEDS_outcomes_for_prediction/',pheno[i],'/Association_withPRS_and_GeRSs/TEDS.w_hm3.AllTissue.',gwas[i],'.EUR-GeRSs.EUR-PRSs.PRScs.pred_comp.txt'), header=T, stringsAsFactors=F)

res[[pheno[i]]]<-data.frame(Test=c('GeRS_multi_pT','GeRS_multi_tissue','PRS_and_GeRS','Strat_PRS','PRScs_and_GeRS'),
                        do.call(rbind,list( res_1[res_1$Model_2_R == max(res_1$Model_2_R),],
                                                    res_2[res_2$Model_2_R == max(res_2$Model_2_R),],
                                                    res_3[8,],
                                                    res_4[8,],
                                                    res_5[8,])))
}

res_table<-do.call(rbind, res)

# Calculate percentage difference
res_table$R_diff_perc<-res_table$R_diff/res_table$Model_1_R*100

res_table$Phenotype<-gsub('\\..*','',rownames(res_table))
res_table<-res_table[,c('Phenotype',names(res_table)[-length(names(res_table))])]
write.csv(res_table, '/mnt/lustre/users/k1806347/Analyses/GeRS_comparison/TEDS_outcomes_for_prediction/GeRS_tests_summary.csv', row.names=F, quote=F)

####
# Plot the R2 when using PRS only, and using PRS + multi-tissue GeRS
####

# Organise the results
res_plot<-list()
for(i in 1:length(gwas)){
  tmp_res<-res[[pheno[i]]]

  tmp_res$R_diff_pval_num<-tmp_res$R_diff_pval

  tmp_res$R_diff_pval<-format(tmp_res$R_diff_pval, scientific = TRUE, digits = 2)
  tmp_res$R_diff_pval<-gsub('e-','*x*10^-',tmp_res$R_diff_pval)

  tmp_res_Model_1<-tmp_res[,grepl('Test|Model_1|R_diff',names(tmp_res))]
  names(tmp_res_Model_1)<-c('Test','Model','R','R_diff','R_diff_pval','R_diff_pval_num')
  tmp_res_Model_2<-tmp_res[,grepl('Test|Model_2|R_diff',names(tmp_res))]
  names(tmp_res_Model_2)<-c('Test','Model','R','R_diff','R_diff_pval','R_diff_pval_num')
  tmp_res_Model_2$R_diff<-NA
  tmp_res_Model_2$R_diff_pval<-NA

  tmp_res_plot<-rbind(tmp_res_Model_1,tmp_res_Model_2)
  tmp_res_plot$Phenotype<-pheno_label[i]

  res_plot[[pheno[i]]]<-tmp_res_plot
}

# Combine results for each phenotype and prepare for plotting
All_res_plot<-do.call(rbind, res_plot)

All_res_plot$Test<-factor(All_res_plot$Test, levels=res[[1]]$Test)
All_res_plot$Phenotype<-factor(All_res_plot$Phenotype, level=unique(All_res_plot$Phenotype))
All_res_plot<-All_res_plot[order(All_res_plot$Phenotype,All_res_plot$Test),]

All_res_plot$Val_Label_1<-NA
All_res_plot$Val_Label_1[!is.na(All_res_plot$R_diff)]<-paste0('Diff == ',round(All_res_plot$R_diff[!is.na(All_res_plot$R_diff)],3))

All_res_plot$Val_Label_2<-NA
All_res_plot$Val_Label_2[!is.na(All_res_plot$R_diff)]<-paste0('italic(p) == ',All_res_plot$R_diff_pval[!is.na(All_res_plot$R_diff)])

All_res_plot$Model[!All_res_plot$Model == 'All' & All_res_plot$Test == 'GeRS_multi_pT']<-'GeRS Best pT   '
All_res_plot$Model[All_res_plot$Model == 'All' & All_res_plot$Test == 'GeRS_multi_pT']<-'GeRS Multi pT'

All_res_plot$Model[!All_res_plot$Model == 'All' & All_res_plot$Test == 'GeRS_multi_tissue']<-'GeRS Best Tissue   '
All_res_plot$Model[All_res_plot$Model == 'All' & All_res_plot$Test == 'GeRS_multi_tissue']<-'GeRS Multi Tissue'

All_res_plot$Model[!All_res_plot$Model == 'All' & All_res_plot$Test == 'PRS_and_GeRS']<-'PRS only   '
All_res_plot$Model[All_res_plot$Model == 'All' & All_res_plot$Test == 'PRS_and_GeRS']<-'PRS + GeRS'

All_res_plot$Model[!All_res_plot$Model == 'All' & All_res_plot$Test == 'Strat_PRS']<-'Strat_PRS only'
All_res_plot$Model[All_res_plot$Model == 'All' & All_res_plot$Test == 'Strat_PRS']<-'Strat_PRS + GeRS'

All_res_plot$Model[!All_res_plot$Model == 'All' & All_res_plot$Test == 'PRScs_and_GeRS']<-'PRScs only   '
All_res_plot$Model[All_res_plot$Model == 'All' & All_res_plot$Test == 'PRScs_and_GeRS']<-'PRScs + GeRS'

All_res_plot$Model<-factor(All_res_plot$Model, levels=c("GeRS Best pT   ","GeRS Multi pT", "GeRS Best Tissue   ","GeRS Multi Tissue","PRS only   ","PRS + GeRS", "Strat_PRS only", "Strat_PRS + GeRS","PRScs only   ","PRScs + GeRS"))

library(ggplot2)
library(cowplot)

# Plot results
Plot_1<-ggplot(All_res_plot[All_res_plot$Test == 'GeRS_multi_pT',], aes(x=Phenotype, y=R, fill=Model)) +
          geom_bar(stat="identity", position=position_dodge()) +
          geom_text(aes(y=R+0.04), label=All_res_plot[All_res_plot$Test == 'GeRS_multi_pT',]$Val_Label_1, parse=T, vjust=-0.5, hjust=0) +
          geom_text(aes(y=R+0.04), label=All_res_plot[All_res_plot$Test == 'GeRS_multi_pT',]$Val_Label_2, parse=T, vjust=1, hjust=0) +
          labs(y='Correlation', x='') +
          ylim(NA,0.65) +
          theme_half_open() +
          theme(legend.title=element_blank(),legend.position="top") +
          background_grid(major = 'x', minor = 'x') +
          coord_flip()

Plot_2<-ggplot(All_res_plot[All_res_plot$Test == 'GeRS_multi_tissue',], aes(x=Phenotype, y=R, fill=Model)) +
          geom_bar(stat="identity", position=position_dodge()) +
          geom_text(aes(y=R+0.04), label=All_res_plot[All_res_plot$Test == 'GeRS_multi_tissue',]$Val_Label_1, parse=T, vjust=-0.5, hjust=0) +
          geom_text(aes(y=R+0.04), label=All_res_plot[All_res_plot$Test == 'GeRS_multi_tissue',]$Val_Label_2, parse=T, vjust=1, hjust=0) +
          labs(y='Correlation', x='') +
          ylim(NA,0.65) +
          theme_half_open() +
          theme(legend.title=element_blank(),legend.position="top") +
          background_grid(major = 'x', minor = 'x') +
          coord_flip()

Plot_3<-ggplot(All_res_plot[All_res_plot$Test == 'PRS_and_GeRS',], aes(x=Phenotype, y=R, fill=Model)) +
          geom_bar(stat="identity", position=position_dodge()) +
          geom_text(aes(y=R+0.04), label=All_res_plot[All_res_plot$Test == 'PRS_and_GeRS',]$Val_Label_1, parse=T, vjust=-0.5, hjust=0) +
          geom_text(aes(y=R+0.04), label=All_res_plot[All_res_plot$Test == 'PRS_and_GeRS',]$Val_Label_2, parse=T, vjust=1, hjust=0) +
          labs(y='Correlation', x='') +
          ylim(NA,0.65) +
          theme_half_open() +
          theme(legend.title=element_blank(),legend.position="top") +
          background_grid(major = 'x', minor = 'x') +
          coord_flip()

Plot_4<-ggplot(All_res_plot[All_res_plot$Test == 'Strat_PRS',], aes(x=Phenotype, y=R, fill=Model)) +
          geom_bar(stat="identity", position=position_dodge()) +
          geom_text(aes(y=R+0.04), label=All_res_plot[All_res_plot$Test == 'Strat_PRS',]$Val_Label_1, parse=T, vjust=-0.5, hjust=0) +
          geom_text(aes(y=R+0.04), label=All_res_plot[All_res_plot$Test == 'Strat_PRS',]$Val_Label_2, parse=T, vjust=1, hjust=0) +
          labs(y='Correlation', x='') +
          ylim(NA,0.65) +
          theme_half_open() +
          theme(legend.title=element_blank(),legend.position="top") +
          background_grid(major = 'x', minor = 'x') +
          coord_flip()

Plot_5<-ggplot(All_res_plot[All_res_plot$Test == 'PRScs_and_GeRS',], aes(x=Phenotype, y=R, fill=Model)) +
          geom_bar(stat="identity", position=position_dodge()) +
          geom_text(aes(y=R+0.04), label=All_res_plot[All_res_plot$Test == 'PRScs_and_GeRS',]$Val_Label_1, parse=T, vjust=-0.5, hjust=0) +
          geom_text(aes(y=R+0.04), label=All_res_plot[All_res_plot$Test == 'PRScs_and_GeRS',]$Val_Label_2, parse=T, vjust=1, hjust=0) +
          labs(y='Correlation', x='') +
          ylim(NA,0.65) +
          theme_half_open() +
          theme(legend.title=element_blank(),legend.position="top") +
          background_grid(major = 'x', minor = 'x') +
          coord_flip()

png('/mnt/lustre/users/k1806347/Analyses/GeRS_comparison/TEDS_outcomes_for_prediction/GeRS_tests_summary_TEDS.png', units='px', res=300, width=3500, height=3000)
  plot_grid(Plot_1,Plot_2,Plot_3, Plot_5, labels = "AUTO")
dev.off()

###
# Recreate figure higlighting significant results
###

All_res_plot$Sig<-'NS'
All_res_plot$Sig[All_res_plot$R_diff_pval_num < 0.05 & All_res_plot$R_diff > 0]<-'Pos'
All_res_plot$Sig[All_res_plot$R_diff_pval_num < 0.05 & All_res_plot$R_diff < 0]<-'Neg'
All_res_plot$Sig<-factor(All_res_plot$Sig, levels=c('NS','Pos','Neg'))

scale_colour_op <- function(...){
    ggplot2:::manual_scale(
        'colour',
        values = setNames(c("#000000", "#009933","#FF0000"), c('NS', 'Pos', 'Neg')),
        ...
    )
}

Plot_1<-ggplot(All_res_plot[All_res_plot$Test == 'GeRS_multi_pT',], aes(x=Phenotype, y=R, fill=Model)) +
          geom_bar(stat="identity", position=position_dodge()) +
          geom_text(aes(y=R+0.04, colour=Sig), label=All_res_plot[All_res_plot$Test == 'GeRS_multi_pT',]$Val_Label_1, parse=T, vjust=-0.5, hjust=0,show.legend = FALSE) +
          geom_text(aes(y=R+0.04, colour=Sig), label=All_res_plot[All_res_plot$Test == 'GeRS_multi_pT',]$Val_Label_2, parse=T, vjust=1, hjust=0,show.legend = FALSE) +
          scale_colour_op() +
          labs(y='Correlation', x='') +
              ylim(NA,0.65) +
          theme_half_open() +
          theme(legend.title=element_blank(),legend.position="top") +
          background_grid(major = 'x', minor = 'x') +
          coord_flip()

Plot_2<-ggplot(All_res_plot[All_res_plot$Test == 'GeRS_multi_tissue',], aes(x=Phenotype, y=R, fill=Model)) +
          geom_bar(stat="identity", position=position_dodge()) +
          geom_text(aes(y=R+0.04, colour=Sig), label=All_res_plot[All_res_plot$Test == 'GeRS_multi_tissue',]$Val_Label_1, parse=T, vjust=-0.5, hjust=0,show.legend = FALSE) +
          geom_text(aes(y=R+0.04, colour=Sig), label=All_res_plot[All_res_plot$Test == 'GeRS_multi_tissue',]$Val_Label_2, parse=T, vjust=1, hjust=0,show.legend = FALSE) +
          scale_colour_op() +
          labs(y='Correlation', x='') +
          ylim(NA,0.65) +
          theme_half_open() +
          theme(legend.title=element_blank(),legend.position="top") +
          background_grid(major = 'x', minor = 'x') +
          coord_flip()

Plot_3<-ggplot(All_res_plot[All_res_plot$Test == 'PRS_and_GeRS',], aes(x=Phenotype, y=R, fill=Model)) +
          geom_bar(stat="identity", position=position_dodge()) +
          geom_text(aes(y=R+0.04, colour=Sig), label=All_res_plot[All_res_plot$Test == 'PRS_and_GeRS',]$Val_Label_1, parse=T, vjust=-0.5, hjust=0,show.legend = FALSE) +
          geom_text(aes(y=R+0.04, colour=Sig), label=All_res_plot[All_res_plot$Test == 'PRS_and_GeRS',]$Val_Label_2, parse=T, vjust=1, hjust=0,show.legend = FALSE) +
          scale_colour_op() +
          labs(y='Correlation', x='') +
          ylim(NA,0.65) +
          theme_half_open() +
          theme(legend.title=element_blank(),legend.position="top") +
          background_grid(major = 'x', minor = 'x') +
          coord_flip()

Plot_4<-ggplot(All_res_plot[All_res_plot$Test == 'Strat_PRS',], aes(x=Phenotype, y=R, fill=Model)) +
          geom_bar(stat="identity", position=position_dodge()) +
          geom_text(aes(y=R+0.04, colour=Sig), label=All_res_plot[All_res_plot$Test == 'Strat_PRS',]$Val_Label_1, parse=T, vjust=-0.5, hjust=0,show.legend = FALSE) +
          geom_text(aes(y=R+0.04, colour=Sig), label=All_res_plot[All_res_plot$Test == 'Strat_PRS',]$Val_Label_2, parse=T, vjust=1, hjust=0,show.legend = FALSE) +
          scale_colour_op() +
          labs(y='Correlation', x='') +
          ylim(NA,0.65) +
          theme_half_open() +
          theme(legend.title=element_blank(),legend.position="top") +
          background_grid(major = 'x', minor = 'x') +
          coord_flip()

Plot_5<-ggplot(All_res_plot[All_res_plot$Test == 'PRScs_and_GeRS',], aes(x=Phenotype, y=R, fill=Model)) +
          geom_bar(stat="identity", position=position_dodge()) +
          geom_text(aes(y=R+0.04, colour=Sig), label=All_res_plot[All_res_plot$Test == 'PRScs_and_GeRS',]$Val_Label_1, parse=T, vjust=-0.5, hjust=0,show.legend = FALSE) +
          geom_text(aes(y=R+0.04, colour=Sig), label=All_res_plot[All_res_plot$Test == 'PRScs_and_GeRS',]$Val_Label_2, parse=T, vjust=1, hjust=0,show.legend = FALSE) +
          scale_colour_op() +
          labs(y='Correlation', x='') +
          ylim(NA,0.65) +
          theme_half_open() +
          theme(legend.title=element_blank(),legend.position="top") +
          background_grid(major = 'x', minor = 'x') +
          coord_flip()

png('/mnt/lustre/users/k1806347/Analyses/GeRS_comparison/TEDS_outcomes_for_prediction/GeRS_tests_summary_TEDS.png', units='px', res=300, width=3500, height=3000)
  plot_grid(Plot_1,Plot_2,Plot_3, Plot_5, labels = "AUTO")
dev.off()
Plot comparison results (PP4+clump)
#####
# Compare results from each approach
#####

pheno<-c('Height21', 'BMI21', 'GCSE', 'ADHD')
gwas<-c('HEIG03', 'BODY11', 'EDUC03', 'ADHD04')
weight=c('YFS.BLOOD.RNAARR')

res<-list()
for(i in 1:length(gwas)){
res_2<-read.table(paste0('/users/k1806347/brc_scratch/Analyses/GeRS_comparison/TEDS_outcomes_for_prediction/',pheno[i],'/Association_withGeRSs/TEDS.w_hm3.AllTissue.',gwas[i],'.EUR-GeRSs_PP4.pred_comp.txt'), header=T, stringsAsFactors=F)
res_2<-res_2[res_2$Model_1 == 'All',]
res_2<-res_2[res_2$Model_2 != 'All',]
res_3<-read.table(paste0('/users/k1806347/brc_scratch/Analyses/GeRS_comparison/TEDS_outcomes_for_prediction/',pheno[i],'/Association_withPRS_and_GeRSs/TEDS.w_hm3.AllTissue.',gwas[i],'.EUR-GeRSs_PP4.EUR-PRSs.pt_clump.pred_comp.txt'), header=T, stringsAsFactors=F)

res[[pheno[i]]]<-data.frame(Test=c('GeRS_multi_tissue','PRS_and_GeRS'),
                        do.call(rbind,list( res_2[res_2$Model_2_R == max(res_2$Model_2_R),],
                                                    res_3[8,])))
}

res_table<-do.call(rbind, res)
res_table$Phenotype<-gsub('\\..*','',rownames(res_table))
res_table<-res_table[,c('Phenotype',names(res_table)[-length(names(res_table))])]
write.csv(res_table, '/mnt/lustre/users/k1806347/Analyses/GeRS_comparison/TEDS_outcomes_for_prediction/GeRS_PP4_tests_summary.csv', row.names=F, quote=F)

####
# Plot the R2 when using PRS only, and using PRS + multi-tissue GeRS
####

# Organise the results
res_plot<-list()
for(i in 1:length(gwas)){
tmp_res<-res[[pheno[i]]]

tmp_res$R_diff_pval<-format(tmp_res$R_diff_pval, scientific = TRUE, digits = 2)
tmp_res$R_diff_pval<-gsub('e-','*x*10^-',tmp_res$R_diff_pval)

tmp_res_Model_1<-tmp_res[,grepl('Test|Model_1|R_diff',names(tmp_res))]
names(tmp_res_Model_1)<-c('Test','Model','R','R_diff','R_diff_pval')
tmp_res_Model_2<-tmp_res[,grepl('Test|Model_2|R_diff',names(tmp_res))]
names(tmp_res_Model_2)<-c('Test','Model','R','R_diff','R_diff_pval')
tmp_res_Model_2$R_diff<-NA
tmp_res_Model_2$R_diff_pval<-NA

tmp_res_plot<-rbind(tmp_res_Model_1,tmp_res_Model_2)
tmp_res_plot$Phenotype<-pheno[i]

res_plot[[pheno[i]]]<-tmp_res_plot
}

# Combine results for each phenotype and prepare for plotting
All_res_plot<-do.call(rbind, res_plot)

All_res_plot$Test<-factor(All_res_plot$Test, levels=res[[1]]$Test)
All_res_plot$Phenotype<-factor(All_res_plot$Phenotype, level=unique(All_res_plot$Phenotype))
All_res_plot<-All_res_plot[order(All_res_plot$Phenotype,All_res_plot$Test),]

All_res_plot$Val_Label_1<-NA
All_res_plot$Val_Label_1[!is.na(All_res_plot$R_diff)]<-paste0('Diff == ',round(All_res_plot$R_diff[!is.na(All_res_plot$R_diff)],3))

All_res_plot$Val_Label_2<-NA
All_res_plot$Val_Label_2[!is.na(All_res_plot$R_diff)]<-paste0('italic(p) == ',All_res_plot$R_diff_pval[!is.na(All_res_plot$R_diff)])

All_res_plot$Model[!All_res_plot$Model == 'All' & All_res_plot$Test == 'GeRS_multi_tissue']<-'GeRS PP4 Best Tissue   '
All_res_plot$Model[All_res_plot$Model == 'All' & All_res_plot$Test == 'GeRS_multi_tissue']<-'GeRS PP4 Multi Tissue'

All_res_plot$Model[!All_res_plot$Model == 'All' & All_res_plot$Test == 'PRS_and_GeRS']<-'PRS only   '
All_res_plot$Model[All_res_plot$Model == 'All' & All_res_plot$Test == 'PRS_and_GeRS']<-'PRS + GeRS PP4'

All_res_plot$Model<-factor(All_res_plot$Model, levels=c("GeRS PP4 Best Tissue   ","GeRS PP4 Multi Tissue","PRS only   ","PRS + GeRS PP4"))

library(ggplot2)
library(cowplot)

# Plot results
Plot_2<-ggplot(All_res_plot[All_res_plot$Test == 'GeRS_multi_tissue',], aes(x=Phenotype, y=R, fill=Model)) +
          geom_bar(stat="identity", position=position_dodge()) +
          geom_text(aes(y=R+0.04), label=All_res_plot[All_res_plot$Test == 'GeRS_multi_tissue',]$Val_Label_1, parse=T, vjust=-0.5, hjust=0) +
          geom_text(aes(y=R+0.04), label=All_res_plot[All_res_plot$Test == 'GeRS_multi_tissue',]$Val_Label_2, parse=T, vjust=1, hjust=0) +
          labs(y='Correlation', x='') +
          ylim(NA,0.65) +
          theme_half_open() +
          theme(legend.title=element_blank(),legend.position="top") +
          background_grid(major = 'x', minor = 'x') +
          coord_flip()

Plot_3<-ggplot(All_res_plot[All_res_plot$Test == 'PRS_and_GeRS',], aes(x=Phenotype, y=R, fill=Model)) +
          geom_bar(stat="identity", position=position_dodge()) +
          geom_text(aes(y=R+0.04), label=All_res_plot[All_res_plot$Test == 'PRS_and_GeRS',]$Val_Label_1, parse=T, vjust=-0.5, hjust=0) +
          geom_text(aes(y=R+0.04), label=All_res_plot[All_res_plot$Test == 'PRS_and_GeRS',]$Val_Label_2, parse=T, vjust=1, hjust=0) +
          labs(y='Correlation', x='') +
          ylim(NA,0.65) +
          theme_half_open() +
          theme(legend.title=element_blank(),legend.position="top") +
          background_grid(major = 'x', minor = 'x') +
          coord_flip()

png('/mnt/lustre/users/k1806347/Analyses/GeRS_comparison/TEDS_outcomes_for_prediction/GeRS_PP4_tests_summary_TEDS.png', units='px', res=300, width=3500, height=1500)
  plot_grid(Plot_2,Plot_3, labels = "AUTO")
dev.off()
Plot comparison results (Tissue Specific)
#####
# Compare results from each approach
#####

pheno<-c('Height21', 'BMI21', 'GCSE', 'ADHD')
gwas<-c('HEIG03', 'BODY11', 'EDUC03', 'ADHD04')
weight=c('YFS.BLOOD.RNAARR')

res<-list()
for(i in 1:length(gwas)){
res_2<-read.table(paste0('/users/k1806347/brc_scratch/Analyses/GeRS_comparison/TEDS_outcomes_for_prediction/',pheno[i],'/Association_withGeRSs/TEDS.w_hm3.AllTissue.TissueSpecific.',gwas[i],'.EUR-GeRSs.pred_comp.txt'), header=T, stringsAsFactors=F)
res_2<-res_2[res_2$Model_1 == 'All',]
res_2<-res_2[res_2$Model_2 != 'All',]
res_3<-read.table(paste0('/users/k1806347/brc_scratch/Analyses/GeRS_comparison/TEDS_outcomes_for_prediction/',pheno[i],'/Association_withPRS_and_GeRSs/TEDS.w_hm3.AllTissue.TissueSpecific.',gwas[i],'.EUR-GeRSs.EUR-PRSs.pt_clump.pred_comp.txt'), header=T, stringsAsFactors=F)

res[[pheno[i]]]<-data.frame(Test=c('GeRS_multi_tissue','PRS_and_GeRS'),
                        do.call(rbind,list( res_2[res_2$Model_2_R == max(res_2$Model_2_R),],
                                                    res_3[8,])))
}

res_table<-do.call(rbind, res)
res_table$Phenotype<-gsub('\\..*','',rownames(res_table))
res_table<-res_table[,c('Phenotype',names(res_table)[-length(names(res_table))])]
write.csv(res_table, '/mnt/lustre/users/k1806347/Analyses/GeRS_comparison/TEDS_outcomes_for_prediction/GeRS_TissueSpecific_tests_summary.csv', row.names=F, quote=F)

####
# Plot the R2 when using PRS only, and using PRS + multi-tissue GeRS
####

# Organise the results
res_plot<-list()
for(i in 1:length(gwas)){
tmp_res<-res[[pheno[i]]]

tmp_res$R_diff_pval<-format(tmp_res$R_diff_pval, scientific = TRUE, digits = 2)
tmp_res$R_diff_pval<-gsub('e-','*x*10^-',tmp_res$R_diff_pval)

tmp_res_Model_1<-tmp_res[,grepl('Test|Model_1|R_diff',names(tmp_res))]
names(tmp_res_Model_1)<-c('Test','Model','R','R_diff','R_diff_pval')
tmp_res_Model_2<-tmp_res[,grepl('Test|Model_2|R_diff',names(tmp_res))]
names(tmp_res_Model_2)<-c('Test','Model','R','R_diff','R_diff_pval')
tmp_res_Model_2$R_diff<-NA
tmp_res_Model_2$R_diff_pval<-NA

tmp_res_plot<-rbind(tmp_res_Model_1,tmp_res_Model_2)
tmp_res_plot$Phenotype<-pheno[i]

res_plot[[pheno[i]]]<-tmp_res_plot
}

# Combine results for each phenotype and prepare for plotting
All_res_plot<-do.call(rbind, res_plot)

All_res_plot$Test<-factor(All_res_plot$Test, levels=res[[1]]$Test)
All_res_plot$Phenotype<-factor(All_res_plot$Phenotype, level=unique(All_res_plot$Phenotype))
All_res_plot<-All_res_plot[order(All_res_plot$Phenotype,All_res_plot$Test),]

All_res_plot$Val_Label_1<-NA
All_res_plot$Val_Label_1[!is.na(All_res_plot$R_diff)]<-paste0('Diff == ',round(All_res_plot$R_diff[!is.na(All_res_plot$R_diff)],3))

All_res_plot$Val_Label_2<-NA
All_res_plot$Val_Label_2[!is.na(All_res_plot$R_diff)]<-paste0('italic(p) == ',All_res_plot$R_diff_pval[!is.na(All_res_plot$R_diff)])

All_res_plot$Model[!All_res_plot$Model == 'All' & All_res_plot$Test == 'GeRS_multi_tissue']<-'GeRS TissueSpecific\nBest Tissue   '
All_res_plot$Model[All_res_plot$Model == 'All' & All_res_plot$Test == 'GeRS_multi_tissue']<-'GeRS TissueSpecific\nMulti Tissue'

All_res_plot$Model[!All_res_plot$Model == 'All' & All_res_plot$Test == 'PRS_and_GeRS']<-'PRS only   '
All_res_plot$Model[All_res_plot$Model == 'All' & All_res_plot$Test == 'PRS_and_GeRS']<-'PRS + GeRS TissueSpecific'

All_res_plot$Model<-factor(All_res_plot$Model, levels=c("GeRS TissueSpecific\nBest Tissue   ","GeRS TissueSpecific\nMulti Tissue","PRS only   ","PRS + GeRS TissueSpecific"))

library(ggplot2)
library(cowplot)

# Plot results
Plot_2<-ggplot(All_res_plot[All_res_plot$Test == 'GeRS_multi_tissue',], aes(x=Phenotype, y=R, fill=Model)) +
          geom_bar(stat="identity", position=position_dodge()) +
          geom_text(aes(y=R+0.04), label=All_res_plot[All_res_plot$Test == 'GeRS_multi_tissue',]$Val_Label_1, parse=T, vjust=-0.5, hjust=0) +
          geom_text(aes(y=R+0.04), label=All_res_plot[All_res_plot$Test == 'GeRS_multi_tissue',]$Val_Label_2, parse=T, vjust=1, hjust=0) +
          labs(y='Correlation', x='') +
          ylim(NA,0.65) +
          theme_half_open() +
          theme(legend.title=element_blank(),legend.position="top") +
          background_grid(major = 'x', minor = 'x') +
          coord_flip()

Plot_3<-ggplot(All_res_plot[All_res_plot$Test == 'PRS_and_GeRS',], aes(x=Phenotype, y=R, fill=Model)) +
          geom_bar(stat="identity", position=position_dodge()) +
          geom_text(aes(y=R+0.04), label=All_res_plot[All_res_plot$Test == 'PRS_and_GeRS',]$Val_Label_1, parse=T, vjust=-0.5, hjust=0) +
          geom_text(aes(y=R+0.04), label=All_res_plot[All_res_plot$Test == 'PRS_and_GeRS',]$Val_Label_2, parse=T, vjust=1, hjust=0) +
          labs(y='Correlation', x='') +
          ylim(NA,0.65) +
          theme_half_open() +
          theme(legend.title=element_blank(),legend.position="top") +
          background_grid(major = 'x', minor = 'x') +
          coord_flip()

png('/mnt/lustre/users/k1806347/Analyses/GeRS_comparison/TEDS_outcomes_for_prediction/GeRS_TissueSpecific_tests_summary_TEDS.png', units='px', res=300, width=3500, height=1500)
  plot_grid(Plot_2,Plot_3, labels = "AUTO")
dev.off()
Compare stratified PRS to multi-tissue GeRS
# Plot the results of the stratified PRS against Multi-tissue GeRS
# And look at the variance exaplained by each tissue
pheno<-c('Height21', 'BMI21', 'GCSE', 'ADHD')
pheno_label<-c('Height', 'BMI', 'GCSE', 'ADHD')
gwas<-c('HEIG03', 'BODY11', 'EDUC03', 'ADHD04')

res<-list()
crossTissue<-list()

for(i in 1:length(gwas)){
res_GeRS<-read.table(paste0('/users/k1806347/brc_scratch/Analyses/GeRS_comparison/TEDS_outcomes_for_prediction/',pheno[i],'/Association_withGeRSs/TEDS.w_hm3.AllTissue.',gwas[i],'.EUR-GeRSs.pred_eval.txt'), header=T, stringsAsFactors=F)

res_GeRS<-res_GeRS[dim(res_GeRS)[1],]

res_GeRS_coloc<-read.table(paste0('/users/k1806347/brc_scratch/Analyses/GeRS_comparison/TEDS_outcomes_for_prediction/',pheno[i],'/Association_withGeRSs/TEDS.w_hm3.AllTissue.',gwas[i],'.EUR-GeRSs_pT_withColoc.pred_eval.txt'), header=T, stringsAsFactors=F)

res_GeRS_coloc<-res_GeRS_coloc[dim(res_GeRS_coloc)[1],]

res_stratPRS<-read.table(paste0('/users/k1806347/brc_scratch/Analyses/GeRS_comparison/TEDS_outcomes_for_prediction/',pheno[i],'/Association_withPRSs/TEDS.w_hm3.',gwas[i],'.EUR-PRSs-TWAS_gene_stratified.pred_eval.txt'), header=T, stringsAsFactors=F)

res_stratPRS<-res_stratPRS[2,]

res_GWPRS<-read.table(paste0('/users/k1806347/brc_scratch/Analyses/GeRS_comparison/TEDS_outcomes_for_prediction/',pheno[i],'/Association_withPRSs/TEDS.w_hm3.',gwas[i],'.EUR-PRSs.pred_eval.txt'), header=T, stringsAsFactors=F)
res_GWPRS<-res_GWPRS[dim(res_GWPRS)[1],]

res_all<-do.call(rbind, list(res_GeRS,res_GeRS_coloc, res_stratPRS, res_GWPRS))
res_all$Method<-c('GeRS',"GeRS (coloc)",'PRS (Gene)','PRS')
res_all$Phenotype<-pheno_label[i]

res_all<-res_all[,c('Model','R','SE','P','N','Method','Phenotype')]

res[[pheno[i]]]<-res_all
}

res_table<-do.call(rbind, res)
res_table<-res_table[,c('Phenotype','Method','R','SE')]

write.csv(res_table, '/mnt/lustre/users/k1806347/Analyses/GeRS_comparison/TEDS_outcomes_for_prediction/StratPRS_comp_summary.csv', row.names=F, quote=F)

library(ggplot2)
library(cowplot)
# Plot comparison across PRS, stratified PRS and GeRS
res_table$Phenotype<-factor(res_table$Phenotype, level=unique(res_table$Phenotype))

png('/mnt/lustre/users/k1806347/Analyses/GeRS_comparison/TEDS_outcomes_for_prediction/StratPRS_comp_TEDS.png', units='px', res=300, width=1500, height=1000)

ggplot(res_table, aes(x=Phenotype, y=R, fill=Method)) +
          geom_bar(stat="identity", position=position_dodge(0.9)) +
          geom_errorbar(aes(ymin=R-SE, ymax=R+SE), width=.2,
                 position=position_dodge(0.9)) +
          labs(y="Correlation (SE)", x='') +
              ylim(NA,0.41) +
          theme_half_open() +
          theme(axis.text.x = element_text(angle = 45, hjust = 1), legend.position="top", legend.justification = c(0.5, 0), legend.title=element_blank()) +
          guides(fill=guide_legend(title.hjust =0.5)) +
          background_grid(major = 'y', minor = 'y')

dev.off()
Compare GeRS to PP4 and TissueSpecific GeRS
# Plot the results of the stratified PRS against Multi-tissue GeRS
# And look at the variance exaplained by each tissue
pheno<-c('Height21', 'BMI21', 'GCSE', 'ADHD')
pheno_label<-c('Height', 'BMI', 'GCSE', 'ADHD')
gwas<-c('HEIG03', 'BODY11', 'EDUC03', 'ADHD04')

res<-list()
crossTissue<-list()

for(i in 1:length(gwas)){
res_GeRS<-read.table(paste0('/users/k1806347/brc_scratch/Analyses/GeRS_comparison/TEDS_outcomes_for_prediction/',pheno[i],'/Association_withGeRSs/TEDS.w_hm3.AllTissue.',gwas[i],'.EUR-GeRSs.pred_eval.txt'), header=T, stringsAsFactors=F)

res_GeRS_all<-res_GeRS[dim(res_GeRS)[1],]
res_GeRS<-res_GeRS[-dim(res_GeRS)[1],]
res_GeRS_best<-res_GeRS[which(res_GeRS$R == max(res_GeRS$R)),]

res_GeRS_coloc<-read.table(paste0('/users/k1806347/brc_scratch/Analyses/GeRS_comparison/TEDS_outcomes_for_prediction/',pheno[i],'/Association_withGeRSs/TEDS.w_hm3.AllTissue.',gwas[i],'.EUR-GeRSs_pT_withColoc.pred_eval.txt'), header=T, stringsAsFactors=F)

res_GeRS_coloc_all<-res_GeRS_coloc[dim(res_GeRS_coloc)[1],]
res_GeRS_coloc<-res_GeRS_coloc[-dim(res_GeRS_coloc)[1],]
res_GeRS_coloc_best<-res_GeRS_coloc[which(res_GeRS_coloc$R == max(res_GeRS_coloc$R)),]

res_GeRS_TS<-read.table(paste0('/users/k1806347/brc_scratch/Analyses/GeRS_comparison/TEDS_outcomes_for_prediction/',pheno[i],'/Association_withGeRSs/TEDS.w_hm3.AllTissue.TissueSpecific.',gwas[i],'.EUR-GeRSs.pred_eval.txt'), header=T, stringsAsFactors=F)

res_GeRS_TS_all<-res_GeRS_TS[dim(res_GeRS_TS)[1],]
res_GeRS_TS<-res_GeRS_TS[-dim(res_GeRS_TS)[1],]
res_GeRS_TS_best<-res_GeRS_TS[which(res_GeRS_TS$R == max(res_GeRS_TS$R)),]

res_all<-do.call(rbind, list(res_GeRS_best,res_GeRS_all,res_GeRS_coloc_best,res_GeRS_coloc_all,res_GeRS_TS_best, res_GeRS_TS_all))
res_all$Method<-c("GeRS (best)","GeRS (all)","GeRS coloc (best)","GeRS coloc (all)","GeRS TS (best)","GeRS TS (all)")

res_all$Phenotype<-pheno_label[i]

res_all<-res_all[,c('Model','R','SE','P','N','Method','Phenotype')]

res[[pheno[i]]]<-res_all
}

res_table<-do.call(rbind, res)
res_table<-res_table[,c('Phenotype','Method','R','SE')]

write.csv(res_table, '/mnt/lustre/users/k1806347/Analyses/GeRS_comparison/TEDS_outcomes_for_prediction/GeRS_coloc_TissueSpecific_comp_summary.csv', row.names=F, quote=F)

library(ggplot2)
library(cowplot)
# Plot comparison across GeRS
res_table$Phenotype<-factor(res_table$Phenotype, level=unique(res_table$Phenotype))

res_table$Method<-factor(res_table$Method, levels=c("GeRS (best)","GeRS (all)","GeRS coloc (best)","GeRS coloc (all)","GeRS TS (best)","GeRS TS (all)"))

png('/mnt/lustre/users/k1806347/Analyses/GeRS_comparison/TEDS_outcomes_for_prediction/GeRS_coloc_TissueSpecific_comp_TEDS.png', units='px', res=300, width=2000, height=1000)

ggplot(res_table, aes(x=Phenotype, y=R, fill=Method)) +
          geom_bar(stat="identity", position=position_dodge(0.9)) +
          geom_errorbar(aes(ymin=R-SE, ymax=R+SE), width=.2,
                 position=position_dodge(0.9)) +
          labs(y="Correlation (SE)", x='') +
              ylim(0,0.3) +
          theme_half_open() +
          theme(axis.text.x = element_text(angle = 45, hjust = 1), legend.position="top", legend.justification = c(0.5, 0), legend.title=element_blank()) +
          guides(fill=guide_legend(title.hjust =0.5)) +
          background_grid(major = 'y', minor = 'y')

dev.off()
Plot GeRS across tissues
pheno<-c('Height21', 'BMI21', 'GCSE', 'ADHD')
pheno_label<-c('Height', 'BMI', 'GCSE', 'ADHD')
gwas<-c('HEIG03', 'BODY11', 'EDUC03', 'ADHD04')

crossTissue<-list()

for(i in 1:length(gwas)){
res_GeRS<-read.table(paste0('/users/k1806347/brc_scratch/Analyses/GeRS_comparison/TEDS_outcomes_for_prediction/',pheno[i],'/Association_withGeRSs/TEDS.w_hm3.AllTissue.',gwas[i],'.EUR-GeRSs.pred_eval.txt'), header=T, stringsAsFactors=F)


crossTissue_i<-res_GeRS

crossTissue_i$Phenotype<-pheno_label[i]

crossTissue_i<-crossTissue_i[,c('Phenotype','Model','R','SE','P')]

crossTissue_i$Model<-gsub('_group','',crossTissue_i$Model)
crossTissue_i$Panel<-crossTissue_i$Model

crossTissue_i$Model<-gsub('CMC.BRAIN.RNASEQ','CMC DLPFC',crossTissue_i$Model)
crossTissue_i$Model<-gsub('SPLICING','Splicing',crossTissue_i$Model)
crossTissue_i$Model<-gsub('NTR.BLOOD.RNAARR','NTR Blood',crossTissue_i$Model)
crossTissue_i$Model<-gsub('YFS.BLOOD.RNAARR','YFS Blood',crossTissue_i$Model)
crossTissue_i$Model<-gsub('METSIM.ADIPOSE.RNASEQ','METSIM Adipose',crossTissue_i$Model)
crossTissue_i$Model<-gsub('\\.',' ',crossTissue_i$Model)
crossTissue_i$Model[!grepl('CMC|NTR|YFS|METSIM|All', crossTissue_i$Model)]<-paste0('GTEx ',crossTissue_i$Model[!grepl('CMC|NTR|YFS|METSIM|All', crossTissue_i$Model)])
crossTissue_i$Model<-gsub('Brain', '', crossTissue_i$Model)
crossTissue_i$Model <- gsub('Anterior cingulate cortex', 'ACC', crossTissue_i$Model)
crossTissue_i$Model <- gsub('basal ganglia', '', crossTissue_i$Model)
crossTissue_i$Model <- gsub('BA9', '', crossTissue_i$Model)
crossTissue_i$Model <- gsub('BA24', '', crossTissue_i$Model)
crossTissue_i$Model <- gsub('  ', ' ', crossTissue_i$Model)
crossTissue_i$Model_short<-substr(crossTissue_i$Model, start = 1, stop = 18)  #start the name at the first character and stop at the 25th
crossTissue_i$Model_short[nchar(crossTissue_i$Model) > 18]<-paste0(crossTissue_i$Model_short[nchar(crossTissue_i$Model) > 18], "...")

crossTissue_i$R_scaled<-scale(crossTissue_i$R)

crossTissue[[pheno[i]]]<-crossTissue_i

}

crossTissue_table<-do.call(rbind, crossTissue)
crossTissue_table<-crossTissue_table[,c('Phenotype','Model','Model_short','R','SE','Panel','R_scaled')]

library(ggplot2)
library(cowplot)

plot_list<-list()
for(i in 1:length(gwas)){
  tmp<-crossTissue[[pheno[i]]]
  tmp$Model_short<-factor(tmp$Model_short, level=tmp$Model_short[rev(order(tmp$R))])
  tmp$Colour<-ifelse(tmp$Model_short == 'All', 'All', 'Single')

plot_list[[pheno[i]]]<-ggplot(tmp, aes(x=Model_short, y=R, fill=Colour)) +
          geom_bar(stat="identity", position=position_dodge(0.9)) +
          geom_errorbar(aes(ymin=R-SE, ymax=R+SE), width=.2,
                 position=position_dodge(0.9)) +
          labs(y="Correlation (SE)", x='', title=pheno_label[i]) +
          theme_half_open() +
          theme(axis.text.x = element_text(angle = 90, hjust = 1, vjust=0.5, size=10), legend.position = "none") +
          background_grid(major = 'y', minor = 'y')
}

png('/mnt/lustre/users/k1806347/Analyses/GeRS_comparison/TEDS_outcomes_for_prediction/GeRS_Tissue_comp_TEDS.png', units='px', res=300, width=3000, height=4000)
  plot_grid(plotlist=plot_list, ncol=1)
dev.off()

# Estimate the correlation between SNP-weight set sample size, number of features and predictive utility
weight_info<-fread('/users/k1806347/brc_scratch/Analyses/GeRS_comparison/snp_weights_table.csv')
weight_info$Set<-gsub('_','.',weight_info$Set)
weight_info$Set<-gsub('-','.',weight_info$Set)

crossTissue_table<-merge(crossTissue_table, weight_info, by.x='Panel', by.y='Set')

# Check correlation across
cor(crossTissue_table$R, crossTissue_table$N_indiv) # 0.1516963
feat_cor<-cor(crossTissue_table$R, crossTissue_table$N_feat) # 0.2879782
cor(crossTissue_table$N_indiv, crossTissue_table$N_feat) # 0.3263912

summary(lm(R ~ N_feat + N_indiv, data=crossTissue_table)) # R2 = 0.08666
# N_indiv effect is non significant when moddeling N_feat
crossTissue_table$R_resid<-resid(lm(R ~ N_feat, data=crossTissue_table))

plot_list<-list()
for(i in 1:length(gwas)){
  crossTissue_table$R_resid[crossTissue_table$Phenotype == pheno_label[i]]<-scale(crossTissue_table$R_resid[crossTissue_table$Phenotype == pheno_label[i]])
  tmp<-crossTissue_table[crossTissue_table$Phenotype == pheno_label[i],]
  tmp$Model_short<-factor(tmp$Model_short, level=tmp$Model_short[rev(order(tmp$R_resid))])
  tmp$Colour<-ifelse(tmp$Model_short == 'All', 'All', 'Single')

plot_list[[pheno[i]]]<-ggplot(tmp, aes(x=Model_short, y=R_resid, fill=Colour)) +
          geom_bar(stat="identity", position=position_dodge(0.9)) +
          labs(y="Residual Correlation", x='', title=pheno_label[i]) +
          theme_half_open() +
          theme(axis.text.x = element_text(angle = 90, hjust = 1, vjust=0.5, size=10), legend.position = "none") +
          background_grid(major = 'y', minor = 'y')
}

png('/mnt/lustre/users/k1806347/Analyses/GeRS_comparison/TEDS_outcomes_for_prediction/GeRS_Tissue_comp_resid_TEDS.png', units='px', res=300, width=3000, height=4000)
  plot_grid(plotlist=plot_list, ncol=1)
dev.off()

# Plot relationship between N_feat and R2 scaled for each phenotype
png('/mnt/lustre/users/k1806347/Analyses/GeRS_comparison/TEDS_outcomes_for_prediction/GeRS_Tissue_comp_Nfeat_TEDS.png', units='px', res=300, width=1500, height=1000)
ggplot(crossTissue_table, aes(x=N_feat, R_scaled)) +
  labs(y="Relative prediction", x='Number of features') +
  geom_smooth(method='lm') +
  annotate("text", x=7500, y=-2, label = paste0("italic('r') == ",round(feat_cor,2)), parse=T) +
  geom_point(data=crossTissue_table, aes(x=N_feat, R_scaled, colour=Phenotype)) +
  theme_half_open()
dev.off()
Plot GeRS (PP4+clump) across tissues
pheno<-c('Height21', 'BMI21', 'GCSE', 'ADHD')
pheno_label<-c('Height', 'BMI', 'GCSE', 'ADHD')
gwas<-c('HEIG03', 'BODY11', 'EDUC03', 'ADHD04')

crossTissue<-list()

for(i in 1:length(gwas)){
res_GeRS<-read.table(paste0('/users/k1806347/brc_scratch/Analyses/GeRS_comparison/TEDS_outcomes_for_prediction/',pheno[i],'/Association_withGeRSs/TEDS.w_hm3.AllTissue.',gwas[i],'.EUR-GeRSs_PP4.pred_eval.txt'), header=T, stringsAsFactors=F)

crossTissue_i<-res_GeRS

crossTissue_i$Phenotype<-pheno_label[i]

crossTissue_i<-crossTissue_i[,c('Phenotype','Model','R','SE','P')]

crossTissue_i$Model<-gsub('_group','',crossTissue_i$Model)
crossTissue_i$Panel<-crossTissue_i$Model

crossTissue_i$Model<-gsub('CMC.BRAIN.RNASEQ','CMC DLPFC',crossTissue_i$Model)
crossTissue_i$Model<-gsub('SPLICING','Splicing',crossTissue_i$Model)
crossTissue_i$Model<-gsub('NTR.BLOOD.RNAARR','NTR Blood',crossTissue_i$Model)
crossTissue_i$Model<-gsub('YFS.BLOOD.RNAARR','YFS Blood',crossTissue_i$Model)
crossTissue_i$Model<-gsub('METSIM.ADIPOSE.RNASEQ','METSIM Adipose',crossTissue_i$Model)
crossTissue_i$Model<-gsub('\\.',' ',crossTissue_i$Model)
crossTissue_i$Model[!grepl('CMC|NTR|YFS|METSIM|All', crossTissue_i$Model)]<-paste0('GTEx ',crossTissue_i$Model[!grepl('CMC|NTR|YFS|METSIM|All', crossTissue_i$Model)])
crossTissue_i$Model<-gsub('Brain', '', crossTissue_i$Model)
crossTissue_i$Model <- gsub('Anterior cingulate cortex', 'ACC', crossTissue_i$Model)
crossTissue_i$Model <- gsub('basal ganglia', '', crossTissue_i$Model)
crossTissue_i$Model <- gsub('BA9', '', crossTissue_i$Model)
crossTissue_i$Model <- gsub('BA24', '', crossTissue_i$Model)
crossTissue_i$Model <- gsub('  ', ' ', crossTissue_i$Model)
crossTissue_i$Model_short<-substr(crossTissue_i$Model, start = 1, stop = 18)  #start the name at the first character and stop at the 25th
crossTissue_i$Model_short[nchar(crossTissue_i$Model) > 18]<-paste0(crossTissue_i$Model_short[nchar(crossTissue_i$Model) > 18], "...")

crossTissue[[pheno[i]]]<-crossTissue_i

}

crossTissue_table<-do.call(rbind, crossTissue)
crossTissue_table<-crossTissue_table[,c('Phenotype','Model','Model_short','R','SE','Panel')]

library(ggplot2)
library(cowplot)

plot_list<-list()
for(i in 1:length(gwas)){
  tmp<-crossTissue[[pheno[i]]]
  tmp$Model_short<-factor(tmp$Model_short, level=tmp$Model_short[rev(order(tmp$R))])
  tmp$Colour<-ifelse(tmp$Model_short == 'All', 'All', 'Single')

plot_list[[pheno[i]]]<-ggplot(tmp, aes(x=Model_short, y=R, fill=Colour)) +
          geom_bar(stat="identity", position=position_dodge(0.9)) +
          geom_errorbar(aes(ymin=R-SE, ymax=R+SE), width=.2,
                 position=position_dodge(0.9)) +
          labs(y="Correlation (SE)", x='', title=pheno_label[i]) +
          theme_half_open() +
          theme(axis.text.x = element_text(angle = 90, hjust = 1, vjust=0.5, size=10), legend.position = "none") +
          background_grid(major = 'y', minor = 'y')
}

png('/mnt/lustre/users/k1806347/Analyses/GeRS_comparison/TEDS_outcomes_for_prediction/GeRS_PP4_Tissue_comp_TEDS.png', units='px', res=300, width=3000, height=4000)
  plot_grid(plotlist=plot_list, ncol=1)
dev.off()

# Estimate the correlation between SNP-weight set sample size, number of features and predictive utility
weight_info<-fread('/users/k1806347/brc_scratch/Analyses/GeRS_comparison/snp_weights_table.csv')
weight_info$Set<-gsub('_','.',weight_info$Set)
weight_info$Set<-gsub('-','.',weight_info$Set)

crossTissue_table<-merge(crossTissue_table, weight_info, by.x='Panel', by.y='Set')

# Check correlation across
cor(crossTissue_table$R, crossTissue_table$N_indiv) # 0.1086192
cor(crossTissue_table$R, crossTissue_table$N_feat) # 0.2683005
cor(crossTissue_table$N_indiv, crossTissue_table$N_feat) # 0.3263912

summary(lm(R ~ N_feat + N_indiv, data=crossTissue_table)) # R2 = 0.07248
crossTissue_table$R_resid<-resid(lm(R ~ N_feat + N_indiv, data=crossTissue_table))
Plot GeRS (TissueSpecific) across tissues
pheno<-c('Height21', 'BMI21', 'GCSE', 'ADHD')
pheno_label<-c('Height', 'BMI', 'GCSE', 'ADHD')
gwas<-c('HEIG03', 'BODY11', 'EDUC03', 'ADHD04')

crossTissue<-list()

for(i in 1:length(gwas)){
res_GeRS<-read.table(paste0('/users/k1806347/brc_scratch/Analyses/GeRS_comparison/TEDS_outcomes_for_prediction/',pheno[i],'/Association_withGeRSs/TEDS.w_hm3.AllTissue.TissueSpecific.',gwas[i],'.EUR-GeRSs.pred_eval.txt'), header=T, stringsAsFactors=F)

crossTissue_i<-res_GeRS

crossTissue_i$Phenotype<-pheno_label[i]

crossTissue_i<-crossTissue_i[,c('Phenotype','Model','R','SE','P')]

crossTissue_i$Model<-gsub('_group','',crossTissue_i$Model)

crossTissue_i$Model<-gsub('CMC.BRAIN.RNASEQ','CMC DLPFC',crossTissue_i$Model)
crossTissue_i$Model<-gsub('SPLICING','Splicing',crossTissue_i$Model)
crossTissue_i$Model<-gsub('NTR.BLOOD.RNAARR','NTR Blood',crossTissue_i$Model)
crossTissue_i$Model<-gsub('YFS.BLOOD.RNAARR','YFS Blood',crossTissue_i$Model)
crossTissue_i$Model<-gsub('METSIM.ADIPOSE.RNASEQ','METSIM Adipose',crossTissue_i$Model)
crossTissue_i$Model<-gsub('\\.',' ',crossTissue_i$Model)
crossTissue_i$Model[!grepl('CMC|NTR|YFS|METSIM|All', crossTissue_i$Model)]<-paste0('GTEx ',crossTissue_i$Model[!grepl('CMC|NTR|YFS|METSIM|All', crossTissue_i$Model)])
crossTissue_i$Model<-gsub('Brain', '', crossTissue_i$Model)
crossTissue_i$Model <- gsub('Anterior cingulate cortex', 'ACC', crossTissue_i$Model)
crossTissue_i$Model <- gsub('basal ganglia', '', crossTissue_i$Model)
crossTissue_i$Model <- gsub('BA9', '', crossTissue_i$Model)
crossTissue_i$Model <- gsub('BA24', '', crossTissue_i$Model)
crossTissue_i$Model <- gsub('  ', ' ', crossTissue_i$Model)
crossTissue_i$Model_short<-substr(crossTissue_i$Model, start = 1, stop = 18)  #start the name at the first character and stop at the 25th
crossTissue_i$Model_short[nchar(crossTissue_i$Model) > 18]<-paste0(crossTissue_i$Model_short[nchar(crossTissue_i$Model) > 18], "...")

crossTissue[[pheno[i]]]<-crossTissue_i

}

crossTissue_table<-do.call(rbind, crossTissue)
crossTissue_table<-crossTissue_table[,c('Phenotype','Model','Model_short','R','SE')]

library(ggplot2)
library(cowplot)

plot_list<-list()
for(i in 1:length(gwas)){
  tmp<-crossTissue[[pheno[i]]]
  tmp$Model_short<-factor(tmp$Model_short, level=tmp$Model_short[rev(order(tmp$R))])
  tmp$Colour<-ifelse(tmp$Model_short == 'All', 'All', 'Single')

plot_list[[pheno[i]]]<-ggplot(tmp, aes(x=Model_short, y=R, fill=Colour)) +
          geom_bar(stat="identity", position=position_dodge(0.9)) +
          geom_errorbar(aes(ymin=R-SE, ymax=R+SE), width=.2,
                 position=position_dodge(0.9)) +
          labs(y="Correlation (SE)", x='', title=pheno_label[i]) +
          theme_half_open() +
          theme(axis.text.x = element_text(angle = 90, hjust = 1, vjust=0.5, size=10), legend.position = "none") +
          background_grid(major = 'y', minor = 'y')
}

png('/mnt/lustre/users/k1806347/Analyses/GeRS_comparison/TEDS_outcomes_for_prediction/GeRS_TissueSpecific_Tissue_comp_TEDS.png', units='px', res=300, width=3000, height=4000)
  plot_grid(plotlist=plot_list, ncol=1)
dev.off()
Show GeRS prediction across p-value thresholds
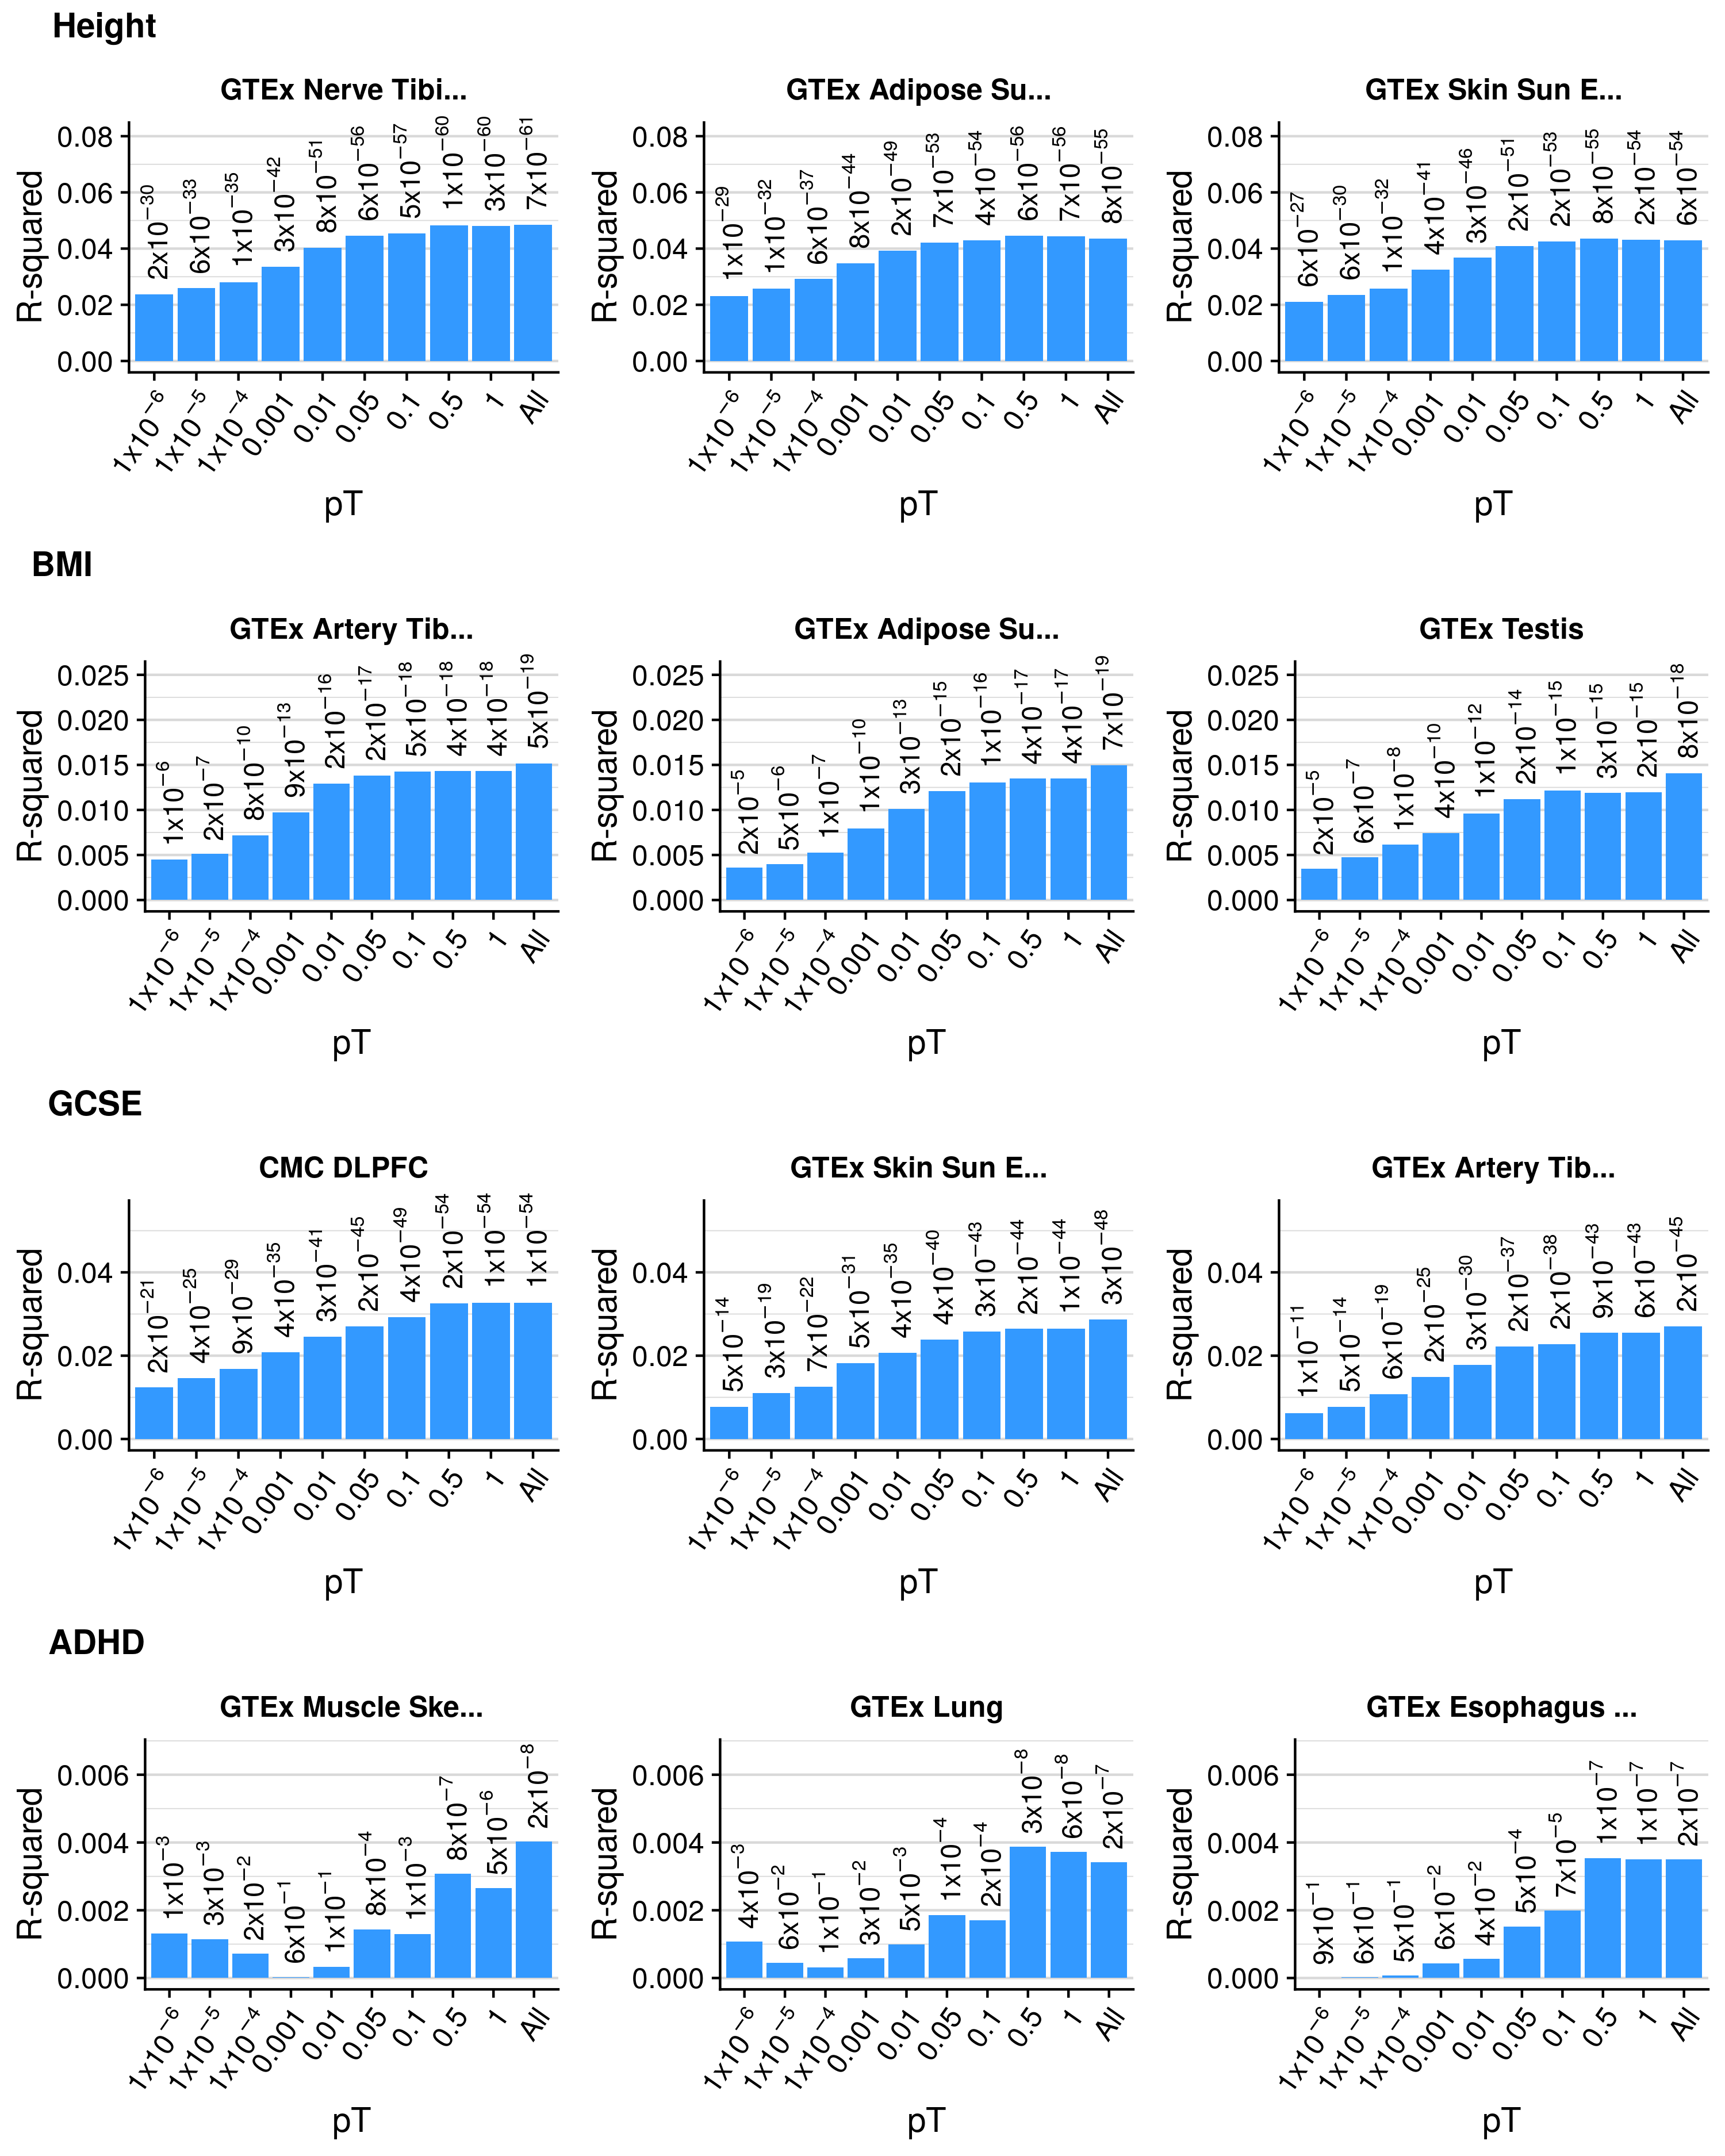
Predictive utility: R2
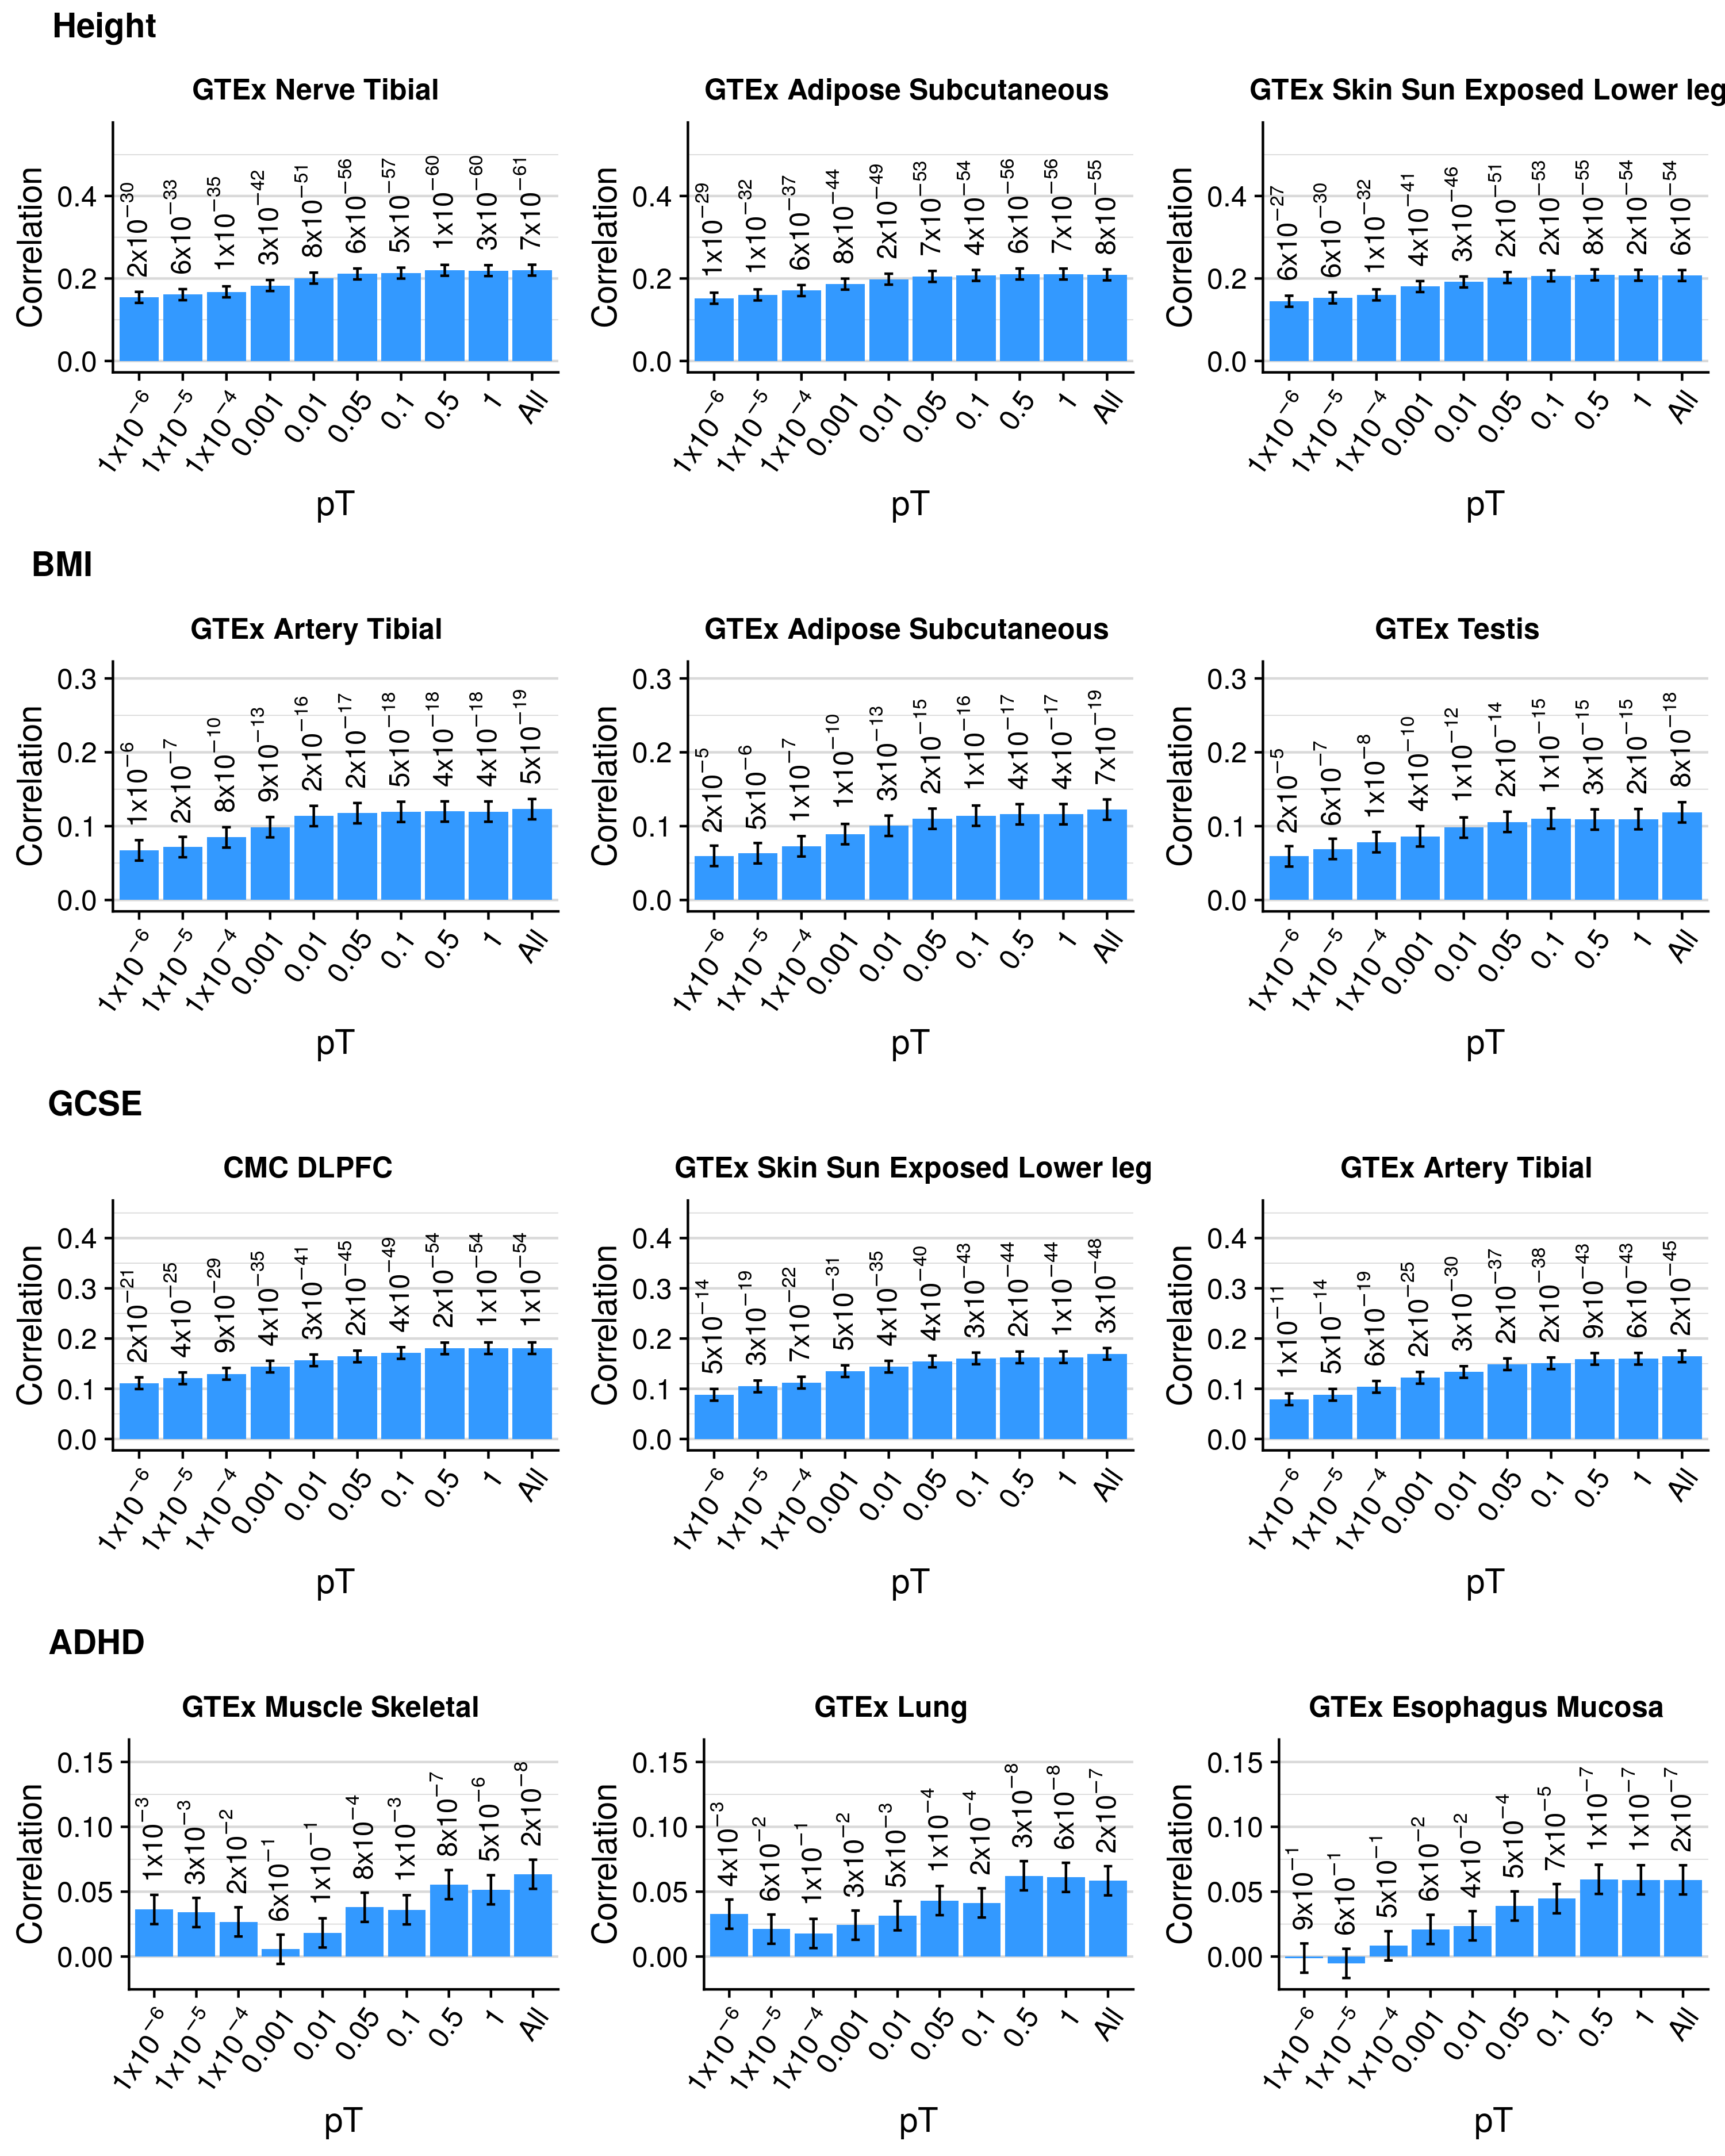
Predictive utility:R
| Phenotype | Weight | Model | R (SE) |
|---|---|---|---|
| Height21 | Adipose_Subcutaneous | 1e.06 | 0.152 (0.013) |
| Height21 | Adipose_Subcutaneous | 1e.05 | 0.16 (0.013) |
| Height21 | Adipose_Subcutaneous | 1e.04 | 0.171 (0.013) |
| Height21 | Adipose_Subcutaneous | 0.001 | 0.186 (0.013) |
| Height21 | Adipose_Subcutaneous | 0.01 | 0.198 (0.013) |
| Height21 | Adipose_Subcutaneous | 0.05 | 0.205 (0.013) |
| Height21 | Adipose_Subcutaneous | 0.1 | 0.207 (0.013) |
| Height21 | Adipose_Subcutaneous | 0.5 | 0.211 (0.013) |
| Height21 | Adipose_Subcutaneous | 1 | 0.211 (0.013) |
| Height21 | Adipose_Subcutaneous | All | 0.209 (0.013) |
| Height21 | Adipose_Visceral_Omentum | 1e.06 | 0.145 (0.013) |
| Height21 | Adipose_Visceral_Omentum | 1e.05 | 0.151 (0.013) |
| Height21 | Adipose_Visceral_Omentum | 1e.04 | 0.159 (0.013) |
| Height21 | Adipose_Visceral_Omentum | 0.001 | 0.176 (0.013) |
| Height21 | Adipose_Visceral_Omentum | 0.01 | 0.187 (0.013) |
| Height21 | Adipose_Visceral_Omentum | 0.05 | 0.193 (0.013) |
| Height21 | Adipose_Visceral_Omentum | 0.1 | 0.196 (0.013) |
| Height21 | Adipose_Visceral_Omentum | 0.5 | 0.192 (0.013) |
| Height21 | Adipose_Visceral_Omentum | 1 | 0.192 (0.013) |
| Height21 | Adipose_Visceral_Omentum | All | 0.193 (0.013) |
| Height21 | Adrenal_Gland | 1e.06 | 0.125 (0.013) |
| Height21 | Adrenal_Gland | 1e.05 | 0.135 (0.013) |
| Height21 | Adrenal_Gland | 1e.04 | 0.145 (0.013) |
| Height21 | Adrenal_Gland | 0.001 | 0.15 (0.013) |
| Height21 | Adrenal_Gland | 0.01 | 0.149 (0.013) |
| Height21 | Adrenal_Gland | 0.05 | 0.16 (0.013) |
| Height21 | Adrenal_Gland | 0.1 | 0.161 (0.013) |
| Height21 | Adrenal_Gland | 0.5 | 0.159 (0.013) |
| Height21 | Adrenal_Gland | 1 | 0.16 (0.013) |
| Height21 | Adrenal_Gland | All | 0.161 (0.013) |
| Height21 | Artery_Aorta | 1e.06 | 0.134 (0.013) |
| Height21 | Artery_Aorta | 1e.05 | 0.143 (0.013) |
| Height21 | Artery_Aorta | 1e.04 | 0.153 (0.013) |
| Height21 | Artery_Aorta | 0.001 | 0.165 (0.013) |
| Height21 | Artery_Aorta | 0.01 | 0.179 (0.013) |
| Height21 | Artery_Aorta | 0.05 | 0.188 (0.013) |
| Height21 | Artery_Aorta | 0.1 | 0.191 (0.013) |
| Height21 | Artery_Aorta | 0.5 | 0.19 (0.013) |
| Height21 | Artery_Aorta | 1 | 0.191 (0.013) |
| Height21 | Artery_Aorta | All | 0.193 (0.013) |
| Height21 | Artery_Coronary | 1e.06 | 0.104 (0.013) |
| Height21 | Artery_Coronary | 1e.05 | 0.115 (0.013) |
| Height21 | Artery_Coronary | 1e.04 | 0.123 (0.013) |
| Height21 | Artery_Coronary | 0.001 | 0.132 (0.013) |
| Height21 | Artery_Coronary | 0.01 | 0.141 (0.013) |
| Height21 | Artery_Coronary | 0.05 | 0.147 (0.013) |
| Height21 | Artery_Coronary | 0.1 | 0.147 (0.013) |
| Height21 | Artery_Coronary | 0.5 | 0.149 (0.013) |
| Height21 | Artery_Coronary | 1 | 0.149 (0.013) |
| Height21 | Artery_Coronary | All | 0.146 (0.013) |
| Height21 | Artery_Tibial | 1e.06 | 0.155 (0.013) |
| Height21 | Artery_Tibial | 1e.05 | 0.164 (0.013) |
| Height21 | Artery_Tibial | 1e.04 | 0.171 (0.013) |
| Height21 | Artery_Tibial | 0.001 | 0.181 (0.013) |
| Height21 | Artery_Tibial | 0.01 | 0.189 (0.013) |
| Height21 | Artery_Tibial | 0.05 | 0.2 (0.013) |
| Height21 | Artery_Tibial | 0.1 | 0.204 (0.013) |
| Height21 | Artery_Tibial | 0.5 | 0.207 (0.013) |
| Height21 | Artery_Tibial | 1 | 0.207 (0.013) |
| Height21 | Artery_Tibial | All | 0.204 (0.013) |
| Height21 | Brain_Amygdala | 1e.06 | 0.094 (0.013) |
| Height21 | Brain_Amygdala | 1e.05 | 0.094 (0.013) |
| Height21 | Brain_Amygdala | 1e.04 | 0.103 (0.013) |
| Height21 | Brain_Amygdala | 0.001 | 0.108 (0.013) |
| Height21 | Brain_Amygdala | 0.01 | 0.117 (0.013) |
| Height21 | Brain_Amygdala | 0.05 | 0.118 (0.013) |
| Height21 | Brain_Amygdala | 0.1 | 0.122 (0.013) |
| Height21 | Brain_Amygdala | 0.5 | 0.126 (0.013) |
| Height21 | Brain_Amygdala | 1 | 0.127 (0.013) |
| Height21 | Brain_Amygdala | All | 0.123 (0.013) |
| Height21 | Brain_Anterior_cingulate_cortex_BA24 | 1e.06 | 0.079 (0.013) |
| Height21 | Brain_Anterior_cingulate_cortex_BA24 | 1e.05 | 0.079 (0.013) |
| Height21 | Brain_Anterior_cingulate_cortex_BA24 | 1e.04 | 0.077 (0.014) |
| Height21 | Brain_Anterior_cingulate_cortex_BA24 | 0.001 | 0.087 (0.013) |
| Height21 | Brain_Anterior_cingulate_cortex_BA24 | 0.01 | 0.096 (0.013) |
| Height21 | Brain_Anterior_cingulate_cortex_BA24 | 0.05 | 0.102 (0.013) |
| Height21 | Brain_Anterior_cingulate_cortex_BA24 | 0.1 | 0.105 (0.013) |
| Height21 | Brain_Anterior_cingulate_cortex_BA24 | 0.5 | 0.108 (0.013) |
| Height21 | Brain_Anterior_cingulate_cortex_BA24 | 1 | 0.108 (0.013) |
| Height21 | Brain_Anterior_cingulate_cortex_BA24 | All | 0.103 (0.013) |
| Height21 | Brain_Caudate_basal_ganglia | 1e.06 | 0.092 (0.013) |
| Height21 | Brain_Caudate_basal_ganglia | 1e.05 | 0.091 (0.013) |
| Height21 | Brain_Caudate_basal_ganglia | 1e.04 | 0.095 (0.013) |
| Height21 | Brain_Caudate_basal_ganglia | 0.001 | 0.099 (0.013) |
| Height21 | Brain_Caudate_basal_ganglia | 0.01 | 0.112 (0.013) |
| Height21 | Brain_Caudate_basal_ganglia | 0.05 | 0.118 (0.013) |
| Height21 | Brain_Caudate_basal_ganglia | 0.1 | 0.119 (0.013) |
| Height21 | Brain_Caudate_basal_ganglia | 0.5 | 0.123 (0.013) |
| Height21 | Brain_Caudate_basal_ganglia | 1 | 0.123 (0.013) |
| Height21 | Brain_Caudate_basal_ganglia | All | 0.119 (0.013) |
| Height21 | Brain_Cerebellar_Hemisphere | 1e.06 | 0.116 (0.013) |
| Height21 | Brain_Cerebellar_Hemisphere | 1e.05 | 0.119 (0.013) |
| Height21 | Brain_Cerebellar_Hemisphere | 1e.04 | 0.127 (0.013) |
| Height21 | Brain_Cerebellar_Hemisphere | 0.001 | 0.137 (0.013) |
| Height21 | Brain_Cerebellar_Hemisphere | 0.01 | 0.151 (0.013) |
| Height21 | Brain_Cerebellar_Hemisphere | 0.05 | 0.147 (0.013) |
| Height21 | Brain_Cerebellar_Hemisphere | 0.1 | 0.147 (0.013) |
| Height21 | Brain_Cerebellar_Hemisphere | 0.5 | 0.147 (0.013) |
| Height21 | Brain_Cerebellar_Hemisphere | 1 | 0.148 (0.013) |
| Height21 | Brain_Cerebellar_Hemisphere | All | 0.15 (0.013) |
| Height21 | Brain_Cerebellum | 1e.06 | 0.122 (0.013) |
| Height21 | Brain_Cerebellum | 1e.05 | 0.131 (0.013) |
| Height21 | Brain_Cerebellum | 1e.04 | 0.137 (0.013) |
| Height21 | Brain_Cerebellum | 0.001 | 0.147 (0.013) |
| Height21 | Brain_Cerebellum | 0.01 | 0.16 (0.013) |
| Height21 | Brain_Cerebellum | 0.05 | 0.163 (0.013) |
| Height21 | Brain_Cerebellum | 0.1 | 0.163 (0.013) |
| Height21 | Brain_Cerebellum | 0.5 | 0.164 (0.013) |
| Height21 | Brain_Cerebellum | 1 | 0.162 (0.013) |
| Height21 | Brain_Cerebellum | All | 0.162 (0.013) |
| Height21 | Brain_Cortex | 1e.06 | 0.111 (0.013) |
| Height21 | Brain_Cortex | 1e.05 | 0.12 (0.013) |
| Height21 | Brain_Cortex | 1e.04 | 0.125 (0.013) |
| Height21 | Brain_Cortex | 0.001 | 0.131 (0.013) |
| Height21 | Brain_Cortex | 0.01 | 0.135 (0.013) |
| Height21 | Brain_Cortex | 0.05 | 0.135 (0.013) |
| Height21 | Brain_Cortex | 0.1 | 0.134 (0.013) |
| Height21 | Brain_Cortex | 0.5 | 0.139 (0.013) |
| Height21 | Brain_Cortex | 1 | 0.14 (0.013) |
| Height21 | Brain_Cortex | All | 0.137 (0.013) |
| Height21 | Brain_Frontal_Cortex_BA9 | 1e.06 | 0.09 (0.013) |
| Height21 | Brain_Frontal_Cortex_BA9 | 1e.05 | 0.099 (0.013) |
| Height21 | Brain_Frontal_Cortex_BA9 | 1e.04 | 0.1 (0.013) |
| Height21 | Brain_Frontal_Cortex_BA9 | 0.001 | 0.107 (0.013) |
| Height21 | Brain_Frontal_Cortex_BA9 | 0.01 | 0.114 (0.013) |
| Height21 | Brain_Frontal_Cortex_BA9 | 0.05 | 0.121 (0.013) |
| Height21 | Brain_Frontal_Cortex_BA9 | 0.1 | 0.125 (0.013) |
| Height21 | Brain_Frontal_Cortex_BA9 | 0.5 | 0.131 (0.013) |
| Height21 | Brain_Frontal_Cortex_BA9 | 1 | 0.131 (0.013) |
| Height21 | Brain_Frontal_Cortex_BA9 | All | 0.126 (0.013) |
| Height21 | Brain_Hippocampus | 1e.06 | 0.065 (0.014) |
| Height21 | Brain_Hippocampus | 1e.05 | 0.069 (0.014) |
| Height21 | Brain_Hippocampus | 1e.04 | 0.077 (0.014) |
| Height21 | Brain_Hippocampus | 0.001 | 0.086 (0.013) |
| Height21 | Brain_Hippocampus | 0.01 | 0.099 (0.013) |
| Height21 | Brain_Hippocampus | 0.05 | 0.101 (0.013) |
| Height21 | Brain_Hippocampus | 0.1 | 0.103 (0.013) |
| Height21 | Brain_Hippocampus | 0.5 | 0.106 (0.013) |
| Height21 | Brain_Hippocampus | 1 | 0.105 (0.013) |
| Height21 | Brain_Hippocampus | All | 0.1 (0.013) |
| Height21 | Brain_Hypothalamus | 1e.06 | 0.078 (0.014) |
| Height21 | Brain_Hypothalamus | 1e.05 | 0.087 (0.013) |
| Height21 | Brain_Hypothalamus | 1e.04 | 0.086 (0.013) |
| Height21 | Brain_Hypothalamus | 0.001 | 0.09 (0.013) |
| Height21 | Brain_Hypothalamus | 0.01 | 0.096 (0.013) |
| Height21 | Brain_Hypothalamus | 0.05 | 0.109 (0.013) |
| Height21 | Brain_Hypothalamus | 0.1 | 0.11 (0.013) |
| Height21 | Brain_Hypothalamus | 0.5 | 0.105 (0.013) |
| Height21 | Brain_Hypothalamus | 1 | 0.105 (0.013) |
| Height21 | Brain_Hypothalamus | All | 0.106 (0.013) |
| Height21 | Brain_Nucleus_accumbens_basal_ganglia | 1e.06 | 0.086 (0.013) |
| Height21 | Brain_Nucleus_accumbens_basal_ganglia | 1e.05 | 0.095 (0.013) |
| Height21 | Brain_Nucleus_accumbens_basal_ganglia | 1e.04 | 0.095 (0.013) |
| Height21 | Brain_Nucleus_accumbens_basal_ganglia | 0.001 | 0.102 (0.013) |
| Height21 | Brain_Nucleus_accumbens_basal_ganglia | 0.01 | 0.116 (0.013) |
| Height21 | Brain_Nucleus_accumbens_basal_ganglia | 0.05 | 0.119 (0.013) |
| Height21 | Brain_Nucleus_accumbens_basal_ganglia | 0.1 | 0.123 (0.013) |
| Height21 | Brain_Nucleus_accumbens_basal_ganglia | 0.5 | 0.122 (0.013) |
| Height21 | Brain_Nucleus_accumbens_basal_ganglia | 1 | 0.121 (0.013) |
| Height21 | Brain_Nucleus_accumbens_basal_ganglia | All | 0.12 (0.013) |
| Height21 | Brain_Putamen_basal_ganglia | 1e.06 | 0.09 (0.013) |
| Height21 | Brain_Putamen_basal_ganglia | 1e.05 | 0.094 (0.013) |
| Height21 | Brain_Putamen_basal_ganglia | 1e.04 | 0.094 (0.013) |
| Height21 | Brain_Putamen_basal_ganglia | 0.001 | 0.105 (0.013) |
| Height21 | Brain_Putamen_basal_ganglia | 0.01 | 0.109 (0.013) |
| Height21 | Brain_Putamen_basal_ganglia | 0.05 | 0.112 (0.013) |
| Height21 | Brain_Putamen_basal_ganglia | 0.1 | 0.118 (0.013) |
| Height21 | Brain_Putamen_basal_ganglia | 0.5 | 0.116 (0.013) |
| Height21 | Brain_Putamen_basal_ganglia | 1 | 0.116 (0.013) |
| Height21 | Brain_Putamen_basal_ganglia | All | 0.115 (0.013) |
| Height21 | Brain_Spinal_cord_cervical_c-1 | 1e.06 | 0.073 (0.014) |
| Height21 | Brain_Spinal_cord_cervical_c-1 | 1e.05 | 0.076 (0.014) |
| Height21 | Brain_Spinal_cord_cervical_c-1 | 1e.04 | 0.078 (0.014) |
| Height21 | Brain_Spinal_cord_cervical_c-1 | 0.001 | 0.086 (0.013) |
| Height21 | Brain_Spinal_cord_cervical_c-1 | 0.01 | 0.092 (0.013) |
| Height21 | Brain_Spinal_cord_cervical_c-1 | 0.05 | 0.097 (0.013) |
| Height21 | Brain_Spinal_cord_cervical_c-1 | 0.1 | 0.099 (0.013) |
| Height21 | Brain_Spinal_cord_cervical_c-1 | 0.5 | 0.105 (0.013) |
| Height21 | Brain_Spinal_cord_cervical_c-1 | 1 | 0.106 (0.013) |
| Height21 | Brain_Spinal_cord_cervical_c-1 | All | 0.104 (0.013) |
| Height21 | Brain_Substantia_nigra | 1e.06 | 0.088 (0.013) |
| Height21 | Brain_Substantia_nigra | 1e.05 | 0.091 (0.013) |
| Height21 | Brain_Substantia_nigra | 1e.04 | 0.091 (0.013) |
| Height21 | Brain_Substantia_nigra | 0.001 | 0.092 (0.013) |
| Height21 | Brain_Substantia_nigra | 0.01 | 0.099 (0.013) |
| Height21 | Brain_Substantia_nigra | 0.05 | 0.103 (0.013) |
| Height21 | Brain_Substantia_nigra | 0.1 | 0.104 (0.013) |
| Height21 | Brain_Substantia_nigra | 0.5 | 0.103 (0.013) |
| Height21 | Brain_Substantia_nigra | 1 | 0.102 (0.013) |
| Height21 | Brain_Substantia_nigra | All | 0.102 (0.013) |
| Height21 | Breast_Mammary_Tissue | 1e.06 | 0.15 (0.013) |
| Height21 | Breast_Mammary_Tissue | 1e.05 | 0.155 (0.013) |
| Height21 | Breast_Mammary_Tissue | 1e.04 | 0.164 (0.013) |
| Height21 | Breast_Mammary_Tissue | 0.001 | 0.172 (0.013) |
| Height21 | Breast_Mammary_Tissue | 0.01 | 0.174 (0.013) |
| Height21 | Breast_Mammary_Tissue | 0.05 | 0.178 (0.013) |
| Height21 | Breast_Mammary_Tissue | 0.1 | 0.178 (0.013) |
| Height21 | Breast_Mammary_Tissue | 0.5 | 0.182 (0.013) |
| Height21 | Breast_Mammary_Tissue | 1 | 0.182 (0.013) |
| Height21 | Breast_Mammary_Tissue | All | 0.182 (0.013) |
| Height21 | Cells_EBV-transformed_lymphocytes | 1e.06 | 0.109 (0.013) |
| Height21 | Cells_EBV-transformed_lymphocytes | 1e.05 | 0.118 (0.013) |
| Height21 | Cells_EBV-transformed_lymphocytes | 1e.04 | 0.12 (0.013) |
| Height21 | Cells_EBV-transformed_lymphocytes | 0.001 | 0.126 (0.013) |
| Height21 | Cells_EBV-transformed_lymphocytes | 0.01 | 0.14 (0.013) |
| Height21 | Cells_EBV-transformed_lymphocytes | 0.05 | 0.146 (0.013) |
| Height21 | Cells_EBV-transformed_lymphocytes | 0.1 | 0.147 (0.013) |
| Height21 | Cells_EBV-transformed_lymphocytes | 0.5 | 0.148 (0.013) |
| Height21 | Cells_EBV-transformed_lymphocytes | 1 | 0.147 (0.013) |
| Height21 | Cells_EBV-transformed_lymphocytes | All | 0.144 (0.013) |
| Height21 | Cells_Transformed_fibroblasts | 1e.06 | 0.129 (0.013) |
| Height21 | Cells_Transformed_fibroblasts | 1e.05 | 0.137 (0.013) |
| Height21 | Cells_Transformed_fibroblasts | 1e.04 | 0.145 (0.013) |
| Height21 | Cells_Transformed_fibroblasts | 0.001 | 0.154 (0.013) |
| Height21 | Cells_Transformed_fibroblasts | 0.01 | 0.171 (0.013) |
| Height21 | Cells_Transformed_fibroblasts | 0.05 | 0.18 (0.013) |
| Height21 | Cells_Transformed_fibroblasts | 0.1 | 0.184 (0.013) |
| Height21 | Cells_Transformed_fibroblasts | 0.5 | 0.189 (0.013) |
| Height21 | Cells_Transformed_fibroblasts | 1 | 0.19 (0.013) |
| Height21 | Cells_Transformed_fibroblasts | All | 0.188 (0.013) |
| Height21 | CMC.BRAIN.RNASEQ | 1e.06 | 0.121 (0.013) |
| Height21 | CMC.BRAIN.RNASEQ | 1e.05 | 0.127 (0.013) |
| Height21 | CMC.BRAIN.RNASEQ | 1e.04 | 0.131 (0.013) |
| Height21 | CMC.BRAIN.RNASEQ | 0.001 | 0.142 (0.013) |
| Height21 | CMC.BRAIN.RNASEQ | 0.01 | 0.167 (0.013) |
| Height21 | CMC.BRAIN.RNASEQ | 0.05 | 0.177 (0.013) |
| Height21 | CMC.BRAIN.RNASEQ | 0.1 | 0.18 (0.013) |
| Height21 | CMC.BRAIN.RNASEQ | 0.5 | 0.18 (0.013) |
| Height21 | CMC.BRAIN.RNASEQ | 1 | 0.18 (0.013) |
| Height21 | CMC.BRAIN.RNASEQ | All | 0.184 (0.013) |
| Height21 | CMC.BRAIN.RNASEQ_SPLICING | 1e.06 | 0.115 (0.013) |
| Height21 | CMC.BRAIN.RNASEQ_SPLICING | 1e.05 | 0.115 (0.013) |
| Height21 | CMC.BRAIN.RNASEQ_SPLICING | 1e.04 | 0.115 (0.013) |
| Height21 | CMC.BRAIN.RNASEQ_SPLICING | 0.001 | 0.123 (0.013) |
| Height21 | CMC.BRAIN.RNASEQ_SPLICING | 0.01 | 0.137 (0.013) |
| Height21 | CMC.BRAIN.RNASEQ_SPLICING | 0.05 | 0.144 (0.013) |
| Height21 | CMC.BRAIN.RNASEQ_SPLICING | 0.1 | 0.145 (0.013) |
| Height21 | CMC.BRAIN.RNASEQ_SPLICING | 0.5 | 0.147 (0.013) |
| Height21 | CMC.BRAIN.RNASEQ_SPLICING | 1 | 0.147 (0.013) |
| Height21 | CMC.BRAIN.RNASEQ_SPLICING | All | 0.147 (0.013) |
| Height21 | Colon_Sigmoid | 1e.06 | 0.103 (0.013) |
| Height21 | Colon_Sigmoid | 1e.05 | 0.108 (0.013) |
| Height21 | Colon_Sigmoid | 1e.04 | 0.117 (0.013) |
| Height21 | Colon_Sigmoid | 0.001 | 0.128 (0.013) |
| Height21 | Colon_Sigmoid | 0.01 | 0.146 (0.013) |
| Height21 | Colon_Sigmoid | 0.05 | 0.152 (0.013) |
| Height21 | Colon_Sigmoid | 0.1 | 0.152 (0.013) |
| Height21 | Colon_Sigmoid | 0.5 | 0.159 (0.013) |
| Height21 | Colon_Sigmoid | 1 | 0.16 (0.013) |
| Height21 | Colon_Sigmoid | All | 0.156 (0.013) |
| Height21 | Colon_Transverse | 1e.06 | 0.121 (0.013) |
| Height21 | Colon_Transverse | 1e.05 | 0.131 (0.013) |
| Height21 | Colon_Transverse | 1e.04 | 0.139 (0.013) |
| Height21 | Colon_Transverse | 0.001 | 0.151 (0.013) |
| Height21 | Colon_Transverse | 0.01 | 0.158 (0.013) |
| Height21 | Colon_Transverse | 0.05 | 0.162 (0.013) |
| Height21 | Colon_Transverse | 0.1 | 0.163 (0.013) |
| Height21 | Colon_Transverse | 0.5 | 0.17 (0.013) |
| Height21 | Colon_Transverse | 1 | 0.171 (0.013) |
| Height21 | Colon_Transverse | All | 0.17 (0.013) |
| Height21 | Esophagus_Gastroesophageal_Junction | 1e.06 | 0.13 (0.013) |
| Height21 | Esophagus_Gastroesophageal_Junction | 1e.05 | 0.136 (0.013) |
| Height21 | Esophagus_Gastroesophageal_Junction | 1e.04 | 0.141 (0.013) |
| Height21 | Esophagus_Gastroesophageal_Junction | 0.001 | 0.149 (0.013) |
| Height21 | Esophagus_Gastroesophageal_Junction | 0.01 | 0.161 (0.013) |
| Height21 | Esophagus_Gastroesophageal_Junction | 0.05 | 0.173 (0.013) |
| Height21 | Esophagus_Gastroesophageal_Junction | 0.1 | 0.172 (0.013) |
| Height21 | Esophagus_Gastroesophageal_Junction | 0.5 | 0.177 (0.013) |
| Height21 | Esophagus_Gastroesophageal_Junction | 1 | 0.178 (0.013) |
| Height21 | Esophagus_Gastroesophageal_Junction | All | 0.175 (0.013) |
| Height21 | Esophagus_Mucosa | 1e.06 | 0.137 (0.013) |
| Height21 | Esophagus_Mucosa | 1e.05 | 0.15 (0.013) |
| Height21 | Esophagus_Mucosa | 1e.04 | 0.157 (0.013) |
| Height21 | Esophagus_Mucosa | 0.001 | 0.17 (0.013) |
| Height21 | Esophagus_Mucosa | 0.01 | 0.185 (0.013) |
| Height21 | Esophagus_Mucosa | 0.05 | 0.192 (0.013) |
| Height21 | Esophagus_Mucosa | 0.1 | 0.19 (0.013) |
| Height21 | Esophagus_Mucosa | 0.5 | 0.194 (0.013) |
| Height21 | Esophagus_Mucosa | 1 | 0.194 (0.013) |
| Height21 | Esophagus_Mucosa | All | 0.193 (0.013) |
| Height21 | Esophagus_Muscularis | 1e.06 | 0.136 (0.013) |
| Height21 | Esophagus_Muscularis | 1e.05 | 0.149 (0.013) |
| Height21 | Esophagus_Muscularis | 1e.04 | 0.157 (0.013) |
| Height21 | Esophagus_Muscularis | 0.001 | 0.17 (0.013) |
| Height21 | Esophagus_Muscularis | 0.01 | 0.179 (0.013) |
| Height21 | Esophagus_Muscularis | 0.05 | 0.19 (0.013) |
| Height21 | Esophagus_Muscularis | 0.1 | 0.196 (0.013) |
| Height21 | Esophagus_Muscularis | 0.5 | 0.196 (0.013) |
| Height21 | Esophagus_Muscularis | 1 | 0.196 (0.013) |
| Height21 | Esophagus_Muscularis | All | 0.195 (0.013) |
| Height21 | Heart_Atrial_Appendage | 1e.06 | 0.101 (0.013) |
| Height21 | Heart_Atrial_Appendage | 1e.05 | 0.112 (0.013) |
| Height21 | Heart_Atrial_Appendage | 1e.04 | 0.126 (0.013) |
| Height21 | Heart_Atrial_Appendage | 0.001 | 0.138 (0.013) |
| Height21 | Heart_Atrial_Appendage | 0.01 | 0.149 (0.013) |
| Height21 | Heart_Atrial_Appendage | 0.05 | 0.157 (0.013) |
| Height21 | Heart_Atrial_Appendage | 0.1 | 0.158 (0.013) |
| Height21 | Heart_Atrial_Appendage | 0.5 | 0.162 (0.013) |
| Height21 | Heart_Atrial_Appendage | 1 | 0.163 (0.013) |
| Height21 | Heart_Atrial_Appendage | All | 0.162 (0.013) |
| Height21 | Heart_Left_Ventricle | 1e.06 | 0.117 (0.013) |
| Height21 | Heart_Left_Ventricle | 1e.05 | 0.123 (0.013) |
| Height21 | Heart_Left_Ventricle | 1e.04 | 0.128 (0.013) |
| Height21 | Heart_Left_Ventricle | 0.001 | 0.138 (0.013) |
| Height21 | Heart_Left_Ventricle | 0.01 | 0.153 (0.013) |
| Height21 | Heart_Left_Ventricle | 0.05 | 0.151 (0.013) |
| Height21 | Heart_Left_Ventricle | 0.1 | 0.153 (0.013) |
| Height21 | Heart_Left_Ventricle | 0.5 | 0.159 (0.013) |
| Height21 | Heart_Left_Ventricle | 1 | 0.159 (0.013) |
| Height21 | Heart_Left_Ventricle | All | 0.158 (0.013) |
| Height21 | Liver | 1e.06 | 0.106 (0.013) |
| Height21 | Liver | 1e.05 | 0.112 (0.013) |
| Height21 | Liver | 1e.04 | 0.124 (0.013) |
| Height21 | Liver | 0.001 | 0.128 (0.013) |
| Height21 | Liver | 0.01 | 0.139 (0.013) |
| Height21 | Liver | 0.05 | 0.144 (0.013) |
| Height21 | Liver | 0.1 | 0.142 (0.013) |
| Height21 | Liver | 0.5 | 0.147 (0.013) |
| Height21 | Liver | 1 | 0.146 (0.013) |
| Height21 | Liver | All | 0.145 (0.013) |
| Height21 | Lung | 1e.06 | 0.137 (0.013) |
| Height21 | Lung | 1e.05 | 0.146 (0.013) |
| Height21 | Lung | 1e.04 | 0.152 (0.013) |
| Height21 | Lung | 0.001 | 0.164 (0.013) |
| Height21 | Lung | 0.01 | 0.177 (0.013) |
| Height21 | Lung | 0.05 | 0.187 (0.013) |
| Height21 | Lung | 0.1 | 0.185 (0.013) |
| Height21 | Lung | 0.5 | 0.184 (0.013) |
| Height21 | Lung | 1 | 0.184 (0.013) |
| Height21 | Lung | All | 0.185 (0.013) |
| Height21 | METSIM.ADIPOSE.RNASEQ | 1e.06 | 0.132 (0.013) |
| Height21 | METSIM.ADIPOSE.RNASEQ | 1e.05 | 0.136 (0.013) |
| Height21 | METSIM.ADIPOSE.RNASEQ | 1e.04 | 0.15 (0.013) |
| Height21 | METSIM.ADIPOSE.RNASEQ | 0.001 | 0.164 (0.013) |
| Height21 | METSIM.ADIPOSE.RNASEQ | 0.01 | 0.175 (0.013) |
| Height21 | METSIM.ADIPOSE.RNASEQ | 0.05 | 0.176 (0.013) |
| Height21 | METSIM.ADIPOSE.RNASEQ | 0.1 | 0.181 (0.013) |
| Height21 | METSIM.ADIPOSE.RNASEQ | 0.5 | 0.179 (0.013) |
| Height21 | METSIM.ADIPOSE.RNASEQ | 1 | 0.179 (0.013) |
| Height21 | METSIM.ADIPOSE.RNASEQ | All | 0.178 (0.013) |
| Height21 | Minor_Salivary_Gland | 1e.06 | 0.078 (0.014) |
| Height21 | Minor_Salivary_Gland | 1e.05 | 0.079 (0.013) |
| Height21 | Minor_Salivary_Gland | 1e.04 | 0.078 (0.014) |
| Height21 | Minor_Salivary_Gland | 0.001 | 0.092 (0.013) |
| Height21 | Minor_Salivary_Gland | 0.01 | 0.094 (0.013) |
| Height21 | Minor_Salivary_Gland | 0.05 | 0.101 (0.013) |
| Height21 | Minor_Salivary_Gland | 0.1 | 0.107 (0.013) |
| Height21 | Minor_Salivary_Gland | 0.5 | 0.103 (0.013) |
| Height21 | Minor_Salivary_Gland | 1 | 0.102 (0.013) |
| Height21 | Minor_Salivary_Gland | All | 0.106 (0.013) |
| Height21 | Muscle_Skeletal | 1e.06 | 0.137 (0.013) |
| Height21 | Muscle_Skeletal | 1e.05 | 0.149 (0.013) |
| Height21 | Muscle_Skeletal | 1e.04 | 0.156 (0.013) |
| Height21 | Muscle_Skeletal | 0.001 | 0.161 (0.013) |
| Height21 | Muscle_Skeletal | 0.01 | 0.17 (0.013) |
| Height21 | Muscle_Skeletal | 0.05 | 0.178 (0.013) |
| Height21 | Muscle_Skeletal | 0.1 | 0.179 (0.013) |
| Height21 | Muscle_Skeletal | 0.5 | 0.184 (0.013) |
| Height21 | Muscle_Skeletal | 1 | 0.185 (0.013) |
| Height21 | Muscle_Skeletal | All | 0.184 (0.013) |
| Height21 | Nerve_Tibial | 1e.06 | 0.154 (0.013) |
| Height21 | Nerve_Tibial | 1e.05 | 0.161 (0.013) |
| Height21 | Nerve_Tibial | 1e.04 | 0.168 (0.013) |
| Height21 | Nerve_Tibial | 0.001 | 0.183 (0.013) |
| Height21 | Nerve_Tibial | 0.01 | 0.201 (0.013) |
| Height21 | Nerve_Tibial | 0.05 | 0.211 (0.013) |
| Height21 | Nerve_Tibial | 0.1 | 0.213 (0.013) |
| Height21 | Nerve_Tibial | 0.5 | 0.22 (0.013) |
| Height21 | Nerve_Tibial | 1 | 0.219 (0.013) |
| Height21 | Nerve_Tibial | All | 0.22 (0.013) |
| Height21 | NTR.BLOOD.RNAARR | 1e.06 | 0.11 (0.013) |
| Height21 | NTR.BLOOD.RNAARR | 1e.05 | 0.117 (0.013) |
| Height21 | NTR.BLOOD.RNAARR | 1e.04 | 0.124 (0.013) |
| Height21 | NTR.BLOOD.RNAARR | 0.001 | 0.124 (0.013) |
| Height21 | NTR.BLOOD.RNAARR | 0.01 | 0.132 (0.013) |
| Height21 | NTR.BLOOD.RNAARR | 0.05 | 0.138 (0.013) |
| Height21 | NTR.BLOOD.RNAARR | 0.1 | 0.14 (0.013) |
| Height21 | NTR.BLOOD.RNAARR | 0.5 | 0.154 (0.013) |
| Height21 | NTR.BLOOD.RNAARR | 1 | 0.154 (0.013) |
| Height21 | NTR.BLOOD.RNAARR | All | 0.155 (0.013) |
| Height21 | Ovary | 1e.06 | 0.086 (0.013) |
| Height21 | Ovary | 1e.05 | 0.088 (0.013) |
| Height21 | Ovary | 1e.04 | 0.093 (0.013) |
| Height21 | Ovary | 0.001 | 0.102 (0.013) |
| Height21 | Ovary | 0.01 | 0.115 (0.013) |
| Height21 | Ovary | 0.05 | 0.121 (0.013) |
| Height21 | Ovary | 0.1 | 0.119 (0.013) |
| Height21 | Ovary | 0.5 | 0.115 (0.013) |
| Height21 | Ovary | 1 | 0.117 (0.013) |
| Height21 | Ovary | All | 0.117 (0.013) |
| Height21 | Pancreas | 1e.06 | 0.126 (0.013) |
| Height21 | Pancreas | 1e.05 | 0.138 (0.013) |
| Height21 | Pancreas | 1e.04 | 0.14 (0.013) |
| Height21 | Pancreas | 0.001 | 0.154 (0.013) |
| Height21 | Pancreas | 0.01 | 0.161 (0.013) |
| Height21 | Pancreas | 0.05 | 0.17 (0.013) |
| Height21 | Pancreas | 0.1 | 0.165 (0.013) |
| Height21 | Pancreas | 0.5 | 0.167 (0.013) |
| Height21 | Pancreas | 1 | 0.166 (0.013) |
| Height21 | Pancreas | All | 0.167 (0.013) |
| Height21 | Pituitary | 1e.06 | 0.123 (0.013) |
| Height21 | Pituitary | 1e.05 | 0.138 (0.013) |
| Height21 | Pituitary | 1e.04 | 0.135 (0.013) |
| Height21 | Pituitary | 0.001 | 0.146 (0.013) |
| Height21 | Pituitary | 0.01 | 0.155 (0.013) |
| Height21 | Pituitary | 0.05 | 0.16 (0.013) |
| Height21 | Pituitary | 0.1 | 0.163 (0.013) |
| Height21 | Pituitary | 0.5 | 0.161 (0.013) |
| Height21 | Pituitary | 1 | 0.159 (0.013) |
| Height21 | Pituitary | All | 0.166 (0.013) |
| Height21 | Prostate | 1e.06 | 0.077 (0.014) |
| Height21 | Prostate | 1e.05 | 0.086 (0.013) |
| Height21 | Prostate | 1e.04 | 0.092 (0.013) |
| Height21 | Prostate | 0.001 | 0.102 (0.013) |
| Height21 | Prostate | 0.01 | 0.108 (0.013) |
| Height21 | Prostate | 0.05 | 0.115 (0.013) |
| Height21 | Prostate | 0.1 | 0.117 (0.013) |
| Height21 | Prostate | 0.5 | 0.121 (0.013) |
| Height21 | Prostate | 1 | 0.122 (0.013) |
| Height21 | Prostate | All | 0.119 (0.013) |
| Height21 | Skin_Not_Sun_Exposed_Suprapubic | 1e.06 | 0.136 (0.013) |
| Height21 | Skin_Not_Sun_Exposed_Suprapubic | 1e.05 | 0.145 (0.013) |
| Height21 | Skin_Not_Sun_Exposed_Suprapubic | 1e.04 | 0.154 (0.013) |
| Height21 | Skin_Not_Sun_Exposed_Suprapubic | 0.001 | 0.16 (0.013) |
| Height21 | Skin_Not_Sun_Exposed_Suprapubic | 0.01 | 0.171 (0.013) |
| Height21 | Skin_Not_Sun_Exposed_Suprapubic | 0.05 | 0.179 (0.013) |
| Height21 | Skin_Not_Sun_Exposed_Suprapubic | 0.1 | 0.181 (0.013) |
| Height21 | Skin_Not_Sun_Exposed_Suprapubic | 0.5 | 0.183 (0.013) |
| Height21 | Skin_Not_Sun_Exposed_Suprapubic | 1 | 0.182 (0.013) |
| Height21 | Skin_Not_Sun_Exposed_Suprapubic | All | 0.181 (0.013) |
| Height21 | Skin_Sun_Exposed_Lower_leg | 1e.06 | 0.145 (0.013) |
| Height21 | Skin_Sun_Exposed_Lower_leg | 1e.05 | 0.153 (0.013) |
| Height21 | Skin_Sun_Exposed_Lower_leg | 1e.04 | 0.16 (0.013) |
| Height21 | Skin_Sun_Exposed_Lower_leg | 0.001 | 0.18 (0.013) |
| Height21 | Skin_Sun_Exposed_Lower_leg | 0.01 | 0.192 (0.013) |
| Height21 | Skin_Sun_Exposed_Lower_leg | 0.05 | 0.202 (0.013) |
| Height21 | Skin_Sun_Exposed_Lower_leg | 0.1 | 0.206 (0.013) |
| Height21 | Skin_Sun_Exposed_Lower_leg | 0.5 | 0.209 (0.013) |
| Height21 | Skin_Sun_Exposed_Lower_leg | 1 | 0.208 (0.013) |
| Height21 | Skin_Sun_Exposed_Lower_leg | All | 0.207 (0.013) |
| Height21 | Small_Intestine_Terminal_Ileum | 1e.06 | 0.103 (0.013) |
| Height21 | Small_Intestine_Terminal_Ileum | 1e.05 | 0.107 (0.013) |
| Height21 | Small_Intestine_Terminal_Ileum | 1e.04 | 0.108 (0.013) |
| Height21 | Small_Intestine_Terminal_Ileum | 0.001 | 0.116 (0.013) |
| Height21 | Small_Intestine_Terminal_Ileum | 0.01 | 0.122 (0.013) |
| Height21 | Small_Intestine_Terminal_Ileum | 0.05 | 0.125 (0.013) |
| Height21 | Small_Intestine_Terminal_Ileum | 0.1 | 0.127 (0.013) |
| Height21 | Small_Intestine_Terminal_Ileum | 0.5 | 0.13 (0.013) |
| Height21 | Small_Intestine_Terminal_Ileum | 1 | 0.131 (0.013) |
| Height21 | Small_Intestine_Terminal_Ileum | All | 0.129 (0.013) |
| Height21 | Spleen | 1e.06 | 0.136 (0.013) |
| Height21 | Spleen | 1e.05 | 0.147 (0.013) |
| Height21 | Spleen | 1e.04 | 0.145 (0.013) |
| Height21 | Spleen | 0.001 | 0.153 (0.013) |
| Height21 | Spleen | 0.01 | 0.165 (0.013) |
| Height21 | Spleen | 0.05 | 0.167 (0.013) |
| Height21 | Spleen | 0.1 | 0.167 (0.013) |
| Height21 | Spleen | 0.5 | 0.166 (0.013) |
| Height21 | Spleen | 1 | 0.166 (0.013) |
| Height21 | Spleen | All | 0.171 (0.013) |
| Height21 | Stomach | 1e.06 | 0.132 (0.013) |
| Height21 | Stomach | 1e.05 | 0.139 (0.013) |
| Height21 | Stomach | 1e.04 | 0.147 (0.013) |
| Height21 | Stomach | 0.001 | 0.153 (0.013) |
| Height21 | Stomach | 0.01 | 0.163 (0.013) |
| Height21 | Stomach | 0.05 | 0.171 (0.013) |
| Height21 | Stomach | 0.1 | 0.167 (0.013) |
| Height21 | Stomach | 0.5 | 0.167 (0.013) |
| Height21 | Stomach | 1 | 0.166 (0.013) |
| Height21 | Stomach | All | 0.168 (0.013) |
| Height21 | Testis | 1e.06 | 0.144 (0.013) |
| Height21 | Testis | 1e.05 | 0.15 (0.013) |
| Height21 | Testis | 1e.04 | 0.163 (0.013) |
| Height21 | Testis | 0.001 | 0.179 (0.013) |
| Height21 | Testis | 0.01 | 0.185 (0.013) |
| Height21 | Testis | 0.05 | 0.193 (0.013) |
| Height21 | Testis | 0.1 | 0.191 (0.013) |
| Height21 | Testis | 0.5 | 0.191 (0.013) |
| Height21 | Testis | 1 | 0.192 (0.013) |
| Height21 | Testis | All | 0.193 (0.013) |
| Height21 | Thyroid | 1e.06 | 0.159 (0.013) |
| Height21 | Thyroid | 1e.05 | 0.171 (0.013) |
| Height21 | Thyroid | 1e.04 | 0.178 (0.013) |
| Height21 | Thyroid | 0.001 | 0.188 (0.013) |
| Height21 | Thyroid | 0.01 | 0.198 (0.013) |
| Height21 | Thyroid | 0.05 | 0.203 (0.013) |
| Height21 | Thyroid | 0.1 | 0.204 (0.013) |
| Height21 | Thyroid | 0.5 | 0.205 (0.013) |
| Height21 | Thyroid | 1 | 0.204 (0.013) |
| Height21 | Thyroid | All | 0.204 (0.013) |
| Height21 | Uterus | 1e.06 | 0.073 (0.014) |
| Height21 | Uterus | 1e.05 | 0.083 (0.013) |
| Height21 | Uterus | 1e.04 | 0.079 (0.013) |
| Height21 | Uterus | 0.001 | 0.08 (0.013) |
| Height21 | Uterus | 0.01 | 0.095 (0.013) |
| Height21 | Uterus | 0.05 | 0.099 (0.013) |
| Height21 | Uterus | 0.1 | 0.098 (0.013) |
| Height21 | Uterus | 0.5 | 0.102 (0.013) |
| Height21 | Uterus | 1 | 0.104 (0.013) |
| Height21 | Uterus | All | 0.101 (0.013) |
| Height21 | Vagina | 1e.06 | 0.093 (0.013) |
| Height21 | Vagina | 1e.05 | 0.091 (0.013) |
| Height21 | Vagina | 1e.04 | 0.096 (0.013) |
| Height21 | Vagina | 0.001 | 0.107 (0.013) |
| Height21 | Vagina | 0.01 | 0.117 (0.013) |
| Height21 | Vagina | 0.05 | 0.111 (0.013) |
| Height21 | Vagina | 0.1 | 0.112 (0.013) |
| Height21 | Vagina | 0.5 | 0.118 (0.013) |
| Height21 | Vagina | 1 | 0.119 (0.013) |
| Height21 | Vagina | All | 0.12 (0.013) |
| Height21 | Whole_Blood | 1e.06 | 0.125 (0.013) |
| Height21 | Whole_Blood | 1e.05 | 0.133 (0.013) |
| Height21 | Whole_Blood | 1e.04 | 0.134 (0.013) |
| Height21 | Whole_Blood | 0.001 | 0.146 (0.013) |
| Height21 | Whole_Blood | 0.01 | 0.16 (0.013) |
| Height21 | Whole_Blood | 0.05 | 0.171 (0.013) |
| Height21 | Whole_Blood | 0.1 | 0.173 (0.013) |
| Height21 | Whole_Blood | 0.5 | 0.172 (0.013) |
| Height21 | Whole_Blood | 1 | 0.173 (0.013) |
| Height21 | Whole_Blood | All | 0.174 (0.013) |
| Height21 | YFS.BLOOD.RNAARR | 1e.06 | 0.134 (0.013) |
| Height21 | YFS.BLOOD.RNAARR | 1e.05 | 0.148 (0.013) |
| Height21 | YFS.BLOOD.RNAARR | 1e.04 | 0.155 (0.013) |
| Height21 | YFS.BLOOD.RNAARR | 0.001 | 0.167 (0.013) |
| Height21 | YFS.BLOOD.RNAARR | 0.01 | 0.182 (0.013) |
| Height21 | YFS.BLOOD.RNAARR | 0.05 | 0.186 (0.013) |
| Height21 | YFS.BLOOD.RNAARR | 0.1 | 0.191 (0.013) |
| Height21 | YFS.BLOOD.RNAARR | 0.5 | 0.194 (0.013) |
| Height21 | YFS.BLOOD.RNAARR | 1 | 0.194 (0.013) |
| Height21 | YFS.BLOOD.RNAARR | All | 0.192 (0.013) |
| BMI21 | Adipose_Subcutaneous | 1e.06 | 0.06 (0.014) |
| BMI21 | Adipose_Subcutaneous | 1e.05 | 0.063 (0.014) |
| BMI21 | Adipose_Subcutaneous | 1e.04 | 0.073 (0.014) |
| BMI21 | Adipose_Subcutaneous | 0.001 | 0.089 (0.014) |
| BMI21 | Adipose_Subcutaneous | 0.01 | 0.1 (0.014) |
| BMI21 | Adipose_Subcutaneous | 0.05 | 0.11 (0.014) |
| BMI21 | Adipose_Subcutaneous | 0.1 | 0.114 (0.014) |
| BMI21 | Adipose_Subcutaneous | 0.5 | 0.116 (0.014) |
| BMI21 | Adipose_Subcutaneous | 1 | 0.116 (0.014) |
| BMI21 | Adipose_Subcutaneous | All | 0.122 (0.014) |
| BMI21 | Adipose_Visceral_Omentum | 1e.06 | 0.053 (0.014) |
| BMI21 | Adipose_Visceral_Omentum | 1e.05 | 0.063 (0.014) |
| BMI21 | Adipose_Visceral_Omentum | 1e.04 | 0.071 (0.014) |
| BMI21 | Adipose_Visceral_Omentum | 0.001 | 0.087 (0.014) |
| BMI21 | Adipose_Visceral_Omentum | 0.01 | 0.092 (0.014) |
| BMI21 | Adipose_Visceral_Omentum | 0.05 | 0.098 (0.014) |
| BMI21 | Adipose_Visceral_Omentum | 0.1 | 0.1 (0.014) |
| BMI21 | Adipose_Visceral_Omentum | 0.5 | 0.102 (0.014) |
| BMI21 | Adipose_Visceral_Omentum | 1 | 0.104 (0.014) |
| BMI21 | Adipose_Visceral_Omentum | All | 0.099 (0.014) |
| BMI21 | Adrenal_Gland | 1e.06 | 0.049 (0.014) |
| BMI21 | Adrenal_Gland | 1e.05 | 0.057 (0.014) |
| BMI21 | Adrenal_Gland | 1e.04 | 0.062 (0.014) |
| BMI21 | Adrenal_Gland | 0.001 | 0.069 (0.014) |
| BMI21 | Adrenal_Gland | 0.01 | 0.074 (0.014) |
| BMI21 | Adrenal_Gland | 0.05 | 0.079 (0.014) |
| BMI21 | Adrenal_Gland | 0.1 | 0.082 (0.014) |
| BMI21 | Adrenal_Gland | 0.5 | 0.089 (0.014) |
| BMI21 | Adrenal_Gland | 1 | 0.089 (0.014) |
| BMI21 | Adrenal_Gland | All | 0.088 (0.014) |
| BMI21 | Artery_Aorta | 1e.06 | 0.042 (0.014) |
| BMI21 | Artery_Aorta | 1e.05 | 0.047 (0.014) |
| BMI21 | Artery_Aorta | 1e.04 | 0.052 (0.014) |
| BMI21 | Artery_Aorta | 0.001 | 0.064 (0.014) |
| BMI21 | Artery_Aorta | 0.01 | 0.076 (0.014) |
| BMI21 | Artery_Aorta | 0.05 | 0.085 (0.014) |
| BMI21 | Artery_Aorta | 0.1 | 0.086 (0.014) |
| BMI21 | Artery_Aorta | 0.5 | 0.09 (0.014) |
| BMI21 | Artery_Aorta | 1 | 0.089 (0.014) |
| BMI21 | Artery_Aorta | All | 0.089 (0.014) |
| BMI21 | Artery_Coronary | 1e.06 | 0.033 (0.014) |
| BMI21 | Artery_Coronary | 1e.05 | 0.039 (0.014) |
| BMI21 | Artery_Coronary | 1e.04 | 0.04 (0.014) |
| BMI21 | Artery_Coronary | 0.001 | 0.054 (0.014) |
| BMI21 | Artery_Coronary | 0.01 | 0.061 (0.014) |
| BMI21 | Artery_Coronary | 0.05 | 0.068 (0.014) |
| BMI21 | Artery_Coronary | 0.1 | 0.071 (0.014) |
| BMI21 | Artery_Coronary | 0.5 | 0.067 (0.014) |
| BMI21 | Artery_Coronary | 1 | 0.066 (0.014) |
| BMI21 | Artery_Coronary | All | 0.065 (0.014) |
| BMI21 | Artery_Tibial | 1e.06 | 0.067 (0.014) |
| BMI21 | Artery_Tibial | 1e.05 | 0.072 (0.014) |
| BMI21 | Artery_Tibial | 1e.04 | 0.085 (0.014) |
| BMI21 | Artery_Tibial | 0.001 | 0.099 (0.014) |
| BMI21 | Artery_Tibial | 0.01 | 0.114 (0.014) |
| BMI21 | Artery_Tibial | 0.05 | 0.118 (0.014) |
| BMI21 | Artery_Tibial | 0.1 | 0.119 (0.014) |
| BMI21 | Artery_Tibial | 0.5 | 0.12 (0.014) |
| BMI21 | Artery_Tibial | 1 | 0.12 (0.014) |
| BMI21 | Artery_Tibial | All | 0.123 (0.014) |
| BMI21 | Brain_Amygdala | 1e.06 | 0.045 (0.014) |
| BMI21 | Brain_Amygdala | 1e.05 | 0.051 (0.014) |
| BMI21 | Brain_Amygdala | 1e.04 | 0.057 (0.014) |
| BMI21 | Brain_Amygdala | 0.001 | 0.069 (0.014) |
| BMI21 | Brain_Amygdala | 0.01 | 0.073 (0.014) |
| BMI21 | Brain_Amygdala | 0.05 | 0.079 (0.014) |
| BMI21 | Brain_Amygdala | 0.1 | 0.083 (0.014) |
| BMI21 | Brain_Amygdala | 0.5 | 0.08 (0.014) |
| BMI21 | Brain_Amygdala | 1 | 0.08 (0.014) |
| BMI21 | Brain_Amygdala | All | 0.079 (0.014) |
| BMI21 | Brain_Anterior_cingulate_cortex_BA24 | 1e.06 | 0.042 (0.014) |
| BMI21 | Brain_Anterior_cingulate_cortex_BA24 | 1e.05 | 0.044 (0.014) |
| BMI21 | Brain_Anterior_cingulate_cortex_BA24 | 1e.04 | 0.05 (0.014) |
| BMI21 | Brain_Anterior_cingulate_cortex_BA24 | 0.001 | 0.068 (0.014) |
| BMI21 | Brain_Anterior_cingulate_cortex_BA24 | 0.01 | 0.081 (0.014) |
| BMI21 | Brain_Anterior_cingulate_cortex_BA24 | 0.05 | 0.086 (0.014) |
| BMI21 | Brain_Anterior_cingulate_cortex_BA24 | 0.1 | 0.087 (0.014) |
| BMI21 | Brain_Anterior_cingulate_cortex_BA24 | 0.5 | 0.087 (0.014) |
| BMI21 | Brain_Anterior_cingulate_cortex_BA24 | 1 | 0.088 (0.014) |
| BMI21 | Brain_Anterior_cingulate_cortex_BA24 | All | 0.097 (0.014) |
| BMI21 | Brain_Caudate_basal_ganglia | 1e.06 | 0.023 (0.014) |
| BMI21 | Brain_Caudate_basal_ganglia | 1e.05 | 0.027 (0.014) |
| BMI21 | Brain_Caudate_basal_ganglia | 1e.04 | 0.037 (0.014) |
| BMI21 | Brain_Caudate_basal_ganglia | 0.001 | 0.046 (0.014) |
| BMI21 | Brain_Caudate_basal_ganglia | 0.01 | 0.053 (0.014) |
| BMI21 | Brain_Caudate_basal_ganglia | 0.05 | 0.058 (0.014) |
| BMI21 | Brain_Caudate_basal_ganglia | 0.1 | 0.06 (0.014) |
| BMI21 | Brain_Caudate_basal_ganglia | 0.5 | 0.064 (0.014) |
| BMI21 | Brain_Caudate_basal_ganglia | 1 | 0.064 (0.014) |
| BMI21 | Brain_Caudate_basal_ganglia | All | 0.077 (0.014) |
| BMI21 | Brain_Cerebellar_Hemisphere | 1e.06 | 0.045 (0.014) |
| BMI21 | Brain_Cerebellar_Hemisphere | 1e.05 | 0.045 (0.014) |
| BMI21 | Brain_Cerebellar_Hemisphere | 1e.04 | 0.051 (0.014) |
| BMI21 | Brain_Cerebellar_Hemisphere | 0.001 | 0.067 (0.014) |
| BMI21 | Brain_Cerebellar_Hemisphere | 0.01 | 0.077 (0.014) |
| BMI21 | Brain_Cerebellar_Hemisphere | 0.05 | 0.083 (0.014) |
| BMI21 | Brain_Cerebellar_Hemisphere | 0.1 | 0.085 (0.014) |
| BMI21 | Brain_Cerebellar_Hemisphere | 0.5 | 0.084 (0.014) |
| BMI21 | Brain_Cerebellar_Hemisphere | 1 | 0.083 (0.014) |
| BMI21 | Brain_Cerebellar_Hemisphere | All | 0.092 (0.014) |
| BMI21 | Brain_Cerebellum | 1e.06 | 0.056 (0.014) |
| BMI21 | Brain_Cerebellum | 1e.05 | 0.057 (0.014) |
| BMI21 | Brain_Cerebellum | 1e.04 | 0.063 (0.014) |
| BMI21 | Brain_Cerebellum | 0.001 | 0.079 (0.014) |
| BMI21 | Brain_Cerebellum | 0.01 | 0.089 (0.014) |
| BMI21 | Brain_Cerebellum | 0.05 | 0.097 (0.014) |
| BMI21 | Brain_Cerebellum | 0.1 | 0.102 (0.014) |
| BMI21 | Brain_Cerebellum | 0.5 | 0.106 (0.014) |
| BMI21 | Brain_Cerebellum | 1 | 0.107 (0.014) |
| BMI21 | Brain_Cerebellum | All | 0.116 (0.014) |
| BMI21 | Brain_Cortex | 1e.06 | 0.044 (0.014) |
| BMI21 | Brain_Cortex | 1e.05 | 0.046 (0.014) |
| BMI21 | Brain_Cortex | 1e.04 | 0.047 (0.014) |
| BMI21 | Brain_Cortex | 0.001 | 0.059 (0.014) |
| BMI21 | Brain_Cortex | 0.01 | 0.074 (0.014) |
| BMI21 | Brain_Cortex | 0.05 | 0.077 (0.014) |
| BMI21 | Brain_Cortex | 0.1 | 0.08 (0.014) |
| BMI21 | Brain_Cortex | 0.5 | 0.083 (0.014) |
| BMI21 | Brain_Cortex | 1 | 0.083 (0.014) |
| BMI21 | Brain_Cortex | All | 0.092 (0.014) |
| BMI21 | Brain_Frontal_Cortex_BA9 | 1e.06 | 0.041 (0.014) |
| BMI21 | Brain_Frontal_Cortex_BA9 | 1e.05 | 0.049 (0.014) |
| BMI21 | Brain_Frontal_Cortex_BA9 | 1e.04 | 0.053 (0.014) |
| BMI21 | Brain_Frontal_Cortex_BA9 | 0.001 | 0.059 (0.014) |
| BMI21 | Brain_Frontal_Cortex_BA9 | 0.01 | 0.064 (0.014) |
| BMI21 | Brain_Frontal_Cortex_BA9 | 0.05 | 0.07 (0.014) |
| BMI21 | Brain_Frontal_Cortex_BA9 | 0.1 | 0.074 (0.014) |
| BMI21 | Brain_Frontal_Cortex_BA9 | 0.5 | 0.077 (0.014) |
| BMI21 | Brain_Frontal_Cortex_BA9 | 1 | 0.076 (0.014) |
| BMI21 | Brain_Frontal_Cortex_BA9 | All | 0.073 (0.014) |
| BMI21 | Brain_Hippocampus | 1e.06 | 0.033 (0.014) |
| BMI21 | Brain_Hippocampus | 1e.05 | 0.037 (0.014) |
| BMI21 | Brain_Hippocampus | 1e.04 | 0.044 (0.014) |
| BMI21 | Brain_Hippocampus | 0.001 | 0.05 (0.014) |
| BMI21 | Brain_Hippocampus | 0.01 | 0.059 (0.014) |
| BMI21 | Brain_Hippocampus | 0.05 | 0.067 (0.014) |
| BMI21 | Brain_Hippocampus | 0.1 | 0.069 (0.014) |
| BMI21 | Brain_Hippocampus | 0.5 | 0.071 (0.014) |
| BMI21 | Brain_Hippocampus | 1 | 0.071 (0.014) |
| BMI21 | Brain_Hippocampus | All | 0.066 (0.014) |
| BMI21 | Brain_Hypothalamus | 1e.06 | 0.023 (0.014) |
| BMI21 | Brain_Hypothalamus | 1e.05 | 0.022 (0.014) |
| BMI21 | Brain_Hypothalamus | 1e.04 | 0.03 (0.014) |
| BMI21 | Brain_Hypothalamus | 0.001 | 0.039 (0.014) |
| BMI21 | Brain_Hypothalamus | 0.01 | 0.046 (0.014) |
| BMI21 | Brain_Hypothalamus | 0.05 | 0.05 (0.014) |
| BMI21 | Brain_Hypothalamus | 0.1 | 0.049 (0.014) |
| BMI21 | Brain_Hypothalamus | 0.5 | 0.051 (0.014) |
| BMI21 | Brain_Hypothalamus | 1 | 0.051 (0.014) |
| BMI21 | Brain_Hypothalamus | All | 0.041 (0.014) |
| BMI21 | Brain_Nucleus_accumbens_basal_ganglia | 1e.06 | 0.009 (0.014) |
| BMI21 | Brain_Nucleus_accumbens_basal_ganglia | 1e.05 | 0.011 (0.014) |
| BMI21 | Brain_Nucleus_accumbens_basal_ganglia | 1e.04 | 0.023 (0.014) |
| BMI21 | Brain_Nucleus_accumbens_basal_ganglia | 0.001 | 0.03 (0.014) |
| BMI21 | Brain_Nucleus_accumbens_basal_ganglia | 0.01 | 0.037 (0.014) |
| BMI21 | Brain_Nucleus_accumbens_basal_ganglia | 0.05 | 0.044 (0.014) |
| BMI21 | Brain_Nucleus_accumbens_basal_ganglia | 0.1 | 0.047 (0.014) |
| BMI21 | Brain_Nucleus_accumbens_basal_ganglia | 0.5 | 0.051 (0.014) |
| BMI21 | Brain_Nucleus_accumbens_basal_ganglia | 1 | 0.05 (0.014) |
| BMI21 | Brain_Nucleus_accumbens_basal_ganglia | All | 0.05 (0.014) |
| BMI21 | Brain_Putamen_basal_ganglia | 1e.06 | 0.023 (0.014) |
| BMI21 | Brain_Putamen_basal_ganglia | 1e.05 | 0.024 (0.014) |
| BMI21 | Brain_Putamen_basal_ganglia | 1e.04 | 0.032 (0.014) |
| BMI21 | Brain_Putamen_basal_ganglia | 0.001 | 0.046 (0.014) |
| BMI21 | Brain_Putamen_basal_ganglia | 0.01 | 0.054 (0.014) |
| BMI21 | Brain_Putamen_basal_ganglia | 0.05 | 0.068 (0.014) |
| BMI21 | Brain_Putamen_basal_ganglia | 0.1 | 0.069 (0.014) |
| BMI21 | Brain_Putamen_basal_ganglia | 0.5 | 0.071 (0.014) |
| BMI21 | Brain_Putamen_basal_ganglia | 1 | 0.071 (0.014) |
| BMI21 | Brain_Putamen_basal_ganglia | All | 0.077 (0.014) |
| BMI21 | Brain_Spinal_cord_cervical_c-1 | 1e.06 | 0.025 (0.014) |
| BMI21 | Brain_Spinal_cord_cervical_c-1 | 1e.05 | 0.031 (0.014) |
| BMI21 | Brain_Spinal_cord_cervical_c-1 | 1e.04 | 0.035 (0.014) |
| BMI21 | Brain_Spinal_cord_cervical_c-1 | 0.001 | 0.051 (0.014) |
| BMI21 | Brain_Spinal_cord_cervical_c-1 | 0.01 | 0.049 (0.014) |
| BMI21 | Brain_Spinal_cord_cervical_c-1 | 0.05 | 0.052 (0.014) |
| BMI21 | Brain_Spinal_cord_cervical_c-1 | 0.1 | 0.049 (0.014) |
| BMI21 | Brain_Spinal_cord_cervical_c-1 | 0.5 | 0.048 (0.014) |
| BMI21 | Brain_Spinal_cord_cervical_c-1 | 1 | 0.048 (0.014) |
| BMI21 | Brain_Spinal_cord_cervical_c-1 | All | 0.046 (0.014) |
| BMI21 | Brain_Substantia_nigra | 1e.06 | 0.023 (0.014) |
| BMI21 | Brain_Substantia_nigra | 1e.05 | 0.021 (0.014) |
| BMI21 | Brain_Substantia_nigra | 1e.04 | 0.032 (0.014) |
| BMI21 | Brain_Substantia_nigra | 0.001 | 0.036 (0.014) |
| BMI21 | Brain_Substantia_nigra | 0.01 | 0.036 (0.014) |
| BMI21 | Brain_Substantia_nigra | 0.05 | 0.037 (0.014) |
| BMI21 | Brain_Substantia_nigra | 0.1 | 0.036 (0.014) |
| BMI21 | Brain_Substantia_nigra | 0.5 | 0.04 (0.014) |
| BMI21 | Brain_Substantia_nigra | 1 | 0.039 (0.014) |
| BMI21 | Brain_Substantia_nigra | All | 0.032 (0.014) |
| BMI21 | Breast_Mammary_Tissue | 1e.06 | 0.043 (0.014) |
| BMI21 | Breast_Mammary_Tissue | 1e.05 | 0.042 (0.014) |
| BMI21 | Breast_Mammary_Tissue | 1e.04 | 0.048 (0.014) |
| BMI21 | Breast_Mammary_Tissue | 0.001 | 0.052 (0.014) |
| BMI21 | Breast_Mammary_Tissue | 0.01 | 0.059 (0.014) |
| BMI21 | Breast_Mammary_Tissue | 0.05 | 0.071 (0.014) |
| BMI21 | Breast_Mammary_Tissue | 0.1 | 0.076 (0.014) |
| BMI21 | Breast_Mammary_Tissue | 0.5 | 0.077 (0.014) |
| BMI21 | Breast_Mammary_Tissue | 1 | 0.078 (0.014) |
| BMI21 | Breast_Mammary_Tissue | All | 0.075 (0.014) |
| BMI21 | Cells_EBV-transformed_lymphocytes | 1e.06 | 0.054 (0.014) |
| BMI21 | Cells_EBV-transformed_lymphocytes | 1e.05 | 0.057 (0.014) |
| BMI21 | Cells_EBV-transformed_lymphocytes | 1e.04 | 0.063 (0.014) |
| BMI21 | Cells_EBV-transformed_lymphocytes | 0.001 | 0.073 (0.014) |
| BMI21 | Cells_EBV-transformed_lymphocytes | 0.01 | 0.083 (0.014) |
| BMI21 | Cells_EBV-transformed_lymphocytes | 0.05 | 0.093 (0.014) |
| BMI21 | Cells_EBV-transformed_lymphocytes | 0.1 | 0.093 (0.014) |
| BMI21 | Cells_EBV-transformed_lymphocytes | 0.5 | 0.091 (0.014) |
| BMI21 | Cells_EBV-transformed_lymphocytes | 1 | 0.091 (0.014) |
| BMI21 | Cells_EBV-transformed_lymphocytes | All | 0.093 (0.014) |
| BMI21 | Cells_Transformed_fibroblasts | 1e.06 | 0.056 (0.014) |
| BMI21 | Cells_Transformed_fibroblasts | 1e.05 | 0.063 (0.014) |
| BMI21 | Cells_Transformed_fibroblasts | 1e.04 | 0.068 (0.014) |
| BMI21 | Cells_Transformed_fibroblasts | 0.001 | 0.078 (0.014) |
| BMI21 | Cells_Transformed_fibroblasts | 0.01 | 0.088 (0.014) |
| BMI21 | Cells_Transformed_fibroblasts | 0.05 | 0.095 (0.014) |
| BMI21 | Cells_Transformed_fibroblasts | 0.1 | 0.096 (0.014) |
| BMI21 | Cells_Transformed_fibroblasts | 0.5 | 0.099 (0.014) |
| BMI21 | Cells_Transformed_fibroblasts | 1 | 0.099 (0.014) |
| BMI21 | Cells_Transformed_fibroblasts | All | 0.098 (0.014) |
| BMI21 | CMC.BRAIN.RNASEQ | 1e.06 | 0.069 (0.014) |
| BMI21 | CMC.BRAIN.RNASEQ | 1e.05 | 0.072 (0.014) |
| BMI21 | CMC.BRAIN.RNASEQ | 1e.04 | 0.081 (0.014) |
| BMI21 | CMC.BRAIN.RNASEQ | 0.001 | 0.09 (0.014) |
| BMI21 | CMC.BRAIN.RNASEQ | 0.01 | 0.097 (0.014) |
| BMI21 | CMC.BRAIN.RNASEQ | 0.05 | 0.108 (0.014) |
| BMI21 | CMC.BRAIN.RNASEQ | 0.1 | 0.11 (0.014) |
| BMI21 | CMC.BRAIN.RNASEQ | 0.5 | 0.111 (0.014) |
| BMI21 | CMC.BRAIN.RNASEQ | 1 | 0.11 (0.014) |
| BMI21 | CMC.BRAIN.RNASEQ | All | 0.106 (0.014) |
| BMI21 | CMC.BRAIN.RNASEQ_SPLICING | 1e.06 | 0.059 (0.014) |
| BMI21 | CMC.BRAIN.RNASEQ_SPLICING | 1e.05 | 0.062 (0.014) |
| BMI21 | CMC.BRAIN.RNASEQ_SPLICING | 1e.04 | 0.07 (0.014) |
| BMI21 | CMC.BRAIN.RNASEQ_SPLICING | 0.001 | 0.088 (0.014) |
| BMI21 | CMC.BRAIN.RNASEQ_SPLICING | 0.01 | 0.094 (0.014) |
| BMI21 | CMC.BRAIN.RNASEQ_SPLICING | 0.05 | 0.096 (0.014) |
| BMI21 | CMC.BRAIN.RNASEQ_SPLICING | 0.1 | 0.095 (0.014) |
| BMI21 | CMC.BRAIN.RNASEQ_SPLICING | 0.5 | 0.092 (0.014) |
| BMI21 | CMC.BRAIN.RNASEQ_SPLICING | 1 | 0.089 (0.014) |
| BMI21 | CMC.BRAIN.RNASEQ_SPLICING | All | 0.091 (0.014) |
| BMI21 | Colon_Sigmoid | 1e.06 | 0.026 (0.014) |
| BMI21 | Colon_Sigmoid | 1e.05 | 0.024 (0.014) |
| BMI21 | Colon_Sigmoid | 1e.04 | 0.034 (0.014) |
| BMI21 | Colon_Sigmoid | 0.001 | 0.052 (0.014) |
| BMI21 | Colon_Sigmoid | 0.01 | 0.054 (0.014) |
| BMI21 | Colon_Sigmoid | 0.05 | 0.063 (0.014) |
| BMI21 | Colon_Sigmoid | 0.1 | 0.065 (0.014) |
| BMI21 | Colon_Sigmoid | 0.5 | 0.06 (0.014) |
| BMI21 | Colon_Sigmoid | 1 | 0.061 (0.014) |
| BMI21 | Colon_Sigmoid | All | 0.067 (0.014) |
| BMI21 | Colon_Transverse | 1e.06 | 0.038 (0.014) |
| BMI21 | Colon_Transverse | 1e.05 | 0.046 (0.014) |
| BMI21 | Colon_Transverse | 1e.04 | 0.052 (0.014) |
| BMI21 | Colon_Transverse | 0.001 | 0.058 (0.014) |
| BMI21 | Colon_Transverse | 0.01 | 0.063 (0.014) |
| BMI21 | Colon_Transverse | 0.05 | 0.074 (0.014) |
| BMI21 | Colon_Transverse | 0.1 | 0.074 (0.014) |
| BMI21 | Colon_Transverse | 0.5 | 0.076 (0.014) |
| BMI21 | Colon_Transverse | 1 | 0.076 (0.014) |
| BMI21 | Colon_Transverse | All | 0.074 (0.014) |
| BMI21 | Esophagus_Gastroesophageal_Junction | 1e.06 | 0.028 (0.014) |
| BMI21 | Esophagus_Gastroesophageal_Junction | 1e.05 | 0.04 (0.014) |
| BMI21 | Esophagus_Gastroesophageal_Junction | 1e.04 | 0.041 (0.014) |
| BMI21 | Esophagus_Gastroesophageal_Junction | 0.001 | 0.053 (0.014) |
| BMI21 | Esophagus_Gastroesophageal_Junction | 0.01 | 0.063 (0.014) |
| BMI21 | Esophagus_Gastroesophageal_Junction | 0.05 | 0.071 (0.014) |
| BMI21 | Esophagus_Gastroesophageal_Junction | 0.1 | 0.074 (0.014) |
| BMI21 | Esophagus_Gastroesophageal_Junction | 0.5 | 0.074 (0.014) |
| BMI21 | Esophagus_Gastroesophageal_Junction | 1 | 0.074 (0.014) |
| BMI21 | Esophagus_Gastroesophageal_Junction | All | 0.078 (0.014) |
| BMI21 | Esophagus_Mucosa | 1e.06 | 0.046 (0.014) |
| BMI21 | Esophagus_Mucosa | 1e.05 | 0.049 (0.014) |
| BMI21 | Esophagus_Mucosa | 1e.04 | 0.057 (0.014) |
| BMI21 | Esophagus_Mucosa | 0.001 | 0.069 (0.014) |
| BMI21 | Esophagus_Mucosa | 0.01 | 0.08 (0.014) |
| BMI21 | Esophagus_Mucosa | 0.05 | 0.094 (0.014) |
| BMI21 | Esophagus_Mucosa | 0.1 | 0.096 (0.014) |
| BMI21 | Esophagus_Mucosa | 0.5 | 0.094 (0.014) |
| BMI21 | Esophagus_Mucosa | 1 | 0.094 (0.014) |
| BMI21 | Esophagus_Mucosa | All | 0.097 (0.014) |
| BMI21 | Esophagus_Muscularis | 1e.06 | 0.054 (0.014) |
| BMI21 | Esophagus_Muscularis | 1e.05 | 0.058 (0.014) |
| BMI21 | Esophagus_Muscularis | 1e.04 | 0.065 (0.014) |
| BMI21 | Esophagus_Muscularis | 0.001 | 0.079 (0.014) |
| BMI21 | Esophagus_Muscularis | 0.01 | 0.091 (0.014) |
| BMI21 | Esophagus_Muscularis | 0.05 | 0.098 (0.014) |
| BMI21 | Esophagus_Muscularis | 0.1 | 0.102 (0.014) |
| BMI21 | Esophagus_Muscularis | 0.5 | 0.105 (0.014) |
| BMI21 | Esophagus_Muscularis | 1 | 0.105 (0.014) |
| BMI21 | Esophagus_Muscularis | All | 0.107 (0.014) |
| BMI21 | Heart_Atrial_Appendage | 1e.06 | 0.034 (0.014) |
| BMI21 | Heart_Atrial_Appendage | 1e.05 | 0.042 (0.014) |
| BMI21 | Heart_Atrial_Appendage | 1e.04 | 0.058 (0.014) |
| BMI21 | Heart_Atrial_Appendage | 0.001 | 0.072 (0.014) |
| BMI21 | Heart_Atrial_Appendage | 0.01 | 0.087 (0.014) |
| BMI21 | Heart_Atrial_Appendage | 0.05 | 0.097 (0.014) |
| BMI21 | Heart_Atrial_Appendage | 0.1 | 0.095 (0.014) |
| BMI21 | Heart_Atrial_Appendage | 0.5 | 0.098 (0.014) |
| BMI21 | Heart_Atrial_Appendage | 1 | 0.096 (0.014) |
| BMI21 | Heart_Atrial_Appendage | All | 0.107 (0.014) |
| BMI21 | Heart_Left_Ventricle | 1e.06 | 0.031 (0.014) |
| BMI21 | Heart_Left_Ventricle | 1e.05 | 0.04 (0.014) |
| BMI21 | Heart_Left_Ventricle | 1e.04 | 0.047 (0.014) |
| BMI21 | Heart_Left_Ventricle | 0.001 | 0.053 (0.014) |
| BMI21 | Heart_Left_Ventricle | 0.01 | 0.071 (0.014) |
| BMI21 | Heart_Left_Ventricle | 0.05 | 0.084 (0.014) |
| BMI21 | Heart_Left_Ventricle | 0.1 | 0.084 (0.014) |
| BMI21 | Heart_Left_Ventricle | 0.5 | 0.082 (0.014) |
| BMI21 | Heart_Left_Ventricle | 1 | 0.081 (0.014) |
| BMI21 | Heart_Left_Ventricle | All | 0.08 (0.014) |
| BMI21 | Liver | 1e.06 | 0.04 (0.014) |
| BMI21 | Liver | 1e.05 | 0.035 (0.014) |
| BMI21 | Liver | 1e.04 | 0.042 (0.014) |
| BMI21 | Liver | 0.001 | 0.058 (0.014) |
| BMI21 | Liver | 0.01 | 0.066 (0.014) |
| BMI21 | Liver | 0.05 | 0.079 (0.014) |
| BMI21 | Liver | 0.1 | 0.078 (0.014) |
| BMI21 | Liver | 0.5 | 0.074 (0.014) |
| BMI21 | Liver | 1 | 0.072 (0.014) |
| BMI21 | Liver | All | 0.08 (0.014) |
| BMI21 | Lung | 1e.06 | 0.059 (0.014) |
| BMI21 | Lung | 1e.05 | 0.065 (0.014) |
| BMI21 | Lung | 1e.04 | 0.069 (0.014) |
| BMI21 | Lung | 0.001 | 0.08 (0.014) |
| BMI21 | Lung | 0.01 | 0.094 (0.014) |
| BMI21 | Lung | 0.05 | 0.1 (0.014) |
| BMI21 | Lung | 0.1 | 0.102 (0.014) |
| BMI21 | Lung | 0.5 | 0.103 (0.014) |
| BMI21 | Lung | 1 | 0.102 (0.014) |
| BMI21 | Lung | All | 0.104 (0.014) |
| BMI21 | METSIM.ADIPOSE.RNASEQ | 1e.06 | 0.045 (0.014) |
| BMI21 | METSIM.ADIPOSE.RNASEQ | 1e.05 | 0.056 (0.014) |
| BMI21 | METSIM.ADIPOSE.RNASEQ | 1e.04 | 0.064 (0.014) |
| BMI21 | METSIM.ADIPOSE.RNASEQ | 0.001 | 0.07 (0.014) |
| BMI21 | METSIM.ADIPOSE.RNASEQ | 0.01 | 0.083 (0.014) |
| BMI21 | METSIM.ADIPOSE.RNASEQ | 0.05 | 0.09 (0.014) |
| BMI21 | METSIM.ADIPOSE.RNASEQ | 0.1 | 0.098 (0.014) |
| BMI21 | METSIM.ADIPOSE.RNASEQ | 0.5 | 0.099 (0.014) |
| BMI21 | METSIM.ADIPOSE.RNASEQ | 1 | 0.098 (0.014) |
| BMI21 | METSIM.ADIPOSE.RNASEQ | All | 0.099 (0.014) |
| BMI21 | Minor_Salivary_Gland | 1e.06 | 0.005 (0.014) |
| BMI21 | Minor_Salivary_Gland | 1e.05 | 0 (0.014) |
| BMI21 | Minor_Salivary_Gland | 1e.04 | 0.016 (0.014) |
| BMI21 | Minor_Salivary_Gland | 0.001 | 0.022 (0.014) |
| BMI21 | Minor_Salivary_Gland | 0.01 | 0.02 (0.014) |
| BMI21 | Minor_Salivary_Gland | 0.05 | 0.018 (0.014) |
| BMI21 | Minor_Salivary_Gland | 0.1 | 0.013 (0.014) |
| BMI21 | Minor_Salivary_Gland | 0.5 | 0.016 (0.014) |
| BMI21 | Minor_Salivary_Gland | 1 | 0.016 (0.014) |
| BMI21 | Minor_Salivary_Gland | All | 0.011 (0.014) |
| BMI21 | Muscle_Skeletal | 1e.06 | 0.059 (0.014) |
| BMI21 | Muscle_Skeletal | 1e.05 | 0.063 (0.014) |
| BMI21 | Muscle_Skeletal | 1e.04 | 0.068 (0.014) |
| BMI21 | Muscle_Skeletal | 0.001 | 0.081 (0.014) |
| BMI21 | Muscle_Skeletal | 0.01 | 0.092 (0.014) |
| BMI21 | Muscle_Skeletal | 0.05 | 0.099 (0.014) |
| BMI21 | Muscle_Skeletal | 0.1 | 0.099 (0.014) |
| BMI21 | Muscle_Skeletal | 0.5 | 0.106 (0.014) |
| BMI21 | Muscle_Skeletal | 1 | 0.105 (0.014) |
| BMI21 | Muscle_Skeletal | All | 0.105 (0.014) |
| BMI21 | Nerve_Tibial | 1e.06 | 0.072 (0.014) |
| BMI21 | Nerve_Tibial | 1e.05 | 0.072 (0.014) |
| BMI21 | Nerve_Tibial | 1e.04 | 0.078 (0.014) |
| BMI21 | Nerve_Tibial | 0.001 | 0.09 (0.014) |
| BMI21 | Nerve_Tibial | 0.01 | 0.099 (0.014) |
| BMI21 | Nerve_Tibial | 0.05 | 0.109 (0.014) |
| BMI21 | Nerve_Tibial | 0.1 | 0.111 (0.014) |
| BMI21 | Nerve_Tibial | 0.5 | 0.114 (0.014) |
| BMI21 | Nerve_Tibial | 1 | 0.115 (0.014) |
| BMI21 | Nerve_Tibial | All | 0.117 (0.014) |
| BMI21 | NTR.BLOOD.RNAARR | 1e.06 | 0.036 (0.014) |
| BMI21 | NTR.BLOOD.RNAARR | 1e.05 | 0.048 (0.014) |
| BMI21 | NTR.BLOOD.RNAARR | 1e.04 | 0.054 (0.014) |
| BMI21 | NTR.BLOOD.RNAARR | 0.001 | 0.06 (0.014) |
| BMI21 | NTR.BLOOD.RNAARR | 0.01 | 0.063 (0.014) |
| BMI21 | NTR.BLOOD.RNAARR | 0.05 | 0.076 (0.014) |
| BMI21 | NTR.BLOOD.RNAARR | 0.1 | 0.08 (0.014) |
| BMI21 | NTR.BLOOD.RNAARR | 0.5 | 0.073 (0.014) |
| BMI21 | NTR.BLOOD.RNAARR | 1 | 0.074 (0.014) |
| BMI21 | NTR.BLOOD.RNAARR | All | 0.075 (0.014) |
| BMI21 | Ovary | 1e.06 | 0.027 (0.014) |
| BMI21 | Ovary | 1e.05 | 0.021 (0.014) |
| BMI21 | Ovary | 1e.04 | 0.033 (0.014) |
| BMI21 | Ovary | 0.001 | 0.044 (0.014) |
| BMI21 | Ovary | 0.01 | 0.049 (0.014) |
| BMI21 | Ovary | 0.05 | 0.049 (0.014) |
| BMI21 | Ovary | 0.1 | 0.049 (0.014) |
| BMI21 | Ovary | 0.5 | 0.055 (0.014) |
| BMI21 | Ovary | 1 | 0.057 (0.014) |
| BMI21 | Ovary | All | 0.058 (0.014) |
| BMI21 | Pancreas | 1e.06 | 0.053 (0.014) |
| BMI21 | Pancreas | 1e.05 | 0.059 (0.014) |
| BMI21 | Pancreas | 1e.04 | 0.061 (0.014) |
| BMI21 | Pancreas | 0.001 | 0.074 (0.014) |
| BMI21 | Pancreas | 0.01 | 0.082 (0.014) |
| BMI21 | Pancreas | 0.05 | 0.091 (0.014) |
| BMI21 | Pancreas | 0.1 | 0.092 (0.014) |
| BMI21 | Pancreas | 0.5 | 0.092 (0.014) |
| BMI21 | Pancreas | 1 | 0.093 (0.014) |
| BMI21 | Pancreas | All | 0.086 (0.014) |
| BMI21 | Pituitary | 1e.06 | 0.023 (0.014) |
| BMI21 | Pituitary | 1e.05 | 0.028 (0.014) |
| BMI21 | Pituitary | 1e.04 | 0.035 (0.014) |
| BMI21 | Pituitary | 0.001 | 0.042 (0.014) |
| BMI21 | Pituitary | 0.01 | 0.054 (0.014) |
| BMI21 | Pituitary | 0.05 | 0.064 (0.014) |
| BMI21 | Pituitary | 0.1 | 0.064 (0.014) |
| BMI21 | Pituitary | 0.5 | 0.066 (0.014) |
| BMI21 | Pituitary | 1 | 0.066 (0.014) |
| BMI21 | Pituitary | All | 0.077 (0.014) |
| BMI21 | Prostate | 1e.06 | 0.019 (0.014) |
| BMI21 | Prostate | 1e.05 | 0.021 (0.014) |
| BMI21 | Prostate | 1e.04 | 0.022 (0.014) |
| BMI21 | Prostate | 0.001 | 0.035 (0.014) |
| BMI21 | Prostate | 0.01 | 0.052 (0.014) |
| BMI21 | Prostate | 0.05 | 0.049 (0.014) |
| BMI21 | Prostate | 0.1 | 0.051 (0.014) |
| BMI21 | Prostate | 0.5 | 0.049 (0.014) |
| BMI21 | Prostate | 1 | 0.048 (0.014) |
| BMI21 | Prostate | All | 0.061 (0.014) |
| BMI21 | Skin_Not_Sun_Exposed_Suprapubic | 1e.06 | 0.061 (0.014) |
| BMI21 | Skin_Not_Sun_Exposed_Suprapubic | 1e.05 | 0.065 (0.014) |
| BMI21 | Skin_Not_Sun_Exposed_Suprapubic | 1e.04 | 0.07 (0.014) |
| BMI21 | Skin_Not_Sun_Exposed_Suprapubic | 0.001 | 0.077 (0.014) |
| BMI21 | Skin_Not_Sun_Exposed_Suprapubic | 0.01 | 0.089 (0.014) |
| BMI21 | Skin_Not_Sun_Exposed_Suprapubic | 0.05 | 0.095 (0.014) |
| BMI21 | Skin_Not_Sun_Exposed_Suprapubic | 0.1 | 0.096 (0.014) |
| BMI21 | Skin_Not_Sun_Exposed_Suprapubic | 0.5 | 0.094 (0.014) |
| BMI21 | Skin_Not_Sun_Exposed_Suprapubic | 1 | 0.094 (0.014) |
| BMI21 | Skin_Not_Sun_Exposed_Suprapubic | All | 0.092 (0.014) |
| BMI21 | Skin_Sun_Exposed_Lower_leg | 1e.06 | 0.054 (0.014) |
| BMI21 | Skin_Sun_Exposed_Lower_leg | 1e.05 | 0.059 (0.014) |
| BMI21 | Skin_Sun_Exposed_Lower_leg | 1e.04 | 0.066 (0.014) |
| BMI21 | Skin_Sun_Exposed_Lower_leg | 0.001 | 0.078 (0.014) |
| BMI21 | Skin_Sun_Exposed_Lower_leg | 0.01 | 0.086 (0.014) |
| BMI21 | Skin_Sun_Exposed_Lower_leg | 0.05 | 0.095 (0.014) |
| BMI21 | Skin_Sun_Exposed_Lower_leg | 0.1 | 0.097 (0.014) |
| BMI21 | Skin_Sun_Exposed_Lower_leg | 0.5 | 0.098 (0.014) |
| BMI21 | Skin_Sun_Exposed_Lower_leg | 1 | 0.098 (0.014) |
| BMI21 | Skin_Sun_Exposed_Lower_leg | All | 0.096 (0.014) |
| BMI21 | Small_Intestine_Terminal_Ileum | 1e.06 | 0.039 (0.014) |
| BMI21 | Small_Intestine_Terminal_Ileum | 1e.05 | 0.044 (0.014) |
| BMI21 | Small_Intestine_Terminal_Ileum | 1e.04 | 0.052 (0.014) |
| BMI21 | Small_Intestine_Terminal_Ileum | 0.001 | 0.052 (0.014) |
| BMI21 | Small_Intestine_Terminal_Ileum | 0.01 | 0.066 (0.014) |
| BMI21 | Small_Intestine_Terminal_Ileum | 0.05 | 0.071 (0.014) |
| BMI21 | Small_Intestine_Terminal_Ileum | 0.1 | 0.075 (0.014) |
| BMI21 | Small_Intestine_Terminal_Ileum | 0.5 | 0.071 (0.014) |
| BMI21 | Small_Intestine_Terminal_Ileum | 1 | 0.072 (0.014) |
| BMI21 | Small_Intestine_Terminal_Ileum | All | 0.064 (0.014) |
| BMI21 | Spleen | 1e.06 | 0.045 (0.014) |
| BMI21 | Spleen | 1e.05 | 0.05 (0.014) |
| BMI21 | Spleen | 1e.04 | 0.053 (0.014) |
| BMI21 | Spleen | 0.001 | 0.064 (0.014) |
| BMI21 | Spleen | 0.01 | 0.077 (0.014) |
| BMI21 | Spleen | 0.05 | 0.087 (0.014) |
| BMI21 | Spleen | 0.1 | 0.088 (0.014) |
| BMI21 | Spleen | 0.5 | 0.082 (0.014) |
| BMI21 | Spleen | 1 | 0.081 (0.014) |
| BMI21 | Spleen | All | 0.09 (0.014) |
| BMI21 | Stomach | 1e.06 | 0.051 (0.014) |
| BMI21 | Stomach | 1e.05 | 0.06 (0.014) |
| BMI21 | Stomach | 1e.04 | 0.066 (0.014) |
| BMI21 | Stomach | 0.001 | 0.074 (0.014) |
| BMI21 | Stomach | 0.01 | 0.081 (0.014) |
| BMI21 | Stomach | 0.05 | 0.089 (0.014) |
| BMI21 | Stomach | 0.1 | 0.093 (0.014) |
| BMI21 | Stomach | 0.5 | 0.086 (0.014) |
| BMI21 | Stomach | 1 | 0.085 (0.014) |
| BMI21 | Stomach | All | 0.085 (0.014) |
| BMI21 | Testis | 1e.06 | 0.059 (0.014) |
| BMI21 | Testis | 1e.05 | 0.069 (0.014) |
| BMI21 | Testis | 1e.04 | 0.078 (0.014) |
| BMI21 | Testis | 0.001 | 0.086 (0.014) |
| BMI21 | Testis | 0.01 | 0.098 (0.014) |
| BMI21 | Testis | 0.05 | 0.106 (0.014) |
| BMI21 | Testis | 0.1 | 0.11 (0.014) |
| BMI21 | Testis | 0.5 | 0.109 (0.014) |
| BMI21 | Testis | 1 | 0.109 (0.014) |
| BMI21 | Testis | All | 0.119 (0.014) |
| BMI21 | Thyroid | 1e.06 | 0.048 (0.014) |
| BMI21 | Thyroid | 1e.05 | 0.049 (0.014) |
| BMI21 | Thyroid | 1e.04 | 0.057 (0.014) |
| BMI21 | Thyroid | 0.001 | 0.072 (0.014) |
| BMI21 | Thyroid | 0.01 | 0.082 (0.014) |
| BMI21 | Thyroid | 0.05 | 0.091 (0.014) |
| BMI21 | Thyroid | 0.1 | 0.095 (0.014) |
| BMI21 | Thyroid | 0.5 | 0.095 (0.014) |
| BMI21 | Thyroid | 1 | 0.096 (0.014) |
| BMI21 | Thyroid | All | 0.093 (0.014) |
| BMI21 | Uterus | 1e.06 | 0.01 (0.014) |
| BMI21 | Uterus | 1e.05 | 0.012 (0.014) |
| BMI21 | Uterus | 1e.04 | 0.022 (0.014) |
| BMI21 | Uterus | 0.001 | 0.032 (0.014) |
| BMI21 | Uterus | 0.01 | 0.04 (0.014) |
| BMI21 | Uterus | 0.05 | 0.036 (0.014) |
| BMI21 | Uterus | 0.1 | 0.037 (0.014) |
| BMI21 | Uterus | 0.5 | 0.042 (0.014) |
| BMI21 | Uterus | 1 | 0.043 (0.014) |
| BMI21 | Uterus | All | 0.032 (0.014) |
| BMI21 | Vagina | 1e.06 | 0.03 (0.014) |
| BMI21 | Vagina | 1e.05 | 0.03 (0.014) |
| BMI21 | Vagina | 1e.04 | 0.044 (0.014) |
| BMI21 | Vagina | 0.001 | 0.057 (0.014) |
| BMI21 | Vagina | 0.01 | 0.054 (0.014) |
| BMI21 | Vagina | 0.05 | 0.063 (0.014) |
| BMI21 | Vagina | 0.1 | 0.065 (0.014) |
| BMI21 | Vagina | 0.5 | 0.065 (0.014) |
| BMI21 | Vagina | 1 | 0.066 (0.014) |
| BMI21 | Vagina | All | 0.061 (0.014) |
| BMI21 | Whole_Blood | 1e.06 | 0.054 (0.014) |
| BMI21 | Whole_Blood | 1e.05 | 0.056 (0.014) |
| BMI21 | Whole_Blood | 1e.04 | 0.062 (0.014) |
| BMI21 | Whole_Blood | 0.001 | 0.068 (0.014) |
| BMI21 | Whole_Blood | 0.01 | 0.087 (0.014) |
| BMI21 | Whole_Blood | 0.05 | 0.093 (0.014) |
| BMI21 | Whole_Blood | 0.1 | 0.095 (0.014) |
| BMI21 | Whole_Blood | 0.5 | 0.095 (0.014) |
| BMI21 | Whole_Blood | 1 | 0.096 (0.014) |
| BMI21 | Whole_Blood | All | 0.097 (0.014) |
| BMI21 | YFS.BLOOD.RNAARR | 1e.06 | 0.032 (0.014) |
| BMI21 | YFS.BLOOD.RNAARR | 1e.05 | 0.039 (0.014) |
| BMI21 | YFS.BLOOD.RNAARR | 1e.04 | 0.054 (0.014) |
| BMI21 | YFS.BLOOD.RNAARR | 0.001 | 0.063 (0.014) |
| BMI21 | YFS.BLOOD.RNAARR | 0.01 | 0.071 (0.014) |
| BMI21 | YFS.BLOOD.RNAARR | 0.05 | 0.077 (0.014) |
| BMI21 | YFS.BLOOD.RNAARR | 0.1 | 0.078 (0.014) |
| BMI21 | YFS.BLOOD.RNAARR | 0.5 | 0.086 (0.014) |
| BMI21 | YFS.BLOOD.RNAARR | 1 | 0.084 (0.014) |
| BMI21 | YFS.BLOOD.RNAARR | All | 0.083 (0.014) |
| GCSE | Adipose_Subcutaneous | 1e.06 | 0.086 (0.012) |
| GCSE | Adipose_Subcutaneous | 1e.05 | 0.092 (0.012) |
| GCSE | Adipose_Subcutaneous | 1e.04 | 0.106 (0.012) |
| GCSE | Adipose_Subcutaneous | 0.001 | 0.126 (0.012) |
| GCSE | Adipose_Subcutaneous | 0.01 | 0.14 (0.012) |
| GCSE | Adipose_Subcutaneous | 0.05 | 0.151 (0.012) |
| GCSE | Adipose_Subcutaneous | 0.1 | 0.156 (0.012) |
| GCSE | Adipose_Subcutaneous | 0.5 | 0.159 (0.012) |
| GCSE | Adipose_Subcutaneous | 1 | 0.159 (0.012) |
| GCSE | Adipose_Subcutaneous | All | 0.16 (0.012) |
| GCSE | Adipose_Visceral_Omentum | 1e.06 | 0.081 (0.012) |
| GCSE | Adipose_Visceral_Omentum | 1e.05 | 0.1 (0.012) |
| GCSE | Adipose_Visceral_Omentum | 1e.04 | 0.109 (0.012) |
| GCSE | Adipose_Visceral_Omentum | 0.001 | 0.131 (0.012) |
| GCSE | Adipose_Visceral_Omentum | 0.01 | 0.141 (0.012) |
| GCSE | Adipose_Visceral_Omentum | 0.05 | 0.149 (0.012) |
| GCSE | Adipose_Visceral_Omentum | 0.1 | 0.155 (0.012) |
| GCSE | Adipose_Visceral_Omentum | 0.5 | 0.158 (0.012) |
| GCSE | Adipose_Visceral_Omentum | 1 | 0.157 (0.012) |
| GCSE | Adipose_Visceral_Omentum | All | 0.156 (0.012) |
| GCSE | Adrenal_Gland | 1e.06 | 0.074 (0.012) |
| GCSE | Adrenal_Gland | 1e.05 | 0.091 (0.012) |
| GCSE | Adrenal_Gland | 1e.04 | 0.097 (0.012) |
| GCSE | Adrenal_Gland | 0.001 | 0.103 (0.012) |
| GCSE | Adrenal_Gland | 0.01 | 0.115 (0.012) |
| GCSE | Adrenal_Gland | 0.05 | 0.12 (0.012) |
| GCSE | Adrenal_Gland | 0.1 | 0.125 (0.012) |
| GCSE | Adrenal_Gland | 0.5 | 0.122 (0.012) |
| GCSE | Adrenal_Gland | 1 | 0.123 (0.012) |
| GCSE | Adrenal_Gland | All | 0.122 (0.012) |
| GCSE | Artery_Aorta | 1e.06 | 0.079 (0.012) |
| GCSE | Artery_Aorta | 1e.05 | 0.087 (0.012) |
| GCSE | Artery_Aorta | 1e.04 | 0.097 (0.012) |
| GCSE | Artery_Aorta | 0.001 | 0.109 (0.012) |
| GCSE | Artery_Aorta | 0.01 | 0.12 (0.012) |
| GCSE | Artery_Aorta | 0.05 | 0.128 (0.012) |
| GCSE | Artery_Aorta | 0.1 | 0.131 (0.012) |
| GCSE | Artery_Aorta | 0.5 | 0.133 (0.012) |
| GCSE | Artery_Aorta | 1 | 0.134 (0.012) |
| GCSE | Artery_Aorta | All | 0.135 (0.012) |
| GCSE | Artery_Coronary | 1e.06 | 0.074 (0.012) |
| GCSE | Artery_Coronary | 1e.05 | 0.08 (0.012) |
| GCSE | Artery_Coronary | 1e.04 | 0.087 (0.012) |
| GCSE | Artery_Coronary | 0.001 | 0.095 (0.012) |
| GCSE | Artery_Coronary | 0.01 | 0.111 (0.012) |
| GCSE | Artery_Coronary | 0.05 | 0.121 (0.012) |
| GCSE | Artery_Coronary | 0.1 | 0.117 (0.012) |
| GCSE | Artery_Coronary | 0.5 | 0.117 (0.012) |
| GCSE | Artery_Coronary | 1 | 0.119 (0.012) |
| GCSE | Artery_Coronary | All | 0.122 (0.012) |
| GCSE | Artery_Tibial | 1e.06 | 0.079 (0.012) |
| GCSE | Artery_Tibial | 1e.05 | 0.088 (0.012) |
| GCSE | Artery_Tibial | 1e.04 | 0.104 (0.012) |
| GCSE | Artery_Tibial | 0.001 | 0.122 (0.012) |
| GCSE | Artery_Tibial | 0.01 | 0.133 (0.012) |
| GCSE | Artery_Tibial | 0.05 | 0.149 (0.012) |
| GCSE | Artery_Tibial | 0.1 | 0.151 (0.012) |
| GCSE | Artery_Tibial | 0.5 | 0.16 (0.012) |
| GCSE | Artery_Tibial | 1 | 0.16 (0.012) |
| GCSE | Artery_Tibial | All | 0.165 (0.012) |
| GCSE | Brain_Amygdala | 1e.06 | 0.063 (0.012) |
| GCSE | Brain_Amygdala | 1e.05 | 0.069 (0.012) |
| GCSE | Brain_Amygdala | 1e.04 | 0.071 (0.012) |
| GCSE | Brain_Amygdala | 0.001 | 0.083 (0.012) |
| GCSE | Brain_Amygdala | 0.01 | 0.094 (0.012) |
| GCSE | Brain_Amygdala | 0.05 | 0.097 (0.012) |
| GCSE | Brain_Amygdala | 0.1 | 0.092 (0.012) |
| GCSE | Brain_Amygdala | 0.5 | 0.096 (0.012) |
| GCSE | Brain_Amygdala | 1 | 0.096 (0.012) |
| GCSE | Brain_Amygdala | All | 0.094 (0.012) |
| GCSE | Brain_Anterior_cingulate_cortex_BA24 | 1e.06 | 0.082 (0.012) |
| GCSE | Brain_Anterior_cingulate_cortex_BA24 | 1e.05 | 0.091 (0.012) |
| GCSE | Brain_Anterior_cingulate_cortex_BA24 | 1e.04 | 0.102 (0.012) |
| GCSE | Brain_Anterior_cingulate_cortex_BA24 | 0.001 | 0.113 (0.012) |
| GCSE | Brain_Anterior_cingulate_cortex_BA24 | 0.01 | 0.121 (0.012) |
| GCSE | Brain_Anterior_cingulate_cortex_BA24 | 0.05 | 0.128 (0.012) |
| GCSE | Brain_Anterior_cingulate_cortex_BA24 | 0.1 | 0.125 (0.012) |
| GCSE | Brain_Anterior_cingulate_cortex_BA24 | 0.5 | 0.124 (0.012) |
| GCSE | Brain_Anterior_cingulate_cortex_BA24 | 1 | 0.124 (0.012) |
| GCSE | Brain_Anterior_cingulate_cortex_BA24 | All | 0.129 (0.012) |
| GCSE | Brain_Caudate_basal_ganglia | 1e.06 | 0.078 (0.012) |
| GCSE | Brain_Caudate_basal_ganglia | 1e.05 | 0.084 (0.012) |
| GCSE | Brain_Caudate_basal_ganglia | 1e.04 | 0.095 (0.012) |
| GCSE | Brain_Caudate_basal_ganglia | 0.001 | 0.101 (0.012) |
| GCSE | Brain_Caudate_basal_ganglia | 0.01 | 0.115 (0.012) |
| GCSE | Brain_Caudate_basal_ganglia | 0.05 | 0.12 (0.012) |
| GCSE | Brain_Caudate_basal_ganglia | 0.1 | 0.126 (0.012) |
| GCSE | Brain_Caudate_basal_ganglia | 0.5 | 0.123 (0.012) |
| GCSE | Brain_Caudate_basal_ganglia | 1 | 0.124 (0.012) |
| GCSE | Brain_Caudate_basal_ganglia | All | 0.123 (0.012) |
| GCSE | Brain_Cerebellar_Hemisphere | 1e.06 | 0.086 (0.012) |
| GCSE | Brain_Cerebellar_Hemisphere | 1e.05 | 0.098 (0.012) |
| GCSE | Brain_Cerebellar_Hemisphere | 1e.04 | 0.111 (0.012) |
| GCSE | Brain_Cerebellar_Hemisphere | 0.001 | 0.12 (0.012) |
| GCSE | Brain_Cerebellar_Hemisphere | 0.01 | 0.13 (0.012) |
| GCSE | Brain_Cerebellar_Hemisphere | 0.05 | 0.138 (0.012) |
| GCSE | Brain_Cerebellar_Hemisphere | 0.1 | 0.139 (0.012) |
| GCSE | Brain_Cerebellar_Hemisphere | 0.5 | 0.142 (0.012) |
| GCSE | Brain_Cerebellar_Hemisphere | 1 | 0.142 (0.012) |
| GCSE | Brain_Cerebellar_Hemisphere | All | 0.142 (0.012) |
| GCSE | Brain_Cerebellum | 1e.06 | 0.088 (0.012) |
| GCSE | Brain_Cerebellum | 1e.05 | 0.101 (0.012) |
| GCSE | Brain_Cerebellum | 1e.04 | 0.107 (0.012) |
| GCSE | Brain_Cerebellum | 0.001 | 0.118 (0.012) |
| GCSE | Brain_Cerebellum | 0.01 | 0.136 (0.012) |
| GCSE | Brain_Cerebellum | 0.05 | 0.141 (0.012) |
| GCSE | Brain_Cerebellum | 0.1 | 0.142 (0.012) |
| GCSE | Brain_Cerebellum | 0.5 | 0.143 (0.012) |
| GCSE | Brain_Cerebellum | 1 | 0.144 (0.012) |
| GCSE | Brain_Cerebellum | All | 0.143 (0.012) |
| GCSE | Brain_Cortex | 1e.06 | 0.079 (0.012) |
| GCSE | Brain_Cortex | 1e.05 | 0.091 (0.012) |
| GCSE | Brain_Cortex | 1e.04 | 0.095 (0.012) |
| GCSE | Brain_Cortex | 0.001 | 0.111 (0.012) |
| GCSE | Brain_Cortex | 0.01 | 0.124 (0.012) |
| GCSE | Brain_Cortex | 0.05 | 0.128 (0.012) |
| GCSE | Brain_Cortex | 0.1 | 0.127 (0.012) |
| GCSE | Brain_Cortex | 0.5 | 0.132 (0.012) |
| GCSE | Brain_Cortex | 1 | 0.133 (0.012) |
| GCSE | Brain_Cortex | All | 0.131 (0.012) |
| GCSE | Brain_Frontal_Cortex_BA9 | 1e.06 | 0.078 (0.012) |
| GCSE | Brain_Frontal_Cortex_BA9 | 1e.05 | 0.083 (0.012) |
| GCSE | Brain_Frontal_Cortex_BA9 | 1e.04 | 0.091 (0.012) |
| GCSE | Brain_Frontal_Cortex_BA9 | 0.001 | 0.097 (0.012) |
| GCSE | Brain_Frontal_Cortex_BA9 | 0.01 | 0.108 (0.012) |
| GCSE | Brain_Frontal_Cortex_BA9 | 0.05 | 0.109 (0.012) |
| GCSE | Brain_Frontal_Cortex_BA9 | 0.1 | 0.109 (0.012) |
| GCSE | Brain_Frontal_Cortex_BA9 | 0.5 | 0.115 (0.012) |
| GCSE | Brain_Frontal_Cortex_BA9 | 1 | 0.115 (0.012) |
| GCSE | Brain_Frontal_Cortex_BA9 | All | 0.114 (0.012) |
| GCSE | Brain_Hippocampus | 1e.06 | 0.076 (0.012) |
| GCSE | Brain_Hippocampus | 1e.05 | 0.084 (0.012) |
| GCSE | Brain_Hippocampus | 1e.04 | 0.089 (0.012) |
| GCSE | Brain_Hippocampus | 0.001 | 0.103 (0.012) |
| GCSE | Brain_Hippocampus | 0.01 | 0.114 (0.012) |
| GCSE | Brain_Hippocampus | 0.05 | 0.121 (0.012) |
| GCSE | Brain_Hippocampus | 0.1 | 0.122 (0.012) |
| GCSE | Brain_Hippocampus | 0.5 | 0.124 (0.012) |
| GCSE | Brain_Hippocampus | 1 | 0.124 (0.012) |
| GCSE | Brain_Hippocampus | All | 0.123 (0.012) |
| GCSE | Brain_Hypothalamus | 1e.06 | 0.07 (0.012) |
| GCSE | Brain_Hypothalamus | 1e.05 | 0.075 (0.012) |
| GCSE | Brain_Hypothalamus | 1e.04 | 0.081 (0.012) |
| GCSE | Brain_Hypothalamus | 0.001 | 0.093 (0.012) |
| GCSE | Brain_Hypothalamus | 0.01 | 0.098 (0.012) |
| GCSE | Brain_Hypothalamus | 0.05 | 0.1 (0.012) |
| GCSE | Brain_Hypothalamus | 0.1 | 0.104 (0.012) |
| GCSE | Brain_Hypothalamus | 0.5 | 0.108 (0.012) |
| GCSE | Brain_Hypothalamus | 1 | 0.108 (0.012) |
| GCSE | Brain_Hypothalamus | All | 0.103 (0.012) |
| GCSE | Brain_Nucleus_accumbens_basal_ganglia | 1e.06 | 0.072 (0.012) |
| GCSE | Brain_Nucleus_accumbens_basal_ganglia | 1e.05 | 0.077 (0.012) |
| GCSE | Brain_Nucleus_accumbens_basal_ganglia | 1e.04 | 0.081 (0.012) |
| GCSE | Brain_Nucleus_accumbens_basal_ganglia | 0.001 | 0.097 (0.012) |
| GCSE | Brain_Nucleus_accumbens_basal_ganglia | 0.01 | 0.106 (0.012) |
| GCSE | Brain_Nucleus_accumbens_basal_ganglia | 0.05 | 0.112 (0.012) |
| GCSE | Brain_Nucleus_accumbens_basal_ganglia | 0.1 | 0.115 (0.012) |
| GCSE | Brain_Nucleus_accumbens_basal_ganglia | 0.5 | 0.116 (0.012) |
| GCSE | Brain_Nucleus_accumbens_basal_ganglia | 1 | 0.115 (0.012) |
| GCSE | Brain_Nucleus_accumbens_basal_ganglia | All | 0.116 (0.012) |
| GCSE | Brain_Putamen_basal_ganglia | 1e.06 | 0.083 (0.012) |
| GCSE | Brain_Putamen_basal_ganglia | 1e.05 | 0.091 (0.012) |
| GCSE | Brain_Putamen_basal_ganglia | 1e.04 | 0.091 (0.012) |
| GCSE | Brain_Putamen_basal_ganglia | 0.001 | 0.105 (0.012) |
| GCSE | Brain_Putamen_basal_ganglia | 0.01 | 0.114 (0.012) |
| GCSE | Brain_Putamen_basal_ganglia | 0.05 | 0.118 (0.012) |
| GCSE | Brain_Putamen_basal_ganglia | 0.1 | 0.119 (0.012) |
| GCSE | Brain_Putamen_basal_ganglia | 0.5 | 0.126 (0.012) |
| GCSE | Brain_Putamen_basal_ganglia | 1 | 0.126 (0.012) |
| GCSE | Brain_Putamen_basal_ganglia | All | 0.126 (0.012) |
| GCSE | Brain_Spinal_cord_cervical_c-1 | 1e.06 | 0.069 (0.012) |
| GCSE | Brain_Spinal_cord_cervical_c-1 | 1e.05 | 0.079 (0.012) |
| GCSE | Brain_Spinal_cord_cervical_c-1 | 1e.04 | 0.08 (0.012) |
| GCSE | Brain_Spinal_cord_cervical_c-1 | 0.001 | 0.092 (0.012) |
| GCSE | Brain_Spinal_cord_cervical_c-1 | 0.01 | 0.107 (0.012) |
| GCSE | Brain_Spinal_cord_cervical_c-1 | 0.05 | 0.105 (0.012) |
| GCSE | Brain_Spinal_cord_cervical_c-1 | 0.1 | 0.108 (0.012) |
| GCSE | Brain_Spinal_cord_cervical_c-1 | 0.5 | 0.104 (0.012) |
| GCSE | Brain_Spinal_cord_cervical_c-1 | 1 | 0.104 (0.012) |
| GCSE | Brain_Spinal_cord_cervical_c-1 | All | 0.109 (0.012) |
| GCSE | Brain_Substantia_nigra | 1e.06 | 0.073 (0.012) |
| GCSE | Brain_Substantia_nigra | 1e.05 | 0.082 (0.012) |
| GCSE | Brain_Substantia_nigra | 1e.04 | 0.089 (0.012) |
| GCSE | Brain_Substantia_nigra | 0.001 | 0.086 (0.012) |
| GCSE | Brain_Substantia_nigra | 0.01 | 0.099 (0.012) |
| GCSE | Brain_Substantia_nigra | 0.05 | 0.104 (0.012) |
| GCSE | Brain_Substantia_nigra | 0.1 | 0.102 (0.012) |
| GCSE | Brain_Substantia_nigra | 0.5 | 0.098 (0.012) |
| GCSE | Brain_Substantia_nigra | 1 | 0.099 (0.012) |
| GCSE | Brain_Substantia_nigra | All | 0.101 (0.012) |
| GCSE | Breast_Mammary_Tissue | 1e.06 | 0.081 (0.012) |
| GCSE | Breast_Mammary_Tissue | 1e.05 | 0.099 (0.012) |
| GCSE | Breast_Mammary_Tissue | 1e.04 | 0.105 (0.012) |
| GCSE | Breast_Mammary_Tissue | 0.001 | 0.116 (0.012) |
| GCSE | Breast_Mammary_Tissue | 0.01 | 0.126 (0.012) |
| GCSE | Breast_Mammary_Tissue | 0.05 | 0.132 (0.012) |
| GCSE | Breast_Mammary_Tissue | 0.1 | 0.138 (0.012) |
| GCSE | Breast_Mammary_Tissue | 0.5 | 0.14 (0.012) |
| GCSE | Breast_Mammary_Tissue | 1 | 0.139 (0.012) |
| GCSE | Breast_Mammary_Tissue | All | 0.137 (0.012) |
| GCSE | Cells_EBV-transformed_lymphocytes | 1e.06 | 0.081 (0.012) |
| GCSE | Cells_EBV-transformed_lymphocytes | 1e.05 | 0.084 (0.012) |
| GCSE | Cells_EBV-transformed_lymphocytes | 1e.04 | 0.09 (0.012) |
| GCSE | Cells_EBV-transformed_lymphocytes | 0.001 | 0.094 (0.012) |
| GCSE | Cells_EBV-transformed_lymphocytes | 0.01 | 0.106 (0.012) |
| GCSE | Cells_EBV-transformed_lymphocytes | 0.05 | 0.119 (0.012) |
| GCSE | Cells_EBV-transformed_lymphocytes | 0.1 | 0.117 (0.012) |
| GCSE | Cells_EBV-transformed_lymphocytes | 0.5 | 0.114 (0.012) |
| GCSE | Cells_EBV-transformed_lymphocytes | 1 | 0.115 (0.012) |
| GCSE | Cells_EBV-transformed_lymphocytes | All | 0.116 (0.012) |
| GCSE | Cells_Transformed_fibroblasts | 1e.06 | 0.08 (0.012) |
| GCSE | Cells_Transformed_fibroblasts | 1e.05 | 0.091 (0.012) |
| GCSE | Cells_Transformed_fibroblasts | 1e.04 | 0.11 (0.012) |
| GCSE | Cells_Transformed_fibroblasts | 0.001 | 0.121 (0.012) |
| GCSE | Cells_Transformed_fibroblasts | 0.01 | 0.137 (0.012) |
| GCSE | Cells_Transformed_fibroblasts | 0.05 | 0.144 (0.012) |
| GCSE | Cells_Transformed_fibroblasts | 0.1 | 0.154 (0.012) |
| GCSE | Cells_Transformed_fibroblasts | 0.5 | 0.159 (0.012) |
| GCSE | Cells_Transformed_fibroblasts | 1 | 0.159 (0.012) |
| GCSE | Cells_Transformed_fibroblasts | All | 0.16 (0.012) |
| GCSE | CMC.BRAIN.RNASEQ | 1e.06 | 0.111 (0.012) |
| GCSE | CMC.BRAIN.RNASEQ | 1e.05 | 0.121 (0.012) |
| GCSE | CMC.BRAIN.RNASEQ | 1e.04 | 0.13 (0.012) |
| GCSE | CMC.BRAIN.RNASEQ | 0.001 | 0.144 (0.012) |
| GCSE | CMC.BRAIN.RNASEQ | 0.01 | 0.157 (0.012) |
| GCSE | CMC.BRAIN.RNASEQ | 0.05 | 0.164 (0.012) |
| GCSE | CMC.BRAIN.RNASEQ | 0.1 | 0.171 (0.012) |
| GCSE | CMC.BRAIN.RNASEQ | 0.5 | 0.18 (0.012) |
| GCSE | CMC.BRAIN.RNASEQ | 1 | 0.181 (0.012) |
| GCSE | CMC.BRAIN.RNASEQ | All | 0.181 (0.012) |
| GCSE | CMC.BRAIN.RNASEQ_SPLICING | 1e.06 | 0.069 (0.012) |
| GCSE | CMC.BRAIN.RNASEQ_SPLICING | 1e.05 | 0.081 (0.012) |
| GCSE | CMC.BRAIN.RNASEQ_SPLICING | 1e.04 | 0.091 (0.012) |
| GCSE | CMC.BRAIN.RNASEQ_SPLICING | 0.001 | 0.103 (0.012) |
| GCSE | CMC.BRAIN.RNASEQ_SPLICING | 0.01 | 0.125 (0.012) |
| GCSE | CMC.BRAIN.RNASEQ_SPLICING | 0.05 | 0.13 (0.012) |
| GCSE | CMC.BRAIN.RNASEQ_SPLICING | 0.1 | 0.133 (0.012) |
| GCSE | CMC.BRAIN.RNASEQ_SPLICING | 0.5 | 0.134 (0.012) |
| GCSE | CMC.BRAIN.RNASEQ_SPLICING | 1 | 0.132 (0.012) |
| GCSE | CMC.BRAIN.RNASEQ_SPLICING | All | 0.132 (0.012) |
| GCSE | Colon_Sigmoid | 1e.06 | 0.066 (0.012) |
| GCSE | Colon_Sigmoid | 1e.05 | 0.078 (0.012) |
| GCSE | Colon_Sigmoid | 1e.04 | 0.089 (0.012) |
| GCSE | Colon_Sigmoid | 0.001 | 0.096 (0.012) |
| GCSE | Colon_Sigmoid | 0.01 | 0.112 (0.012) |
| GCSE | Colon_Sigmoid | 0.05 | 0.117 (0.012) |
| GCSE | Colon_Sigmoid | 0.1 | 0.122 (0.012) |
| GCSE | Colon_Sigmoid | 0.5 | 0.129 (0.012) |
| GCSE | Colon_Sigmoid | 1 | 0.128 (0.012) |
| GCSE | Colon_Sigmoid | All | 0.125 (0.012) |
| GCSE | Colon_Transverse | 1e.06 | 0.065 (0.012) |
| GCSE | Colon_Transverse | 1e.05 | 0.076 (0.012) |
| GCSE | Colon_Transverse | 1e.04 | 0.086 (0.012) |
| GCSE | Colon_Transverse | 0.001 | 0.1 (0.012) |
| GCSE | Colon_Transverse | 0.01 | 0.108 (0.012) |
| GCSE | Colon_Transverse | 0.05 | 0.118 (0.012) |
| GCSE | Colon_Transverse | 0.1 | 0.126 (0.012) |
| GCSE | Colon_Transverse | 0.5 | 0.131 (0.012) |
| GCSE | Colon_Transverse | 1 | 0.132 (0.012) |
| GCSE | Colon_Transverse | All | 0.129 (0.012) |
| GCSE | Esophagus_Gastroesophageal_Junction | 1e.06 | 0.07 (0.012) |
| GCSE | Esophagus_Gastroesophageal_Junction | 1e.05 | 0.08 (0.012) |
| GCSE | Esophagus_Gastroesophageal_Junction | 1e.04 | 0.085 (0.012) |
| GCSE | Esophagus_Gastroesophageal_Junction | 0.001 | 0.102 (0.012) |
| GCSE | Esophagus_Gastroesophageal_Junction | 0.01 | 0.119 (0.012) |
| GCSE | Esophagus_Gastroesophageal_Junction | 0.05 | 0.127 (0.012) |
| GCSE | Esophagus_Gastroesophageal_Junction | 0.1 | 0.129 (0.012) |
| GCSE | Esophagus_Gastroesophageal_Junction | 0.5 | 0.132 (0.012) |
| GCSE | Esophagus_Gastroesophageal_Junction | 1 | 0.131 (0.012) |
| GCSE | Esophagus_Gastroesophageal_Junction | All | 0.133 (0.012) |
| GCSE | Esophagus_Mucosa | 1e.06 | 0.077 (0.012) |
| GCSE | Esophagus_Mucosa | 1e.05 | 0.088 (0.012) |
| GCSE | Esophagus_Mucosa | 1e.04 | 0.104 (0.012) |
| GCSE | Esophagus_Mucosa | 0.001 | 0.12 (0.012) |
| GCSE | Esophagus_Mucosa | 0.01 | 0.132 (0.012) |
| GCSE | Esophagus_Mucosa | 0.05 | 0.142 (0.012) |
| GCSE | Esophagus_Mucosa | 0.1 | 0.146 (0.012) |
| GCSE | Esophagus_Mucosa | 0.5 | 0.15 (0.012) |
| GCSE | Esophagus_Mucosa | 1 | 0.15 (0.012) |
| GCSE | Esophagus_Mucosa | All | 0.152 (0.012) |
| GCSE | Esophagus_Muscularis | 1e.06 | 0.088 (0.012) |
| GCSE | Esophagus_Muscularis | 1e.05 | 0.102 (0.012) |
| GCSE | Esophagus_Muscularis | 1e.04 | 0.116 (0.012) |
| GCSE | Esophagus_Muscularis | 0.001 | 0.127 (0.012) |
| GCSE | Esophagus_Muscularis | 0.01 | 0.142 (0.012) |
| GCSE | Esophagus_Muscularis | 0.05 | 0.149 (0.012) |
| GCSE | Esophagus_Muscularis | 0.1 | 0.152 (0.012) |
| GCSE | Esophagus_Muscularis | 0.5 | 0.155 (0.012) |
| GCSE | Esophagus_Muscularis | 1 | 0.155 (0.012) |
| GCSE | Esophagus_Muscularis | All | 0.156 (0.012) |
| GCSE | Heart_Atrial_Appendage | 1e.06 | 0.082 (0.012) |
| GCSE | Heart_Atrial_Appendage | 1e.05 | 0.092 (0.012) |
| GCSE | Heart_Atrial_Appendage | 1e.04 | 0.101 (0.012) |
| GCSE | Heart_Atrial_Appendage | 0.001 | 0.115 (0.012) |
| GCSE | Heart_Atrial_Appendage | 0.01 | 0.131 (0.012) |
| GCSE | Heart_Atrial_Appendage | 0.05 | 0.137 (0.012) |
| GCSE | Heart_Atrial_Appendage | 0.1 | 0.141 (0.012) |
| GCSE | Heart_Atrial_Appendage | 0.5 | 0.142 (0.012) |
| GCSE | Heart_Atrial_Appendage | 1 | 0.142 (0.012) |
| GCSE | Heart_Atrial_Appendage | All | 0.14 (0.012) |
| GCSE | Heart_Left_Ventricle | 1e.06 | 0.08 (0.012) |
| GCSE | Heart_Left_Ventricle | 1e.05 | 0.091 (0.012) |
| GCSE | Heart_Left_Ventricle | 1e.04 | 0.097 (0.012) |
| GCSE | Heart_Left_Ventricle | 0.001 | 0.113 (0.012) |
| GCSE | Heart_Left_Ventricle | 0.01 | 0.132 (0.012) |
| GCSE | Heart_Left_Ventricle | 0.05 | 0.138 (0.012) |
| GCSE | Heart_Left_Ventricle | 0.1 | 0.142 (0.012) |
| GCSE | Heart_Left_Ventricle | 0.5 | 0.147 (0.012) |
| GCSE | Heart_Left_Ventricle | 1 | 0.148 (0.012) |
| GCSE | Heart_Left_Ventricle | All | 0.148 (0.012) |
| GCSE | Liver | 1e.06 | 0.066 (0.012) |
| GCSE | Liver | 1e.05 | 0.07 (0.012) |
| GCSE | Liver | 1e.04 | 0.073 (0.012) |
| GCSE | Liver | 0.001 | 0.09 (0.012) |
| GCSE | Liver | 0.01 | 0.101 (0.012) |
| GCSE | Liver | 0.05 | 0.102 (0.012) |
| GCSE | Liver | 0.1 | 0.102 (0.012) |
| GCSE | Liver | 0.5 | 0.105 (0.012) |
| GCSE | Liver | 1 | 0.105 (0.012) |
| GCSE | Liver | All | 0.107 (0.012) |
| GCSE | Lung | 1e.06 | 0.091 (0.012) |
| GCSE | Lung | 1e.05 | 0.104 (0.012) |
| GCSE | Lung | 1e.04 | 0.116 (0.012) |
| GCSE | Lung | 0.001 | 0.133 (0.012) |
| GCSE | Lung | 0.01 | 0.149 (0.012) |
| GCSE | Lung | 0.05 | 0.155 (0.012) |
| GCSE | Lung | 0.1 | 0.158 (0.012) |
| GCSE | Lung | 0.5 | 0.161 (0.012) |
| GCSE | Lung | 1 | 0.162 (0.012) |
| GCSE | Lung | All | 0.163 (0.012) |
| GCSE | METSIM.ADIPOSE.RNASEQ | 1e.06 | 0.086 (0.012) |
| GCSE | METSIM.ADIPOSE.RNASEQ | 1e.05 | 0.102 (0.012) |
| GCSE | METSIM.ADIPOSE.RNASEQ | 1e.04 | 0.111 (0.012) |
| GCSE | METSIM.ADIPOSE.RNASEQ | 0.001 | 0.128 (0.012) |
| GCSE | METSIM.ADIPOSE.RNASEQ | 0.01 | 0.139 (0.012) |
| GCSE | METSIM.ADIPOSE.RNASEQ | 0.05 | 0.149 (0.012) |
| GCSE | METSIM.ADIPOSE.RNASEQ | 0.1 | 0.154 (0.012) |
| GCSE | METSIM.ADIPOSE.RNASEQ | 0.5 | 0.159 (0.012) |
| GCSE | METSIM.ADIPOSE.RNASEQ | 1 | 0.16 (0.012) |
| GCSE | METSIM.ADIPOSE.RNASEQ | All | 0.158 (0.012) |
| GCSE | Minor_Salivary_Gland | 1e.06 | 0.073 (0.012) |
| GCSE | Minor_Salivary_Gland | 1e.05 | 0.077 (0.012) |
| GCSE | Minor_Salivary_Gland | 1e.04 | 0.077 (0.012) |
| GCSE | Minor_Salivary_Gland | 0.001 | 0.089 (0.012) |
| GCSE | Minor_Salivary_Gland | 0.01 | 0.092 (0.012) |
| GCSE | Minor_Salivary_Gland | 0.05 | 0.102 (0.012) |
| GCSE | Minor_Salivary_Gland | 0.1 | 0.111 (0.012) |
| GCSE | Minor_Salivary_Gland | 0.5 | 0.111 (0.012) |
| GCSE | Minor_Salivary_Gland | 1 | 0.111 (0.012) |
| GCSE | Minor_Salivary_Gland | All | 0.107 (0.012) |
| GCSE | Muscle_Skeletal | 1e.06 | 0.09 (0.012) |
| GCSE | Muscle_Skeletal | 1e.05 | 0.105 (0.012) |
| GCSE | Muscle_Skeletal | 1e.04 | 0.117 (0.012) |
| GCSE | Muscle_Skeletal | 0.001 | 0.131 (0.012) |
| GCSE | Muscle_Skeletal | 0.01 | 0.147 (0.012) |
| GCSE | Muscle_Skeletal | 0.05 | 0.15 (0.012) |
| GCSE | Muscle_Skeletal | 0.1 | 0.154 (0.012) |
| GCSE | Muscle_Skeletal | 0.5 | 0.16 (0.012) |
| GCSE | Muscle_Skeletal | 1 | 0.16 (0.012) |
| GCSE | Muscle_Skeletal | All | 0.162 (0.012) |
| GCSE | Nerve_Tibial | 1e.06 | 0.081 (0.012) |
| GCSE | Nerve_Tibial | 1e.05 | 0.09 (0.012) |
| GCSE | Nerve_Tibial | 1e.04 | 0.106 (0.012) |
| GCSE | Nerve_Tibial | 0.001 | 0.122 (0.012) |
| GCSE | Nerve_Tibial | 0.01 | 0.139 (0.012) |
| GCSE | Nerve_Tibial | 0.05 | 0.148 (0.012) |
| GCSE | Nerve_Tibial | 0.1 | 0.151 (0.012) |
| GCSE | Nerve_Tibial | 0.5 | 0.158 (0.012) |
| GCSE | Nerve_Tibial | 1 | 0.158 (0.012) |
| GCSE | Nerve_Tibial | All | 0.16 (0.012) |
| GCSE | NTR.BLOOD.RNAARR | 1e.06 | 0.061 (0.012) |
| GCSE | NTR.BLOOD.RNAARR | 1e.05 | 0.073 (0.012) |
| GCSE | NTR.BLOOD.RNAARR | 1e.04 | 0.082 (0.012) |
| GCSE | NTR.BLOOD.RNAARR | 0.001 | 0.098 (0.012) |
| GCSE | NTR.BLOOD.RNAARR | 0.01 | 0.105 (0.012) |
| GCSE | NTR.BLOOD.RNAARR | 0.05 | 0.113 (0.012) |
| GCSE | NTR.BLOOD.RNAARR | 0.1 | 0.113 (0.012) |
| GCSE | NTR.BLOOD.RNAARR | 0.5 | 0.113 (0.012) |
| GCSE | NTR.BLOOD.RNAARR | 1 | 0.114 (0.012) |
| GCSE | NTR.BLOOD.RNAARR | All | 0.112 (0.012) |
| GCSE | Ovary | 1e.06 | 0.065 (0.012) |
| GCSE | Ovary | 1e.05 | 0.076 (0.012) |
| GCSE | Ovary | 1e.04 | 0.084 (0.012) |
| GCSE | Ovary | 0.001 | 0.091 (0.012) |
| GCSE | Ovary | 0.01 | 0.1 (0.012) |
| GCSE | Ovary | 0.05 | 0.109 (0.012) |
| GCSE | Ovary | 0.1 | 0.113 (0.012) |
| GCSE | Ovary | 0.5 | 0.111 (0.012) |
| GCSE | Ovary | 1 | 0.111 (0.012) |
| GCSE | Ovary | All | 0.112 (0.012) |
| GCSE | Pancreas | 1e.06 | 0.082 (0.012) |
| GCSE | Pancreas | 1e.05 | 0.086 (0.012) |
| GCSE | Pancreas | 1e.04 | 0.096 (0.012) |
| GCSE | Pancreas | 0.001 | 0.11 (0.012) |
| GCSE | Pancreas | 0.01 | 0.127 (0.012) |
| GCSE | Pancreas | 0.05 | 0.133 (0.012) |
| GCSE | Pancreas | 0.1 | 0.134 (0.012) |
| GCSE | Pancreas | 0.5 | 0.132 (0.012) |
| GCSE | Pancreas | 1 | 0.132 (0.012) |
| GCSE | Pancreas | All | 0.135 (0.012) |
| GCSE | Pituitary | 1e.06 | 0.07 (0.012) |
| GCSE | Pituitary | 1e.05 | 0.079 (0.012) |
| GCSE | Pituitary | 1e.04 | 0.088 (0.012) |
| GCSE | Pituitary | 0.001 | 0.096 (0.012) |
| GCSE | Pituitary | 0.01 | 0.112 (0.012) |
| GCSE | Pituitary | 0.05 | 0.117 (0.012) |
| GCSE | Pituitary | 0.1 | 0.117 (0.012) |
| GCSE | Pituitary | 0.5 | 0.125 (0.012) |
| GCSE | Pituitary | 1 | 0.126 (0.012) |
| GCSE | Pituitary | All | 0.121 (0.012) |
| GCSE | Prostate | 1e.06 | 0.069 (0.012) |
| GCSE | Prostate | 1e.05 | 0.077 (0.012) |
| GCSE | Prostate | 1e.04 | 0.089 (0.012) |
| GCSE | Prostate | 0.001 | 0.094 (0.012) |
| GCSE | Prostate | 0.01 | 0.11 (0.012) |
| GCSE | Prostate | 0.05 | 0.11 (0.012) |
| GCSE | Prostate | 0.1 | 0.117 (0.012) |
| GCSE | Prostate | 0.5 | 0.117 (0.012) |
| GCSE | Prostate | 1 | 0.117 (0.012) |
| GCSE | Prostate | All | 0.119 (0.012) |
| GCSE | Skin_Not_Sun_Exposed_Suprapubic | 1e.06 | 0.082 (0.012) |
| GCSE | Skin_Not_Sun_Exposed_Suprapubic | 1e.05 | 0.093 (0.012) |
| GCSE | Skin_Not_Sun_Exposed_Suprapubic | 1e.04 | 0.103 (0.012) |
| GCSE | Skin_Not_Sun_Exposed_Suprapubic | 0.001 | 0.116 (0.012) |
| GCSE | Skin_Not_Sun_Exposed_Suprapubic | 0.01 | 0.134 (0.012) |
| GCSE | Skin_Not_Sun_Exposed_Suprapubic | 0.05 | 0.144 (0.012) |
| GCSE | Skin_Not_Sun_Exposed_Suprapubic | 0.1 | 0.147 (0.012) |
| GCSE | Skin_Not_Sun_Exposed_Suprapubic | 0.5 | 0.151 (0.012) |
| GCSE | Skin_Not_Sun_Exposed_Suprapubic | 1 | 0.152 (0.012) |
| GCSE | Skin_Not_Sun_Exposed_Suprapubic | All | 0.153 (0.012) |
| GCSE | Skin_Sun_Exposed_Lower_leg | 1e.06 | 0.088 (0.012) |
| GCSE | Skin_Sun_Exposed_Lower_leg | 1e.05 | 0.105 (0.012) |
| GCSE | Skin_Sun_Exposed_Lower_leg | 1e.04 | 0.112 (0.012) |
| GCSE | Skin_Sun_Exposed_Lower_leg | 0.001 | 0.135 (0.012) |
| GCSE | Skin_Sun_Exposed_Lower_leg | 0.01 | 0.144 (0.012) |
| GCSE | Skin_Sun_Exposed_Lower_leg | 0.05 | 0.154 (0.012) |
| GCSE | Skin_Sun_Exposed_Lower_leg | 0.1 | 0.16 (0.012) |
| GCSE | Skin_Sun_Exposed_Lower_leg | 0.5 | 0.163 (0.012) |
| GCSE | Skin_Sun_Exposed_Lower_leg | 1 | 0.163 (0.012) |
| GCSE | Skin_Sun_Exposed_Lower_leg | All | 0.17 (0.012) |
| GCSE | Small_Intestine_Terminal_Ileum | 1e.06 | 0.067 (0.012) |
| GCSE | Small_Intestine_Terminal_Ileum | 1e.05 | 0.074 (0.012) |
| GCSE | Small_Intestine_Terminal_Ileum | 1e.04 | 0.08 (0.012) |
| GCSE | Small_Intestine_Terminal_Ileum | 0.001 | 0.09 (0.012) |
| GCSE | Small_Intestine_Terminal_Ileum | 0.01 | 0.112 (0.012) |
| GCSE | Small_Intestine_Terminal_Ileum | 0.05 | 0.12 (0.012) |
| GCSE | Small_Intestine_Terminal_Ileum | 0.1 | 0.12 (0.012) |
| GCSE | Small_Intestine_Terminal_Ileum | 0.5 | 0.121 (0.012) |
| GCSE | Small_Intestine_Terminal_Ileum | 1 | 0.121 (0.012) |
| GCSE | Small_Intestine_Terminal_Ileum | All | 0.118 (0.012) |
| GCSE | Spleen | 1e.06 | 0.075 (0.012) |
| GCSE | Spleen | 1e.05 | 0.081 (0.012) |
| GCSE | Spleen | 1e.04 | 0.091 (0.012) |
| GCSE | Spleen | 0.001 | 0.11 (0.012) |
| GCSE | Spleen | 0.01 | 0.119 (0.012) |
| GCSE | Spleen | 0.05 | 0.129 (0.012) |
| GCSE | Spleen | 0.1 | 0.134 (0.012) |
| GCSE | Spleen | 0.5 | 0.139 (0.012) |
| GCSE | Spleen | 1 | 0.139 (0.012) |
| GCSE | Spleen | All | 0.136 (0.012) |
| GCSE | Stomach | 1e.06 | 0.066 (0.012) |
| GCSE | Stomach | 1e.05 | 0.074 (0.012) |
| GCSE | Stomach | 1e.04 | 0.075 (0.012) |
| GCSE | Stomach | 0.001 | 0.087 (0.012) |
| GCSE | Stomach | 0.01 | 0.102 (0.012) |
| GCSE | Stomach | 0.05 | 0.104 (0.012) |
| GCSE | Stomach | 0.1 | 0.105 (0.012) |
| GCSE | Stomach | 0.5 | 0.111 (0.012) |
| GCSE | Stomach | 1 | 0.111 (0.012) |
| GCSE | Stomach | All | 0.111 (0.012) |
| GCSE | Testis | 1e.06 | 0.092 (0.012) |
| GCSE | Testis | 1e.05 | 0.103 (0.012) |
| GCSE | Testis | 1e.04 | 0.113 (0.012) |
| GCSE | Testis | 0.001 | 0.13 (0.012) |
| GCSE | Testis | 0.01 | 0.146 (0.012) |
| GCSE | Testis | 0.05 | 0.152 (0.012) |
| GCSE | Testis | 0.1 | 0.157 (0.012) |
| GCSE | Testis | 0.5 | 0.163 (0.012) |
| GCSE | Testis | 1 | 0.163 (0.012) |
| GCSE | Testis | All | 0.161 (0.012) |
| GCSE | Thyroid | 1e.06 | 0.084 (0.012) |
| GCSE | Thyroid | 1e.05 | 0.097 (0.012) |
| GCSE | Thyroid | 1e.04 | 0.108 (0.012) |
| GCSE | Thyroid | 0.001 | 0.12 (0.012) |
| GCSE | Thyroid | 0.01 | 0.144 (0.012) |
| GCSE | Thyroid | 0.05 | 0.154 (0.012) |
| GCSE | Thyroid | 0.1 | 0.155 (0.012) |
| GCSE | Thyroid | 0.5 | 0.157 (0.012) |
| GCSE | Thyroid | 1 | 0.157 (0.012) |
| GCSE | Thyroid | All | 0.16 (0.012) |
| GCSE | Uterus | 1e.06 | 0.063 (0.012) |
| GCSE | Uterus | 1e.05 | 0.067 (0.012) |
| GCSE | Uterus | 1e.04 | 0.074 (0.012) |
| GCSE | Uterus | 0.001 | 0.084 (0.012) |
| GCSE | Uterus | 0.01 | 0.089 (0.012) |
| GCSE | Uterus | 0.05 | 0.096 (0.012) |
| GCSE | Uterus | 0.1 | 0.095 (0.012) |
| GCSE | Uterus | 0.5 | 0.093 (0.012) |
| GCSE | Uterus | 1 | 0.093 (0.012) |
| GCSE | Uterus | All | 0.093 (0.012) |
| GCSE | Vagina | 1e.06 | 0.07 (0.012) |
| GCSE | Vagina | 1e.05 | 0.08 (0.012) |
| GCSE | Vagina | 1e.04 | 0.081 (0.012) |
| GCSE | Vagina | 0.001 | 0.083 (0.012) |
| GCSE | Vagina | 0.01 | 0.091 (0.012) |
| GCSE | Vagina | 0.05 | 0.094 (0.012) |
| GCSE | Vagina | 0.1 | 0.094 (0.012) |
| GCSE | Vagina | 0.5 | 0.093 (0.012) |
| GCSE | Vagina | 1 | 0.093 (0.012) |
| GCSE | Vagina | All | 0.092 (0.012) |
| GCSE | Whole_Blood | 1e.06 | 0.096 (0.012) |
| GCSE | Whole_Blood | 1e.05 | 0.109 (0.012) |
| GCSE | Whole_Blood | 1e.04 | 0.115 (0.012) |
| GCSE | Whole_Blood | 0.001 | 0.128 (0.012) |
| GCSE | Whole_Blood | 0.01 | 0.145 (0.012) |
| GCSE | Whole_Blood | 0.05 | 0.152 (0.012) |
| GCSE | Whole_Blood | 0.1 | 0.157 (0.012) |
| GCSE | Whole_Blood | 0.5 | 0.159 (0.012) |
| GCSE | Whole_Blood | 1 | 0.159 (0.012) |
| GCSE | Whole_Blood | All | 0.157 (0.012) |
| GCSE | YFS.BLOOD.RNAARR | 1e.06 | 0.087 (0.012) |
| GCSE | YFS.BLOOD.RNAARR | 1e.05 | 0.096 (0.012) |
| GCSE | YFS.BLOOD.RNAARR | 1e.04 | 0.107 (0.012) |
| GCSE | YFS.BLOOD.RNAARR | 0.001 | 0.123 (0.012) |
| GCSE | YFS.BLOOD.RNAARR | 0.01 | 0.141 (0.012) |
| GCSE | YFS.BLOOD.RNAARR | 0.05 | 0.148 (0.012) |
| GCSE | YFS.BLOOD.RNAARR | 0.1 | 0.147 (0.012) |
| GCSE | YFS.BLOOD.RNAARR | 0.5 | 0.15 (0.012) |
| GCSE | YFS.BLOOD.RNAARR | 1 | 0.15 (0.012) |
| GCSE | YFS.BLOOD.RNAARR | All | 0.151 (0.012) |
| ADHD | Adipose_Subcutaneous | 1e.06 | 0.019 (0.011) |
| ADHD | Adipose_Subcutaneous | 1e.05 | 0.012 (0.011) |
| ADHD | Adipose_Subcutaneous | 1e.04 | 0.012 (0.011) |
| ADHD | Adipose_Subcutaneous | 0.001 | 0.008 (0.011) |
| ADHD | Adipose_Subcutaneous | 0.01 | 0.02 (0.011) |
| ADHD | Adipose_Subcutaneous | 0.05 | 0.031 (0.011) |
| ADHD | Adipose_Subcutaneous | 0.1 | 0.038 (0.011) |
| ADHD | Adipose_Subcutaneous | 0.5 | 0.053 (0.011) |
| ADHD | Adipose_Subcutaneous | 1 | 0.056 (0.011) |
| ADHD | Adipose_Subcutaneous | All | 0.054 (0.011) |
| ADHD | Adipose_Visceral_Omentum | 1e.06 | -0.014 (0.011) |
| ADHD | Adipose_Visceral_Omentum | 1e.05 | -0.02 (0.011) |
| ADHD | Adipose_Visceral_Omentum | 1e.04 | -0.014 (0.011) |
| ADHD | Adipose_Visceral_Omentum | 0.001 | 0.004 (0.011) |
| ADHD | Adipose_Visceral_Omentum | 0.01 | 0.027 (0.011) |
| ADHD | Adipose_Visceral_Omentum | 0.05 | 0.034 (0.011) |
| ADHD | Adipose_Visceral_Omentum | 0.1 | 0.028 (0.011) |
| ADHD | Adipose_Visceral_Omentum | 0.5 | 0.051 (0.011) |
| ADHD | Adipose_Visceral_Omentum | 1 | 0.05 (0.011) |
| ADHD | Adipose_Visceral_Omentum | All | 0.044 (0.011) |
| ADHD | Adrenal_Gland | 1e.05 | -0.006 (0.011) |
| ADHD | Adrenal_Gland | 1e.04 | -0.018 (0.011) |
| ADHD | Adrenal_Gland | 0.001 | -0.02 (0.011) |
| ADHD | Adrenal_Gland | 0.01 | 0.002 (0.011) |
| ADHD | Adrenal_Gland | 0.05 | 0.021 (0.011) |
| ADHD | Adrenal_Gland | 0.1 | 0.032 (0.011) |
| ADHD | Adrenal_Gland | 0.5 | 0.052 (0.011) |
| ADHD | Adrenal_Gland | 1 | 0.052 (0.011) |
| ADHD | Adrenal_Gland | All | 0.046 (0.011) |
| ADHD | Artery_Aorta | 1e.06 | 0.015 (0.011) |
| ADHD | Artery_Aorta | 1e.05 | 0.021 (0.011) |
| ADHD | Artery_Aorta | 1e.04 | 0.019 (0.011) |
| ADHD | Artery_Aorta | 0.001 | 0.009 (0.011) |
| ADHD | Artery_Aorta | 0.01 | 0.013 (0.011) |
| ADHD | Artery_Aorta | 0.05 | 0.026 (0.011) |
| ADHD | Artery_Aorta | 0.1 | 0.033 (0.011) |
| ADHD | Artery_Aorta | 0.5 | 0.058 (0.011) |
| ADHD | Artery_Aorta | 1 | 0.057 (0.011) |
| ADHD | Artery_Aorta | All | 0.054 (0.011) |
| ADHD | Artery_Coronary | 1e.06 | 0.02 (0.011) |
| ADHD | Artery_Coronary | 1e.05 | 0.014 (0.011) |
| ADHD | Artery_Coronary | 1e.04 | 0.012 (0.011) |
| ADHD | Artery_Coronary | 0.001 | 0.026 (0.011) |
| ADHD | Artery_Coronary | 0.01 | 0.007 (0.011) |
| ADHD | Artery_Coronary | 0.05 | 0.007 (0.011) |
| ADHD | Artery_Coronary | 0.1 | 0.029 (0.011) |
| ADHD | Artery_Coronary | 0.5 | 0.029 (0.011) |
| ADHD | Artery_Coronary | 1 | 0.026 (0.011) |
| ADHD | Artery_Coronary | All | 0.029 (0.011) |
| ADHD | Artery_Tibial | 1e.06 | 0.026 (0.011) |
| ADHD | Artery_Tibial | 1e.05 | 0.018 (0.011) |
| ADHD | Artery_Tibial | 1e.04 | 0.018 (0.011) |
| ADHD | Artery_Tibial | 0.001 | 0.028 (0.011) |
| ADHD | Artery_Tibial | 0.01 | 0.023 (0.011) |
| ADHD | Artery_Tibial | 0.05 | 0.033 (0.011) |
| ADHD | Artery_Tibial | 0.1 | 0.031 (0.011) |
| ADHD | Artery_Tibial | 0.5 | 0.053 (0.011) |
| ADHD | Artery_Tibial | 1 | 0.055 (0.011) |
| ADHD | Artery_Tibial | All | 0.05 (0.011) |
| ADHD | Brain_Amygdala | 1e.05 | -0.005 (0.011) |
| ADHD | Brain_Amygdala | 1e.04 | -0.012 (0.011) |
| ADHD | Brain_Amygdala | 0.001 | -0.007 (0.011) |
| ADHD | Brain_Amygdala | 0.01 | 0.012 (0.011) |
| ADHD | Brain_Amygdala | 0.05 | 0.004 (0.011) |
| ADHD | Brain_Amygdala | 0.1 | 0.009 (0.011) |
| ADHD | Brain_Amygdala | 0.5 | 0.016 (0.011) |
| ADHD | Brain_Amygdala | 1 | 0.018 (0.011) |
| ADHD | Brain_Amygdala | All | 0.001 (0.011) |
| ADHD | Brain_Anterior_cingulate_cortex_BA24 | 1e.05 | 0.011 (0.011) |
| ADHD | Brain_Anterior_cingulate_cortex_BA24 | 1e.04 | 0.005 (0.011) |
| ADHD | Brain_Anterior_cingulate_cortex_BA24 | 0.001 | -0.019 (0.011) |
| ADHD | Brain_Anterior_cingulate_cortex_BA24 | 0.01 | -0.012 (0.011) |
| ADHD | Brain_Anterior_cingulate_cortex_BA24 | 0.05 | 0.007 (0.011) |
| ADHD | Brain_Anterior_cingulate_cortex_BA24 | 0.1 | 0.02 (0.011) |
| ADHD | Brain_Anterior_cingulate_cortex_BA24 | 0.5 | 0.033 (0.011) |
| ADHD | Brain_Anterior_cingulate_cortex_BA24 | 1 | 0.039 (0.011) |
| ADHD | Brain_Anterior_cingulate_cortex_BA24 | All | 0.03 (0.011) |
| ADHD | Brain_Caudate_basal_ganglia | 1e.06 | 0.024 (0.011) |
| ADHD | Brain_Caudate_basal_ganglia | 1e.05 | 0.015 (0.011) |
| ADHD | Brain_Caudate_basal_ganglia | 1e.04 | 0.015 (0.011) |
| ADHD | Brain_Caudate_basal_ganglia | 0.001 | 0.006 (0.011) |
| ADHD | Brain_Caudate_basal_ganglia | 0.01 | 0.011 (0.011) |
| ADHD | Brain_Caudate_basal_ganglia | 0.05 | 0.024 (0.011) |
| ADHD | Brain_Caudate_basal_ganglia | 0.1 | 0.027 (0.011) |
| ADHD | Brain_Caudate_basal_ganglia | 0.5 | 0.041 (0.011) |
| ADHD | Brain_Caudate_basal_ganglia | 1 | 0.046 (0.011) |
| ADHD | Brain_Caudate_basal_ganglia | All | 0.046 (0.011) |
| ADHD | Brain_Cerebellar_Hemisphere | 1e.06 | 0.008 (0.011) |
| ADHD | Brain_Cerebellar_Hemisphere | 1e.05 | -0.017 (0.011) |
| ADHD | Brain_Cerebellar_Hemisphere | 1e.04 | -0.014 (0.011) |
| ADHD | Brain_Cerebellar_Hemisphere | 0.001 | -0.017 (0.011) |
| ADHD | Brain_Cerebellar_Hemisphere | 0.01 | 0.007 (0.011) |
| ADHD | Brain_Cerebellar_Hemisphere | 0.05 | 0.009 (0.011) |
| ADHD | Brain_Cerebellar_Hemisphere | 0.1 | 0.024 (0.011) |
| ADHD | Brain_Cerebellar_Hemisphere | 0.5 | 0.025 (0.011) |
| ADHD | Brain_Cerebellar_Hemisphere | 1 | 0.029 (0.011) |
| ADHD | Brain_Cerebellar_Hemisphere | All | 0.026 (0.011) |
| ADHD | Brain_Cerebellum | 1e.06 | 0.024 (0.011) |
| ADHD | Brain_Cerebellum | 1e.05 | 0.006 (0.011) |
| ADHD | Brain_Cerebellum | 1e.04 | 0.001 (0.011) |
| ADHD | Brain_Cerebellum | 0.001 | -0.019 (0.011) |
| ADHD | Brain_Cerebellum | 0.01 | 0.001 (0.011) |
| ADHD | Brain_Cerebellum | 0.05 | 0.008 (0.011) |
| ADHD | Brain_Cerebellum | 0.1 | 0.015 (0.011) |
| ADHD | Brain_Cerebellum | 0.5 | 0.025 (0.011) |
| ADHD | Brain_Cerebellum | 1 | 0.028 (0.011) |
| ADHD | Brain_Cerebellum | All | 0.033 (0.011) |
| ADHD | Brain_Cortex | 1e.05 | -0.028 (0.011) |
| ADHD | Brain_Cortex | 1e.04 | 0.018 (0.011) |
| ADHD | Brain_Cortex | 0.001 | 0.011 (0.011) |
| ADHD | Brain_Cortex | 0.01 | 0.007 (0.011) |
| ADHD | Brain_Cortex | 0.05 | 0.017 (0.011) |
| ADHD | Brain_Cortex | 0.1 | 0.009 (0.011) |
| ADHD | Brain_Cortex | 0.5 | 0.033 (0.011) |
| ADHD | Brain_Cortex | 1 | 0.036 (0.011) |
| ADHD | Brain_Cortex | All | 0.035 (0.011) |
| ADHD | Brain_Frontal_Cortex_BA9 | 1e.06 | 0.008 (0.011) |
| ADHD | Brain_Frontal_Cortex_BA9 | 1e.05 | 0.001 (0.011) |
| ADHD | Brain_Frontal_Cortex_BA9 | 1e.04 | -0.016 (0.011) |
| ADHD | Brain_Frontal_Cortex_BA9 | 0.001 | -0.019 (0.011) |
| ADHD | Brain_Frontal_Cortex_BA9 | 0.01 | 0.01 (0.011) |
| ADHD | Brain_Frontal_Cortex_BA9 | 0.05 | 0.001 (0.011) |
| ADHD | Brain_Frontal_Cortex_BA9 | 0.1 | 0.009 (0.011) |
| ADHD | Brain_Frontal_Cortex_BA9 | 0.5 | 0.035 (0.011) |
| ADHD | Brain_Frontal_Cortex_BA9 | 1 | 0.036 (0.011) |
| ADHD | Brain_Frontal_Cortex_BA9 | All | 0.026 (0.011) |
| ADHD | Brain_Hippocampus | 1e.06 | 0.008 (0.011) |
| ADHD | Brain_Hippocampus | 1e.05 | 0.015 (0.011) |
| ADHD | Brain_Hippocampus | 1e.04 | 0.019 (0.011) |
| ADHD | Brain_Hippocampus | 0.001 | -0.023 (0.011) |
| ADHD | Brain_Hippocampus | 0.01 | -0.001 (0.011) |
| ADHD | Brain_Hippocampus | 0.05 | 0.013 (0.011) |
| ADHD | Brain_Hippocampus | 0.1 | 0.013 (0.011) |
| ADHD | Brain_Hippocampus | 0.5 | 0.034 (0.011) |
| ADHD | Brain_Hippocampus | 1 | 0.032 (0.011) |
| ADHD | Brain_Hippocampus | All | 0.025 (0.011) |
| ADHD | Brain_Hypothalamus | 1e.05 | -0.01 (0.011) |
| ADHD | Brain_Hypothalamus | 1e.04 | -0.002 (0.011) |
| ADHD | Brain_Hypothalamus | 0.001 | 0.006 (0.011) |
| ADHD | Brain_Hypothalamus | 0.01 | 0.002 (0.011) |
| ADHD | Brain_Hypothalamus | 0.05 | 0.007 (0.011) |
| ADHD | Brain_Hypothalamus | 0.1 | 0.012 (0.011) |
| ADHD | Brain_Hypothalamus | 0.5 | 0.024 (0.011) |
| ADHD | Brain_Hypothalamus | 1 | 0.026 (0.011) |
| ADHD | Brain_Hypothalamus | All | 0.021 (0.011) |
| ADHD | Brain_Nucleus_accumbens_basal_ganglia | 1e.05 | -0.024 (0.011) |
| ADHD | Brain_Nucleus_accumbens_basal_ganglia | 1e.04 | -0.011 (0.011) |
| ADHD | Brain_Nucleus_accumbens_basal_ganglia | 0.001 | -0.012 (0.011) |
| ADHD | Brain_Nucleus_accumbens_basal_ganglia | 0.01 | -0.021 (0.011) |
| ADHD | Brain_Nucleus_accumbens_basal_ganglia | 0.05 | -0.01 (0.011) |
| ADHD | Brain_Nucleus_accumbens_basal_ganglia | 0.1 | 0.009 (0.011) |
| ADHD | Brain_Nucleus_accumbens_basal_ganglia | 0.5 | 0.017 (0.011) |
| ADHD | Brain_Nucleus_accumbens_basal_ganglia | 1 | 0.017 (0.011) |
| ADHD | Brain_Nucleus_accumbens_basal_ganglia | All | 0.001 (0.011) |
| ADHD | Brain_Putamen_basal_ganglia | 1e.06 | 0.043 (0.011) |
| ADHD | Brain_Putamen_basal_ganglia | 1e.05 | 0.002 (0.011) |
| ADHD | Brain_Putamen_basal_ganglia | 1e.04 | 0.008 (0.011) |
| ADHD | Brain_Putamen_basal_ganglia | 0.001 | 0.01 (0.011) |
| ADHD | Brain_Putamen_basal_ganglia | 0.01 | 0.012 (0.011) |
| ADHD | Brain_Putamen_basal_ganglia | 0.05 | 0.008 (0.011) |
| ADHD | Brain_Putamen_basal_ganglia | 0.1 | 0.021 (0.011) |
| ADHD | Brain_Putamen_basal_ganglia | 0.5 | 0.029 (0.011) |
| ADHD | Brain_Putamen_basal_ganglia | 1 | 0.029 (0.011) |
| ADHD | Brain_Putamen_basal_ganglia | All | 0.046 (0.011) |
| ADHD | Brain_Spinal_cord_cervical_c-1 | 1e.06 | -0.003 (0.011) |
| ADHD | Brain_Spinal_cord_cervical_c-1 | 1e.05 | -0.014 (0.011) |
| ADHD | Brain_Spinal_cord_cervical_c-1 | 1e.04 | -0.006 (0.011) |
| ADHD | Brain_Spinal_cord_cervical_c-1 | 0.001 | 0.017 (0.011) |
| ADHD | Brain_Spinal_cord_cervical_c-1 | 0.01 | 0.008 (0.011) |
| ADHD | Brain_Spinal_cord_cervical_c-1 | 0.05 | 0.002 (0.011) |
| ADHD | Brain_Spinal_cord_cervical_c-1 | 0.1 | 0.002 (0.011) |
| ADHD | Brain_Spinal_cord_cervical_c-1 | 0.5 | 0.005 (0.011) |
| ADHD | Brain_Spinal_cord_cervical_c-1 | 1 | 0.012 (0.011) |
| ADHD | Brain_Spinal_cord_cervical_c-1 | All | 0.003 (0.011) |
| ADHD | Brain_Substantia_nigra | 1e.06 | -0.006 (0.011) |
| ADHD | Brain_Substantia_nigra | 1e.05 | -0.006 (0.011) |
| ADHD | Brain_Substantia_nigra | 1e.04 | 0 (0.011) |
| ADHD | Brain_Substantia_nigra | 0.001 | 0.013 (0.011) |
| ADHD | Brain_Substantia_nigra | 0.01 | -0.009 (0.011) |
| ADHD | Brain_Substantia_nigra | 0.05 | -0.008 (0.011) |
| ADHD | Brain_Substantia_nigra | 0.1 | -0.007 (0.011) |
| ADHD | Brain_Substantia_nigra | 0.5 | 0.012 (0.011) |
| ADHD | Brain_Substantia_nigra | 1 | 0.011 (0.011) |
| ADHD | Brain_Substantia_nigra | All | -0.018 (0.011) |
| ADHD | Breast_Mammary_Tissue | 1e.06 | -0.023 (0.011) |
| ADHD | Breast_Mammary_Tissue | 1e.05 | -0.013 (0.011) |
| ADHD | Breast_Mammary_Tissue | 1e.04 | 0.005 (0.011) |
| ADHD | Breast_Mammary_Tissue | 0.001 | -0.018 (0.011) |
| ADHD | Breast_Mammary_Tissue | 0.01 | 0.018 (0.011) |
| ADHD | Breast_Mammary_Tissue | 0.05 | 0.023 (0.011) |
| ADHD | Breast_Mammary_Tissue | 0.1 | 0.018 (0.011) |
| ADHD | Breast_Mammary_Tissue | 0.5 | 0.039 (0.011) |
| ADHD | Breast_Mammary_Tissue | 1 | 0.043 (0.011) |
| ADHD | Breast_Mammary_Tissue | All | 0.046 (0.011) |
| ADHD | Cells_EBV-transformed_lymphocytes | 1e.06 | 0.039 (0.011) |
| ADHD | Cells_EBV-transformed_lymphocytes | 1e.05 | 0.032 (0.011) |
| ADHD | Cells_EBV-transformed_lymphocytes | 1e.04 | 0.02 (0.011) |
| ADHD | Cells_EBV-transformed_lymphocytes | 0.001 | 0.022 (0.011) |
| ADHD | Cells_EBV-transformed_lymphocytes | 0.01 | 0.016 (0.011) |
| ADHD | Cells_EBV-transformed_lymphocytes | 0.05 | 0.028 (0.011) |
| ADHD | Cells_EBV-transformed_lymphocytes | 0.1 | 0.029 (0.011) |
| ADHD | Cells_EBV-transformed_lymphocytes | 0.5 | 0.037 (0.011) |
| ADHD | Cells_EBV-transformed_lymphocytes | 1 | 0.037 (0.011) |
| ADHD | Cells_EBV-transformed_lymphocytes | All | 0.045 (0.011) |
| ADHD | Cells_Transformed_fibroblasts | 1e.06 | 0.019 (0.011) |
| ADHD | Cells_Transformed_fibroblasts | 1e.05 | 0.005 (0.011) |
| ADHD | Cells_Transformed_fibroblasts | 1e.04 | 0.017 (0.011) |
| ADHD | Cells_Transformed_fibroblasts | 0.001 | 0.018 (0.011) |
| ADHD | Cells_Transformed_fibroblasts | 0.01 | 0.032 (0.011) |
| ADHD | Cells_Transformed_fibroblasts | 0.05 | 0.03 (0.011) |
| ADHD | Cells_Transformed_fibroblasts | 0.1 | 0.037 (0.011) |
| ADHD | Cells_Transformed_fibroblasts | 0.5 | 0.053 (0.011) |
| ADHD | Cells_Transformed_fibroblasts | 1 | 0.054 (0.011) |
| ADHD | Cells_Transformed_fibroblasts | All | 0.045 (0.011) |
| ADHD | CMC.BRAIN.RNASEQ | 1e.06 | 0.013 (0.011) |
| ADHD | CMC.BRAIN.RNASEQ | 1e.05 | 0.011 (0.011) |
| ADHD | CMC.BRAIN.RNASEQ | 1e.04 | 0.011 (0.011) |
| ADHD | CMC.BRAIN.RNASEQ | 0.001 | 0.003 (0.011) |
| ADHD | CMC.BRAIN.RNASEQ | 0.01 | 0.014 (0.011) |
| ADHD | CMC.BRAIN.RNASEQ | 0.05 | 0.039 (0.011) |
| ADHD | CMC.BRAIN.RNASEQ | 0.1 | 0.038 (0.011) |
| ADHD | CMC.BRAIN.RNASEQ | 0.5 | 0.051 (0.011) |
| ADHD | CMC.BRAIN.RNASEQ | 1 | 0.051 (0.011) |
| ADHD | CMC.BRAIN.RNASEQ | All | 0.049 (0.011) |
| ADHD | CMC.BRAIN.RNASEQ_SPLICING | 1e.06 | 0.008 (0.011) |
| ADHD | CMC.BRAIN.RNASEQ_SPLICING | 1e.05 | 0.023 (0.011) |
| ADHD | CMC.BRAIN.RNASEQ_SPLICING | 1e.04 | 0.024 (0.011) |
| ADHD | CMC.BRAIN.RNASEQ_SPLICING | 0.001 | 0.014 (0.011) |
| ADHD | CMC.BRAIN.RNASEQ_SPLICING | 0.01 | 0.011 (0.011) |
| ADHD | CMC.BRAIN.RNASEQ_SPLICING | 0.05 | 0.025 (0.011) |
| ADHD | CMC.BRAIN.RNASEQ_SPLICING | 0.1 | 0.038 (0.011) |
| ADHD | CMC.BRAIN.RNASEQ_SPLICING | 0.5 | 0.053 (0.011) |
| ADHD | CMC.BRAIN.RNASEQ_SPLICING | 1 | 0.051 (0.011) |
| ADHD | CMC.BRAIN.RNASEQ_SPLICING | All | 0.054 (0.011) |
| ADHD | Colon_Sigmoid | 1e.06 | 0.022 (0.011) |
| ADHD | Colon_Sigmoid | 1e.05 | 0.023 (0.011) |
| ADHD | Colon_Sigmoid | 1e.04 | 0.009 (0.011) |
| ADHD | Colon_Sigmoid | 0.001 | 0.016 (0.011) |
| ADHD | Colon_Sigmoid | 0.01 | 0.023 (0.011) |
| ADHD | Colon_Sigmoid | 0.05 | 0.031 (0.011) |
| ADHD | Colon_Sigmoid | 0.1 | 0.031 (0.011) |
| ADHD | Colon_Sigmoid | 0.5 | 0.054 (0.011) |
| ADHD | Colon_Sigmoid | 1 | 0.053 (0.011) |
| ADHD | Colon_Sigmoid | All | 0.055 (0.011) |
| ADHD | Colon_Transverse | 1e.05 | -0.022 (0.011) |
| ADHD | Colon_Transverse | 1e.04 | -0.003 (0.011) |
| ADHD | Colon_Transverse | 0.001 | -0.016 (0.011) |
| ADHD | Colon_Transverse | 0.01 | 0.017 (0.011) |
| ADHD | Colon_Transverse | 0.05 | 0.027 (0.011) |
| ADHD | Colon_Transverse | 0.1 | 0.044 (0.011) |
| ADHD | Colon_Transverse | 0.5 | 0.055 (0.011) |
| ADHD | Colon_Transverse | 1 | 0.057 (0.011) |
| ADHD | Colon_Transverse | All | 0.044 (0.011) |
| ADHD | Esophagus_Gastroesophageal_Junction | 1e.06 | -0.027 (0.011) |
| ADHD | Esophagus_Gastroesophageal_Junction | 1e.05 | -0.013 (0.011) |
| ADHD | Esophagus_Gastroesophageal_Junction | 1e.04 | -0.013 (0.011) |
| ADHD | Esophagus_Gastroesophageal_Junction | 0.001 | 0.007 (0.011) |
| ADHD | Esophagus_Gastroesophageal_Junction | 0.01 | 0.024 (0.011) |
| ADHD | Esophagus_Gastroesophageal_Junction | 0.05 | 0.032 (0.011) |
| ADHD | Esophagus_Gastroesophageal_Junction | 0.1 | 0.03 (0.011) |
| ADHD | Esophagus_Gastroesophageal_Junction | 0.5 | 0.038 (0.011) |
| ADHD | Esophagus_Gastroesophageal_Junction | 1 | 0.039 (0.011) |
| ADHD | Esophagus_Gastroesophageal_Junction | All | 0.035 (0.011) |
| ADHD | Esophagus_Mucosa | 1e.06 | -0.001 (0.011) |
| ADHD | Esophagus_Mucosa | 1e.05 | -0.005 (0.011) |
| ADHD | Esophagus_Mucosa | 1e.04 | 0.008 (0.011) |
| ADHD | Esophagus_Mucosa | 0.001 | 0.021 (0.011) |
| ADHD | Esophagus_Mucosa | 0.01 | 0.024 (0.011) |
| ADHD | Esophagus_Mucosa | 0.05 | 0.039 (0.011) |
| ADHD | Esophagus_Mucosa | 0.1 | 0.045 (0.011) |
| ADHD | Esophagus_Mucosa | 0.5 | 0.06 (0.011) |
| ADHD | Esophagus_Mucosa | 1 | 0.059 (0.011) |
| ADHD | Esophagus_Mucosa | All | 0.059 (0.011) |
| ADHD | Esophagus_Muscularis | 1e.06 | 0.03 (0.011) |
| ADHD | Esophagus_Muscularis | 1e.05 | 0.034 (0.011) |
| ADHD | Esophagus_Muscularis | 1e.04 | 0.025 (0.011) |
| ADHD | Esophagus_Muscularis | 0.001 | 0.012 (0.011) |
| ADHD | Esophagus_Muscularis | 0.01 | 0.025 (0.011) |
| ADHD | Esophagus_Muscularis | 0.05 | 0.037 (0.011) |
| ADHD | Esophagus_Muscularis | 0.1 | 0.035 (0.011) |
| ADHD | Esophagus_Muscularis | 0.5 | 0.051 (0.011) |
| ADHD | Esophagus_Muscularis | 1 | 0.054 (0.011) |
| ADHD | Esophagus_Muscularis | All | 0.052 (0.011) |
| ADHD | Heart_Atrial_Appendage | 1e.06 | 0.028 (0.011) |
| ADHD | Heart_Atrial_Appendage | 1e.05 | 0.01 (0.011) |
| ADHD | Heart_Atrial_Appendage | 1e.04 | 0.01 (0.011) |
| ADHD | Heart_Atrial_Appendage | 0.001 | 0.013 (0.011) |
| ADHD | Heart_Atrial_Appendage | 0.01 | 0.02 (0.011) |
| ADHD | Heart_Atrial_Appendage | 0.05 | 0.03 (0.011) |
| ADHD | Heart_Atrial_Appendage | 0.1 | 0.033 (0.011) |
| ADHD | Heart_Atrial_Appendage | 0.5 | 0.043 (0.011) |
| ADHD | Heart_Atrial_Appendage | 1 | 0.046 (0.011) |
| ADHD | Heart_Atrial_Appendage | All | 0.051 (0.011) |
| ADHD | Heart_Left_Ventricle | 1e.06 | 0.021 (0.011) |
| ADHD | Heart_Left_Ventricle | 1e.05 | 0.025 (0.011) |
| ADHD | Heart_Left_Ventricle | 1e.04 | 0.017 (0.011) |
| ADHD | Heart_Left_Ventricle | 0.001 | 0.026 (0.011) |
| ADHD | Heart_Left_Ventricle | 0.01 | 0.029 (0.011) |
| ADHD | Heart_Left_Ventricle | 0.05 | 0.032 (0.011) |
| ADHD | Heart_Left_Ventricle | 0.1 | 0.027 (0.011) |
| ADHD | Heart_Left_Ventricle | 0.5 | 0.043 (0.011) |
| ADHD | Heart_Left_Ventricle | 1 | 0.043 (0.011) |
| ADHD | Heart_Left_Ventricle | All | 0.037 (0.011) |
| ADHD | Liver | 1e.06 | 0.035 (0.011) |
| ADHD | Liver | 1e.05 | 0.029 (0.011) |
| ADHD | Liver | 1e.04 | 0.008 (0.011) |
| ADHD | Liver | 0.001 | 0.001 (0.011) |
| ADHD | Liver | 0.01 | 0.005 (0.011) |
| ADHD | Liver | 0.05 | 0.02 (0.011) |
| ADHD | Liver | 0.1 | 0.018 (0.011) |
| ADHD | Liver | 0.5 | 0.03 (0.011) |
| ADHD | Liver | 1 | 0.026 (0.011) |
| ADHD | Liver | All | 0.039 (0.011) |
| ADHD | Lung | 1e.06 | 0.033 (0.011) |
| ADHD | Lung | 1e.05 | 0.021 (0.011) |
| ADHD | Lung | 1e.04 | 0.018 (0.011) |
| ADHD | Lung | 0.001 | 0.024 (0.011) |
| ADHD | Lung | 0.01 | 0.031 (0.011) |
| ADHD | Lung | 0.05 | 0.043 (0.011) |
| ADHD | Lung | 0.1 | 0.041 (0.011) |
| ADHD | Lung | 0.5 | 0.062 (0.011) |
| ADHD | Lung | 1 | 0.061 (0.011) |
| ADHD | Lung | All | 0.058 (0.011) |
| ADHD | METSIM.ADIPOSE.RNASEQ | 1e.05 | 0.016 (0.011) |
| ADHD | METSIM.ADIPOSE.RNASEQ | 1e.04 | -0.003 (0.011) |
| ADHD | METSIM.ADIPOSE.RNASEQ | 0.001 | -0.011 (0.011) |
| ADHD | METSIM.ADIPOSE.RNASEQ | 0.01 | 0.028 (0.011) |
| ADHD | METSIM.ADIPOSE.RNASEQ | 0.05 | 0.037 (0.011) |
| ADHD | METSIM.ADIPOSE.RNASEQ | 0.1 | 0.04 (0.011) |
| ADHD | METSIM.ADIPOSE.RNASEQ | 0.5 | 0.057 (0.011) |
| ADHD | METSIM.ADIPOSE.RNASEQ | 1 | 0.058 (0.011) |
| ADHD | METSIM.ADIPOSE.RNASEQ | All | 0.046 (0.011) |
| ADHD | Minor_Salivary_Gland | 1e.06 | 0 (0.011) |
| ADHD | Minor_Salivary_Gland | 1e.05 | 0.002 (0.011) |
| ADHD | Minor_Salivary_Gland | 1e.04 | -0.02 (0.011) |
| ADHD | Minor_Salivary_Gland | 0.001 | -0.021 (0.011) |
| ADHD | Minor_Salivary_Gland | 0.01 | -0.016 (0.011) |
| ADHD | Minor_Salivary_Gland | 0.05 | -0.008 (0.011) |
| ADHD | Minor_Salivary_Gland | 0.1 | 0.001 (0.011) |
| ADHD | Minor_Salivary_Gland | 0.5 | 0.014 (0.011) |
| ADHD | Minor_Salivary_Gland | 1 | 0.015 (0.011) |
| ADHD | Minor_Salivary_Gland | All | -0.002 (0.011) |
| ADHD | Muscle_Skeletal | 1e.06 | 0.036 (0.011) |
| ADHD | Muscle_Skeletal | 1e.05 | 0.034 (0.011) |
| ADHD | Muscle_Skeletal | 1e.04 | 0.027 (0.011) |
| ADHD | Muscle_Skeletal | 0.001 | 0.006 (0.011) |
| ADHD | Muscle_Skeletal | 0.01 | 0.018 (0.011) |
| ADHD | Muscle_Skeletal | 0.05 | 0.038 (0.011) |
| ADHD | Muscle_Skeletal | 0.1 | 0.036 (0.011) |
| ADHD | Muscle_Skeletal | 0.5 | 0.055 (0.011) |
| ADHD | Muscle_Skeletal | 1 | 0.051 (0.011) |
| ADHD | Muscle_Skeletal | All | 0.063 (0.011) |
| ADHD | Nerve_Tibial | 1e.06 | 0.005 (0.011) |
| ADHD | Nerve_Tibial | 1e.05 | 0.005 (0.011) |
| ADHD | Nerve_Tibial | 1e.04 | 0 (0.011) |
| ADHD | Nerve_Tibial | 0.001 | -0.003 (0.011) |
| ADHD | Nerve_Tibial | 0.01 | 0.016 (0.011) |
| ADHD | Nerve_Tibial | 0.05 | 0.011 (0.011) |
| ADHD | Nerve_Tibial | 0.1 | 0.017 (0.011) |
| ADHD | Nerve_Tibial | 0.5 | 0.034 (0.011) |
| ADHD | Nerve_Tibial | 1 | 0.036 (0.011) |
| ADHD | Nerve_Tibial | All | 0.03 (0.011) |
| ADHD | NTR.BLOOD.RNAARR | 1e.04 | -0.011 (0.011) |
| ADHD | NTR.BLOOD.RNAARR | 0.001 | -0.028 (0.011) |
| ADHD | NTR.BLOOD.RNAARR | 0.01 | 0.009 (0.011) |
| ADHD | NTR.BLOOD.RNAARR | 0.05 | 0.007 (0.011) |
| ADHD | NTR.BLOOD.RNAARR | 0.1 | 0.023 (0.011) |
| ADHD | NTR.BLOOD.RNAARR | 0.5 | 0.027 (0.011) |
| ADHD | NTR.BLOOD.RNAARR | 1 | 0.034 (0.011) |
| ADHD | NTR.BLOOD.RNAARR | All | 0.027 (0.011) |
| ADHD | Ovary | 1e.05 | -0.018 (0.011) |
| ADHD | Ovary | 1e.04 | -0.018 (0.011) |
| ADHD | Ovary | 0.001 | -0.024 (0.011) |
| ADHD | Ovary | 0.01 | 0.011 (0.011) |
| ADHD | Ovary | 0.05 | 0.011 (0.011) |
| ADHD | Ovary | 0.1 | 0.017 (0.011) |
| ADHD | Ovary | 0.5 | 0.036 (0.011) |
| ADHD | Ovary | 1 | 0.037 (0.011) |
| ADHD | Ovary | All | 0.032 (0.011) |
| ADHD | Pancreas | 1e.05 | 0.004 (0.011) |
| ADHD | Pancreas | 1e.04 | -0.015 (0.011) |
| ADHD | Pancreas | 0.001 | 0.005 (0.011) |
| ADHD | Pancreas | 0.01 | 0.004 (0.011) |
| ADHD | Pancreas | 0.05 | 0.016 (0.011) |
| ADHD | Pancreas | 0.1 | 0.026 (0.011) |
| ADHD | Pancreas | 0.5 | 0.037 (0.011) |
| ADHD | Pancreas | 1 | 0.037 (0.011) |
| ADHD | Pancreas | All | 0.034 (0.011) |
| ADHD | Pituitary | 1e.06 | -0.002 (0.011) |
| ADHD | Pituitary | 1e.05 | -0.004 (0.011) |
| ADHD | Pituitary | 1e.04 | -0.02 (0.011) |
| ADHD | Pituitary | 0.001 | -0.02 (0.011) |
| ADHD | Pituitary | 0.01 | 0.014 (0.011) |
| ADHD | Pituitary | 0.05 | 0.018 (0.011) |
| ADHD | Pituitary | 0.1 | 0.024 (0.011) |
| ADHD | Pituitary | 0.5 | 0.041 (0.011) |
| ADHD | Pituitary | 1 | 0.042 (0.011) |
| ADHD | Pituitary | All | 0.031 (0.011) |
| ADHD | Prostate | 1e.06 | -0.003 (0.011) |
| ADHD | Prostate | 1e.05 | -0.023 (0.011) |
| ADHD | Prostate | 1e.04 | -0.015 (0.011) |
| ADHD | Prostate | 0.001 | -0.012 (0.011) |
| ADHD | Prostate | 0.01 | 0.003 (0.011) |
| ADHD | Prostate | 0.05 | 0.004 (0.011) |
| ADHD | Prostate | 0.1 | 0.002 (0.011) |
| ADHD | Prostate | 0.5 | 0.024 (0.011) |
| ADHD | Prostate | 1 | 0.024 (0.011) |
| ADHD | Prostate | All | 0.023 (0.011) |
| ADHD | Skin_Not_Sun_Exposed_Suprapubic | 1e.06 | 0.018 (0.011) |
| ADHD | Skin_Not_Sun_Exposed_Suprapubic | 1e.05 | 0.017 (0.011) |
| ADHD | Skin_Not_Sun_Exposed_Suprapubic | 1e.04 | 0.026 (0.011) |
| ADHD | Skin_Not_Sun_Exposed_Suprapubic | 0.001 | 0.024 (0.011) |
| ADHD | Skin_Not_Sun_Exposed_Suprapubic | 0.01 | 0.034 (0.011) |
| ADHD | Skin_Not_Sun_Exposed_Suprapubic | 0.05 | 0.038 (0.011) |
| ADHD | Skin_Not_Sun_Exposed_Suprapubic | 0.1 | 0.039 (0.011) |
| ADHD | Skin_Not_Sun_Exposed_Suprapubic | 0.5 | 0.054 (0.011) |
| ADHD | Skin_Not_Sun_Exposed_Suprapubic | 1 | 0.055 (0.011) |
| ADHD | Skin_Not_Sun_Exposed_Suprapubic | All | 0.053 (0.011) |
| ADHD | Skin_Sun_Exposed_Lower_leg | 1e.06 | 0.003 (0.011) |
| ADHD | Skin_Sun_Exposed_Lower_leg | 1e.05 | -0.005 (0.011) |
| ADHD | Skin_Sun_Exposed_Lower_leg | 1e.04 | -0.007 (0.011) |
| ADHD | Skin_Sun_Exposed_Lower_leg | 0.001 | 0.004 (0.011) |
| ADHD | Skin_Sun_Exposed_Lower_leg | 0.01 | 0.021 (0.011) |
| ADHD | Skin_Sun_Exposed_Lower_leg | 0.05 | 0.026 (0.011) |
| ADHD | Skin_Sun_Exposed_Lower_leg | 0.1 | 0.03 (0.011) |
| ADHD | Skin_Sun_Exposed_Lower_leg | 0.5 | 0.056 (0.011) |
| ADHD | Skin_Sun_Exposed_Lower_leg | 1 | 0.056 (0.011) |
| ADHD | Skin_Sun_Exposed_Lower_leg | All | 0.055 (0.011) |
| ADHD | Small_Intestine_Terminal_Ileum | 1e.06 | 0.023 (0.011) |
| ADHD | Small_Intestine_Terminal_Ileum | 1e.05 | 0.006 (0.011) |
| ADHD | Small_Intestine_Terminal_Ileum | 1e.04 | 0.012 (0.011) |
| ADHD | Small_Intestine_Terminal_Ileum | 0.001 | 0.014 (0.011) |
| ADHD | Small_Intestine_Terminal_Ileum | 0.01 | -0.02 (0.011) |
| ADHD | Small_Intestine_Terminal_Ileum | 0.05 | 0.015 (0.011) |
| ADHD | Small_Intestine_Terminal_Ileum | 0.1 | 0.022 (0.011) |
| ADHD | Small_Intestine_Terminal_Ileum | 0.5 | 0.039 (0.011) |
| ADHD | Small_Intestine_Terminal_Ileum | 1 | 0.04 (0.011) |
| ADHD | Small_Intestine_Terminal_Ileum | All | 0.043 (0.011) |
| ADHD | Spleen | 1e.06 | -0.003 (0.011) |
| ADHD | Spleen | 1e.05 | -0.024 (0.011) |
| ADHD | Spleen | 1e.04 | -0.021 (0.011) |
| ADHD | Spleen | 0.001 | 0.002 (0.011) |
| ADHD | Spleen | 0.01 | 0.013 (0.011) |
| ADHD | Spleen | 0.05 | 0.009 (0.011) |
| ADHD | Spleen | 0.1 | 0.012 (0.011) |
| ADHD | Spleen | 0.5 | 0.024 (0.011) |
| ADHD | Spleen | 1 | 0.027 (0.011) |
| ADHD | Spleen | All | 0.011 (0.011) |
| ADHD | Stomach | 1e.06 | 0.013 (0.011) |
| ADHD | Stomach | 1e.05 | 0.014 (0.011) |
| ADHD | Stomach | 1e.04 | -0.002 (0.011) |
| ADHD | Stomach | 0.001 | -0.001 (0.011) |
| ADHD | Stomach | 0.01 | 0.019 (0.011) |
| ADHD | Stomach | 0.05 | 0.03 (0.011) |
| ADHD | Stomach | 0.1 | 0.028 (0.011) |
| ADHD | Stomach | 0.5 | 0.052 (0.011) |
| ADHD | Stomach | 1 | 0.048 (0.011) |
| ADHD | Stomach | All | 0.056 (0.011) |
| ADHD | Testis | 1e.06 | -0.006 (0.011) |
| ADHD | Testis | 1e.05 | -0.01 (0.011) |
| ADHD | Testis | 1e.04 | -0.002 (0.011) |
| ADHD | Testis | 0.001 | -0.007 (0.011) |
| ADHD | Testis | 0.01 | 0.027 (0.011) |
| ADHD | Testis | 0.05 | 0.031 (0.011) |
| ADHD | Testis | 0.1 | 0.038 (0.011) |
| ADHD | Testis | 0.5 | 0.043 (0.011) |
| ADHD | Testis | 1 | 0.041 (0.011) |
| ADHD | Testis | All | 0.039 (0.011) |
| ADHD | Thyroid | 1e.06 | -0.008 (0.011) |
| ADHD | Thyroid | 1e.05 | 0.005 (0.011) |
| ADHD | Thyroid | 1e.04 | 0.005 (0.011) |
| ADHD | Thyroid | 0.001 | 0.018 (0.011) |
| ADHD | Thyroid | 0.01 | 0.024 (0.011) |
| ADHD | Thyroid | 0.05 | 0.018 (0.011) |
| ADHD | Thyroid | 0.1 | 0.029 (0.011) |
| ADHD | Thyroid | 0.5 | 0.043 (0.011) |
| ADHD | Thyroid | 1 | 0.044 (0.011) |
| ADHD | Thyroid | All | 0.039 (0.011) |
| ADHD | Uterus | 1e.04 | -0.002 (0.011) |
| ADHD | Uterus | 0.001 | 0.007 (0.011) |
| ADHD | Uterus | 0.01 | 0.008 (0.011) |
| ADHD | Uterus | 0.05 | 0.01 (0.011) |
| ADHD | Uterus | 0.1 | 0.018 (0.011) |
| ADHD | Uterus | 0.5 | 0.037 (0.011) |
| ADHD | Uterus | 1 | 0.04 (0.011) |
| ADHD | Uterus | All | 0.044 (0.011) |
| ADHD | Vagina | 1e.05 | -0.025 (0.011) |
| ADHD | Vagina | 1e.04 | -0.008 (0.011) |
| ADHD | Vagina | 0.001 | 0.014 (0.011) |
| ADHD | Vagina | 0.01 | 0.022 (0.011) |
| ADHD | Vagina | 0.05 | 0.02 (0.011) |
| ADHD | Vagina | 0.1 | 0.031 (0.011) |
| ADHD | Vagina | 0.5 | 0.039 (0.011) |
| ADHD | Vagina | 1 | 0.039 (0.011) |
| ADHD | Vagina | All | 0.036 (0.011) |
| ADHD | Whole_Blood | 1e.06 | 0.019 (0.011) |
| ADHD | Whole_Blood | 1e.05 | 0.007 (0.011) |
| ADHD | Whole_Blood | 1e.04 | 0.004 (0.011) |
| ADHD | Whole_Blood | 0.001 | 0.023 (0.011) |
| ADHD | Whole_Blood | 0.01 | 0.022 (0.011) |
| ADHD | Whole_Blood | 0.05 | 0.03 (0.011) |
| ADHD | Whole_Blood | 0.1 | 0.045 (0.011) |
| ADHD | Whole_Blood | 0.5 | 0.052 (0.011) |
| ADHD | Whole_Blood | 1 | 0.053 (0.011) |
| ADHD | Whole_Blood | All | 0.046 (0.011) |
| ADHD | YFS.BLOOD.RNAARR | 1e.05 | -0.018 (0.011) |
| ADHD | YFS.BLOOD.RNAARR | 1e.04 | 0.008 (0.011) |
| ADHD | YFS.BLOOD.RNAARR | 0.001 | 0.01 (0.011) |
| ADHD | YFS.BLOOD.RNAARR | 0.01 | 0.013 (0.011) |
| ADHD | YFS.BLOOD.RNAARR | 0.05 | 0.019 (0.011) |
| ADHD | YFS.BLOOD.RNAARR | 0.1 | 0.024 (0.011) |
| ADHD | YFS.BLOOD.RNAARR | 0.5 | 0.044 (0.011) |
| ADHD | YFS.BLOOD.RNAARR | 1 | 0.042 (0.011) |
| ADHD | YFS.BLOOD.RNAARR | All | 0.043 (0.011) |
| Phenotype | Weight | Model | R (SE) | P |
|---|---|---|---|---|
| Height21 | Adipose_Subcutaneous | 0.5 | 0.211 (0.013) | 0.00e+00 |
| Height21 | Adipose_Visceral_Omentum | 0.1 | 0.196 (0.013) | 0.00e+00 |
| Height21 | Adrenal_Gland | All | 0.161 (0.013) | 0.00e+00 |
| Height21 | Artery_Aorta | All | 0.193 (0.013) | 0.00e+00 |
| Height21 | Artery_Coronary | 1 | 0.149 (0.013) | 0.00e+00 |
| Height21 | Artery_Tibial | 0.5 | 0.207 (0.013) | 0.00e+00 |
| Height21 | Brain_Amygdala | 1 | 0.127 (0.013) | 0.00e+00 |
| Height21 | Brain_Anterior_cingulate_cortex_BA24 | 1 | 0.108 (0.013) | 0.00e+00 |
| Height21 | Brain_Caudate_basal_ganglia | 1 | 0.123 (0.013) | 0.00e+00 |
| Height21 | Brain_Cerebellar_Hemisphere | 0.01 | 0.151 (0.013) | 0.00e+00 |
| Height21 | Brain_Cerebellum | 0.5 | 0.164 (0.013) | 0.00e+00 |
| Height21 | Brain_Cortex | 1 | 0.14 (0.013) | 0.00e+00 |
| Height21 | Brain_Frontal_Cortex_BA9 | 0.5 | 0.131 (0.013) | 0.00e+00 |
| Height21 | Brain_Hippocampus | 0.5 | 0.106 (0.013) | 0.00e+00 |
| Height21 | Brain_Hypothalamus | 0.1 | 0.11 (0.013) | 0.00e+00 |
| Height21 | Brain_Nucleus_accumbens_basal_ganglia | 0.1 | 0.123 (0.013) | 0.00e+00 |
| Height21 | Brain_Putamen_basal_ganglia | 0.1 | 0.118 (0.013) | 0.00e+00 |
| Height21 | Brain_Spinal_cord_cervical_c-1 | 1 | 0.106 (0.013) | 0.00e+00 |
| Height21 | Brain_Substantia_nigra | 0.1 | 0.104 (0.013) | 0.00e+00 |
| Height21 | Breast_Mammary_Tissue | All | 0.182 (0.013) | 0.00e+00 |
| Height21 | Cells_EBV-transformed_lymphocytes | 0.5 | 0.148 (0.013) | 0.00e+00 |
| Height21 | Cells_Transformed_fibroblasts | 1 | 0.19 (0.013) | 0.00e+00 |
| Height21 | CMC.BRAIN.RNASEQ | All | 0.184 (0.013) | 0.00e+00 |
| Height21 | CMC.BRAIN.RNASEQ_SPLICING | 1 | 0.147 (0.013) | 0.00e+00 |
| Height21 | Colon_Sigmoid | 1 | 0.16 (0.013) | 0.00e+00 |
| Height21 | Colon_Transverse | 1 | 0.171 (0.013) | 0.00e+00 |
| Height21 | Esophagus_Gastroesophageal_Junction | 1 | 0.178 (0.013) | 0.00e+00 |
| Height21 | Esophagus_Mucosa | 1 | 0.194 (0.013) | 0.00e+00 |
| Height21 | Esophagus_Muscularis | 0.5 | 0.196 (0.013) | 0.00e+00 |
| Height21 | Heart_Atrial_Appendage | 1 | 0.163 (0.013) | 0.00e+00 |
| Height21 | Heart_Left_Ventricle | 0.5 | 0.159 (0.013) | 0.00e+00 |
| Height21 | Liver | 0.5 | 0.147 (0.013) | 0.00e+00 |
| Height21 | Lung | 0.05 | 0.187 (0.013) | 0.00e+00 |
| Height21 | METSIM.ADIPOSE.RNASEQ | 0.1 | 0.181 (0.013) | 0.00e+00 |
| Height21 | Minor_Salivary_Gland | 0.1 | 0.107 (0.013) | 0.00e+00 |
| Height21 | Muscle_Skeletal | 1 | 0.185 (0.013) | 0.00e+00 |
| Height21 | Nerve_Tibial | All | 0.22 (0.013) | 0.00e+00 |
| Height21 | NTR.BLOOD.RNAARR | All | 0.155 (0.013) | 0.00e+00 |
| Height21 | Ovary | 0.05 | 0.121 (0.013) | 0.00e+00 |
| Height21 | Pancreas | 0.05 | 0.17 (0.013) | 0.00e+00 |
| Height21 | Pituitary | All | 0.166 (0.013) | 0.00e+00 |
| Height21 | Prostate | 1 | 0.122 (0.013) | 0.00e+00 |
| Height21 | Skin_Not_Sun_Exposed_Suprapubic | 0.5 | 0.183 (0.013) | 0.00e+00 |
| Height21 | Skin_Sun_Exposed_Lower_leg | 0.5 | 0.209 (0.013) | 0.00e+00 |
| Height21 | Small_Intestine_Terminal_Ileum | 1 | 0.131 (0.013) | 0.00e+00 |
| Height21 | Spleen | All | 0.171 (0.013) | 0.00e+00 |
| Height21 | Stomach | 0.05 | 0.171 (0.013) | 0.00e+00 |
| Height21 | Testis | All | 0.193 (0.013) | 0.00e+00 |
| Height21 | Thyroid | 0.5 | 0.205 (0.013) | 0.00e+00 |
| Height21 | Uterus | 1 | 0.104 (0.013) | 0.00e+00 |
| Height21 | Vagina | All | 0.12 (0.013) | 0.00e+00 |
| Height21 | Whole_Blood | All | 0.174 (0.013) | 0.00e+00 |
| Height21 | YFS.BLOOD.RNAARR | 0.5 | 0.194 (0.013) | 0.00e+00 |
| BMI21 | Adipose_Subcutaneous | All | 0.122 (0.014) | 0.00e+00 |
| BMI21 | Adipose_Visceral_Omentum | 1 | 0.104 (0.014) | 0.00e+00 |
| BMI21 | Adrenal_Gland | 1 | 0.089 (0.014) | 0.00e+00 |
| BMI21 | Artery_Aorta | 0.5 | 0.09 (0.014) | 0.00e+00 |
| BMI21 | Artery_Coronary | 0.1 | 0.071 (0.014) | 0.00e+00 |
| BMI21 | Artery_Tibial | All | 0.123 (0.014) | 0.00e+00 |
| BMI21 | Brain_Amygdala | 0.1 | 0.083 (0.014) | 0.00e+00 |
| BMI21 | Brain_Anterior_cingulate_cortex_BA24 | All | 0.097 (0.014) | 0.00e+00 |
| BMI21 | Brain_Caudate_basal_ganglia | All | 0.077 (0.014) | 0.00e+00 |
| BMI21 | Brain_Cerebellar_Hemisphere | All | 0.092 (0.014) | 0.00e+00 |
| BMI21 | Brain_Cerebellum | All | 0.116 (0.014) | 0.00e+00 |
| BMI21 | Brain_Cortex | All | 0.092 (0.014) | 0.00e+00 |
| BMI21 | Brain_Frontal_Cortex_BA9 | 0.5 | 0.077 (0.014) | 0.00e+00 |
| BMI21 | Brain_Hippocampus | 0.5 | 0.071 (0.014) | 0.00e+00 |
| BMI21 | Brain_Hypothalamus | 1 | 0.051 (0.014) | 0.00e+00 |
| BMI21 | Brain_Nucleus_accumbens_basal_ganglia | 0.5 | 0.051 (0.014) | 0.00e+00 |
| BMI21 | Brain_Putamen_basal_ganglia | All | 0.077 (0.014) | 0.00e+00 |
| BMI21 | Brain_Spinal_cord_cervical_c-1 | 0.05 | 0.052 (0.014) | 0.00e+00 |
| BMI21 | Brain_Substantia_nigra | 0.5 | 0.04 (0.014) | 4.00e-03 |
| BMI21 | Breast_Mammary_Tissue | 1 | 0.078 (0.014) | 0.00e+00 |
| BMI21 | Cells_EBV-transformed_lymphocytes | 0.05 | 0.093 (0.014) | 0.00e+00 |
| BMI21 | Cells_Transformed_fibroblasts | 1 | 0.099 (0.014) | 0.00e+00 |
| BMI21 | CMC.BRAIN.RNASEQ | 0.5 | 0.111 (0.014) | 0.00e+00 |
| BMI21 | CMC.BRAIN.RNASEQ_SPLICING | 0.05 | 0.096 (0.014) | 0.00e+00 |
| BMI21 | Colon_Sigmoid | All | 0.067 (0.014) | 0.00e+00 |
| BMI21 | Colon_Transverse | 0.5 | 0.076 (0.014) | 0.00e+00 |
| BMI21 | Esophagus_Gastroesophageal_Junction | All | 0.078 (0.014) | 0.00e+00 |
| BMI21 | Esophagus_Mucosa | All | 0.097 (0.014) | 0.00e+00 |
| BMI21 | Esophagus_Muscularis | All | 0.107 (0.014) | 0.00e+00 |
| BMI21 | Heart_Atrial_Appendage | All | 0.107 (0.014) | 0.00e+00 |
| BMI21 | Heart_Left_Ventricle | 0.1 | 0.084 (0.014) | 0.00e+00 |
| BMI21 | Liver | All | 0.08 (0.014) | 0.00e+00 |
| BMI21 | Lung | All | 0.104 (0.014) | 0.00e+00 |
| BMI21 | METSIM.ADIPOSE.RNASEQ | 0.5 | 0.099 (0.014) | 0.00e+00 |
| BMI21 | Minor_Salivary_Gland | 0.001 | 0.022 (0.014) | 1.05e-01 |
| BMI21 | Muscle_Skeletal | 0.5 | 0.106 (0.014) | 0.00e+00 |
| BMI21 | Nerve_Tibial | All | 0.117 (0.014) | 0.00e+00 |
| BMI21 | NTR.BLOOD.RNAARR | 0.1 | 0.08 (0.014) | 0.00e+00 |
| BMI21 | Ovary | All | 0.058 (0.014) | 0.00e+00 |
| BMI21 | Pancreas | 1 | 0.093 (0.014) | 0.00e+00 |
| BMI21 | Pituitary | All | 0.077 (0.014) | 0.00e+00 |
| BMI21 | Prostate | All | 0.061 (0.014) | 0.00e+00 |
| BMI21 | Skin_Not_Sun_Exposed_Suprapubic | 0.1 | 0.096 (0.014) | 0.00e+00 |
| BMI21 | Skin_Sun_Exposed_Lower_leg | 1 | 0.098 (0.014) | 0.00e+00 |
| BMI21 | Small_Intestine_Terminal_Ileum | 0.1 | 0.075 (0.014) | 0.00e+00 |
| BMI21 | Spleen | All | 0.09 (0.014) | 0.00e+00 |
| BMI21 | Stomach | 0.1 | 0.093 (0.014) | 0.00e+00 |
| BMI21 | Testis | All | 0.119 (0.014) | 0.00e+00 |
| BMI21 | Thyroid | 1 | 0.096 (0.014) | 0.00e+00 |
| BMI21 | Uterus | 1 | 0.043 (0.014) | 2.00e-03 |
| BMI21 | Vagina | 1 | 0.066 (0.014) | 0.00e+00 |
| BMI21 | Whole_Blood | All | 0.097 (0.014) | 0.00e+00 |
| BMI21 | YFS.BLOOD.RNAARR | 0.5 | 0.086 (0.014) | 0.00e+00 |
| GCSE | Adipose_Subcutaneous | All | 0.16 (0.012) | 0.00e+00 |
| GCSE | Adipose_Visceral_Omentum | 0.5 | 0.158 (0.012) | 0.00e+00 |
| GCSE | Adrenal_Gland | 0.1 | 0.125 (0.012) | 0.00e+00 |
| GCSE | Artery_Aorta | All | 0.135 (0.012) | 0.00e+00 |
| GCSE | Artery_Coronary | All | 0.122 (0.012) | 0.00e+00 |
| GCSE | Artery_Tibial | All | 0.165 (0.012) | 0.00e+00 |
| GCSE | Brain_Amygdala | 0.05 | 0.097 (0.012) | 0.00e+00 |
| GCSE | Brain_Anterior_cingulate_cortex_BA24 | All | 0.129 (0.012) | 0.00e+00 |
| GCSE | Brain_Caudate_basal_ganglia | 0.1 | 0.126 (0.012) | 0.00e+00 |
| GCSE | Brain_Cerebellar_Hemisphere | 0.5 | 0.142 (0.012) | 0.00e+00 |
| GCSE | Brain_Cerebellum | 1 | 0.144 (0.012) | 0.00e+00 |
| GCSE | Brain_Cortex | 1 | 0.133 (0.012) | 0.00e+00 |
| GCSE | Brain_Frontal_Cortex_BA9 | 1 | 0.115 (0.012) | 0.00e+00 |
| GCSE | Brain_Hippocampus | 1 | 0.124 (0.012) | 0.00e+00 |
| GCSE | Brain_Hypothalamus | 1 | 0.108 (0.012) | 0.00e+00 |
| GCSE | Brain_Nucleus_accumbens_basal_ganglia | 0.5 | 0.116 (0.012) | 0.00e+00 |
| GCSE | Brain_Putamen_basal_ganglia | 1 | 0.126 (0.012) | 0.00e+00 |
| GCSE | Brain_Spinal_cord_cervical_c-1 | All | 0.109 (0.012) | 0.00e+00 |
| GCSE | Brain_Substantia_nigra | 0.05 | 0.104 (0.012) | 0.00e+00 |
| GCSE | Breast_Mammary_Tissue | 0.5 | 0.14 (0.012) | 0.00e+00 |
| GCSE | Cells_EBV-transformed_lymphocytes | 0.05 | 0.119 (0.012) | 0.00e+00 |
| GCSE | Cells_Transformed_fibroblasts | All | 0.16 (0.012) | 0.00e+00 |
| GCSE | CMC.BRAIN.RNASEQ | All | 0.181 (0.012) | 0.00e+00 |
| GCSE | CMC.BRAIN.RNASEQ_SPLICING | 0.5 | 0.134 (0.012) | 0.00e+00 |
| GCSE | Colon_Sigmoid | 0.5 | 0.129 (0.012) | 0.00e+00 |
| GCSE | Colon_Transverse | 1 | 0.132 (0.012) | 0.00e+00 |
| GCSE | Esophagus_Gastroesophageal_Junction | All | 0.133 (0.012) | 0.00e+00 |
| GCSE | Esophagus_Mucosa | All | 0.152 (0.012) | 0.00e+00 |
| GCSE | Esophagus_Muscularis | All | 0.156 (0.012) | 0.00e+00 |
| GCSE | Heart_Atrial_Appendage | 0.5 | 0.142 (0.012) | 0.00e+00 |
| GCSE | Heart_Left_Ventricle | All | 0.148 (0.012) | 0.00e+00 |
| GCSE | Liver | All | 0.107 (0.012) | 0.00e+00 |
| GCSE | Lung | All | 0.163 (0.012) | 0.00e+00 |
| GCSE | METSIM.ADIPOSE.RNASEQ | 1 | 0.16 (0.012) | 0.00e+00 |
| GCSE | Minor_Salivary_Gland | 0.5 | 0.111 (0.012) | 0.00e+00 |
| GCSE | Muscle_Skeletal | All | 0.162 (0.012) | 0.00e+00 |
| GCSE | Nerve_Tibial | All | 0.16 (0.012) | 0.00e+00 |
| GCSE | NTR.BLOOD.RNAARR | 1 | 0.114 (0.012) | 0.00e+00 |
| GCSE | Ovary | 0.1 | 0.113 (0.012) | 0.00e+00 |
| GCSE | Pancreas | All | 0.135 (0.012) | 0.00e+00 |
| GCSE | Pituitary | 1 | 0.126 (0.012) | 0.00e+00 |
| GCSE | Prostate | All | 0.119 (0.012) | 0.00e+00 |
| GCSE | Skin_Not_Sun_Exposed_Suprapubic | All | 0.153 (0.012) | 0.00e+00 |
| GCSE | Skin_Sun_Exposed_Lower_leg | All | 0.17 (0.012) | 0.00e+00 |
| GCSE | Small_Intestine_Terminal_Ileum | 0.5 | 0.121 (0.012) | 0.00e+00 |
| GCSE | Spleen | 0.5 | 0.139 (0.012) | 0.00e+00 |
| GCSE | Stomach | All | 0.111 (0.012) | 0.00e+00 |
| GCSE | Testis | 0.5 | 0.163 (0.012) | 0.00e+00 |
| GCSE | Thyroid | All | 0.16 (0.012) | 0.00e+00 |
| GCSE | Uterus | 0.05 | 0.096 (0.012) | 0.00e+00 |
| GCSE | Vagina | 0.05 | 0.094 (0.012) | 0.00e+00 |
| GCSE | Whole_Blood | 0.5 | 0.159 (0.012) | 0.00e+00 |
| GCSE | YFS.BLOOD.RNAARR | All | 0.151 (0.012) | 0.00e+00 |
| ADHD | Adipose_Subcutaneous | 1 | 0.056 (0.011) | 0.00e+00 |
| ADHD | Adipose_Visceral_Omentum | 0.5 | 0.051 (0.011) | 0.00e+00 |
| ADHD | Adrenal_Gland | 1 | 0.052 (0.011) | 0.00e+00 |
| ADHD | Artery_Aorta | 0.5 | 0.058 (0.011) | 0.00e+00 |
| ADHD | Artery_Coronary | 0.1 | 0.029 (0.011) | 1.00e-02 |
| ADHD | Artery_Tibial | 1 | 0.055 (0.011) | 0.00e+00 |
| ADHD | Brain_Amygdala | 1 | 0.018 (0.011) | 1.19e-01 |
| ADHD | Brain_Anterior_cingulate_cortex_BA24 | 1 | 0.039 (0.011) | 1.00e-03 |
| ADHD | Brain_Caudate_basal_ganglia | All | 0.046 (0.011) | 0.00e+00 |
| ADHD | Brain_Cerebellar_Hemisphere | 1 | 0.029 (0.011) | 9.00e-03 |
| ADHD | Brain_Cerebellum | All | 0.033 (0.011) | 3.00e-03 |
| ADHD | Brain_Cortex | 1 | 0.036 (0.011) | 1.00e-03 |
| ADHD | Brain_Frontal_Cortex_BA9 | 1 | 0.036 (0.011) | 1.00e-03 |
| ADHD | Brain_Hippocampus | 0.5 | 0.034 (0.011) | 3.00e-03 |
| ADHD | Brain_Hypothalamus | 1 | 0.026 (0.011) | 2.20e-02 |
| ADHD | Brain_Nucleus_accumbens_basal_ganglia | 1 | 0.017 (0.011) | 1.39e-01 |
| ADHD | Brain_Putamen_basal_ganglia | All | 0.046 (0.011) | 0.00e+00 |
| ADHD | Brain_Spinal_cord_cervical_c-1 | 0.001 | 0.017 (0.011) | 1.32e-01 |
| ADHD | Brain_Substantia_nigra | 0.001 | 0.013 (0.011) | 2.44e-01 |
| ADHD | Breast_Mammary_Tissue | All | 0.046 (0.011) | 0.00e+00 |
| ADHD | Cells_EBV-transformed_lymphocytes | All | 0.045 (0.011) | 0.00e+00 |
| ADHD | Cells_Transformed_fibroblasts | 1 | 0.054 (0.011) | 0.00e+00 |
| ADHD | CMC.BRAIN.RNASEQ | 1 | 0.051 (0.011) | 0.00e+00 |
| ADHD | CMC.BRAIN.RNASEQ_SPLICING | All | 0.054 (0.011) | 0.00e+00 |
| ADHD | Colon_Sigmoid | All | 0.055 (0.011) | 0.00e+00 |
| ADHD | Colon_Transverse | 1 | 0.057 (0.011) | 0.00e+00 |
| ADHD | Esophagus_Gastroesophageal_Junction | 1 | 0.039 (0.011) | 1.00e-03 |
| ADHD | Esophagus_Mucosa | 0.5 | 0.06 (0.011) | 0.00e+00 |
| ADHD | Esophagus_Muscularis | 1 | 0.054 (0.011) | 0.00e+00 |
| ADHD | Heart_Atrial_Appendage | All | 0.051 (0.011) | 0.00e+00 |
| ADHD | Heart_Left_Ventricle | 0.5 | 0.043 (0.011) | 0.00e+00 |
| ADHD | Liver | All | 0.039 (0.011) | 1.00e-03 |
| ADHD | Lung | 0.5 | 0.062 (0.011) | 0.00e+00 |
| ADHD | METSIM.ADIPOSE.RNASEQ | 1 | 0.058 (0.011) | 0.00e+00 |
| ADHD | Minor_Salivary_Gland | 1 | 0.015 (0.011) | 1.91e-01 |
| ADHD | Muscle_Skeletal | All | 0.063 (0.011) | 0.00e+00 |
| ADHD | Nerve_Tibial | 1 | 0.036 (0.011) | 1.00e-03 |
| ADHD | NTR.BLOOD.RNAARR | 1 | 0.034 (0.011) | 2.00e-03 |
| ADHD | Ovary | 1 | 0.037 (0.011) | 1.00e-03 |
| ADHD | Pancreas | 1 | 0.037 (0.011) | 1.00e-03 |
| ADHD | Pituitary | 1 | 0.042 (0.011) | 0.00e+00 |
| ADHD | Prostate | 1 | 0.024 (0.011) | 3.20e-02 |
| ADHD | Skin_Not_Sun_Exposed_Suprapubic | 1 | 0.055 (0.011) | 0.00e+00 |
| ADHD | Skin_Sun_Exposed_Lower_leg | 0.5 | 0.056 (0.011) | 0.00e+00 |
| ADHD | Small_Intestine_Terminal_Ileum | All | 0.043 (0.011) | 0.00e+00 |
| ADHD | Spleen | 1 | 0.027 (0.011) | 1.70e-02 |
| ADHD | Stomach | All | 0.056 (0.011) | 0.00e+00 |
| ADHD | Testis | 0.5 | 0.043 (0.011) | 0.00e+00 |
| ADHD | Thyroid | 1 | 0.044 (0.011) | 0.00e+00 |
| ADHD | Uterus | All | 0.044 (0.011) | 0.00e+00 |
| ADHD | Vagina | 1 | 0.039 (0.011) | 0.00e+00 |
| ADHD | Whole_Blood | 1 | 0.053 (0.011) | 0.00e+00 |
| ADHD | YFS.BLOOD.RNAARR | 0.5 | 0.044 (0.011) | 0.00e+00 |
Show cis-regulated expression-based heritability
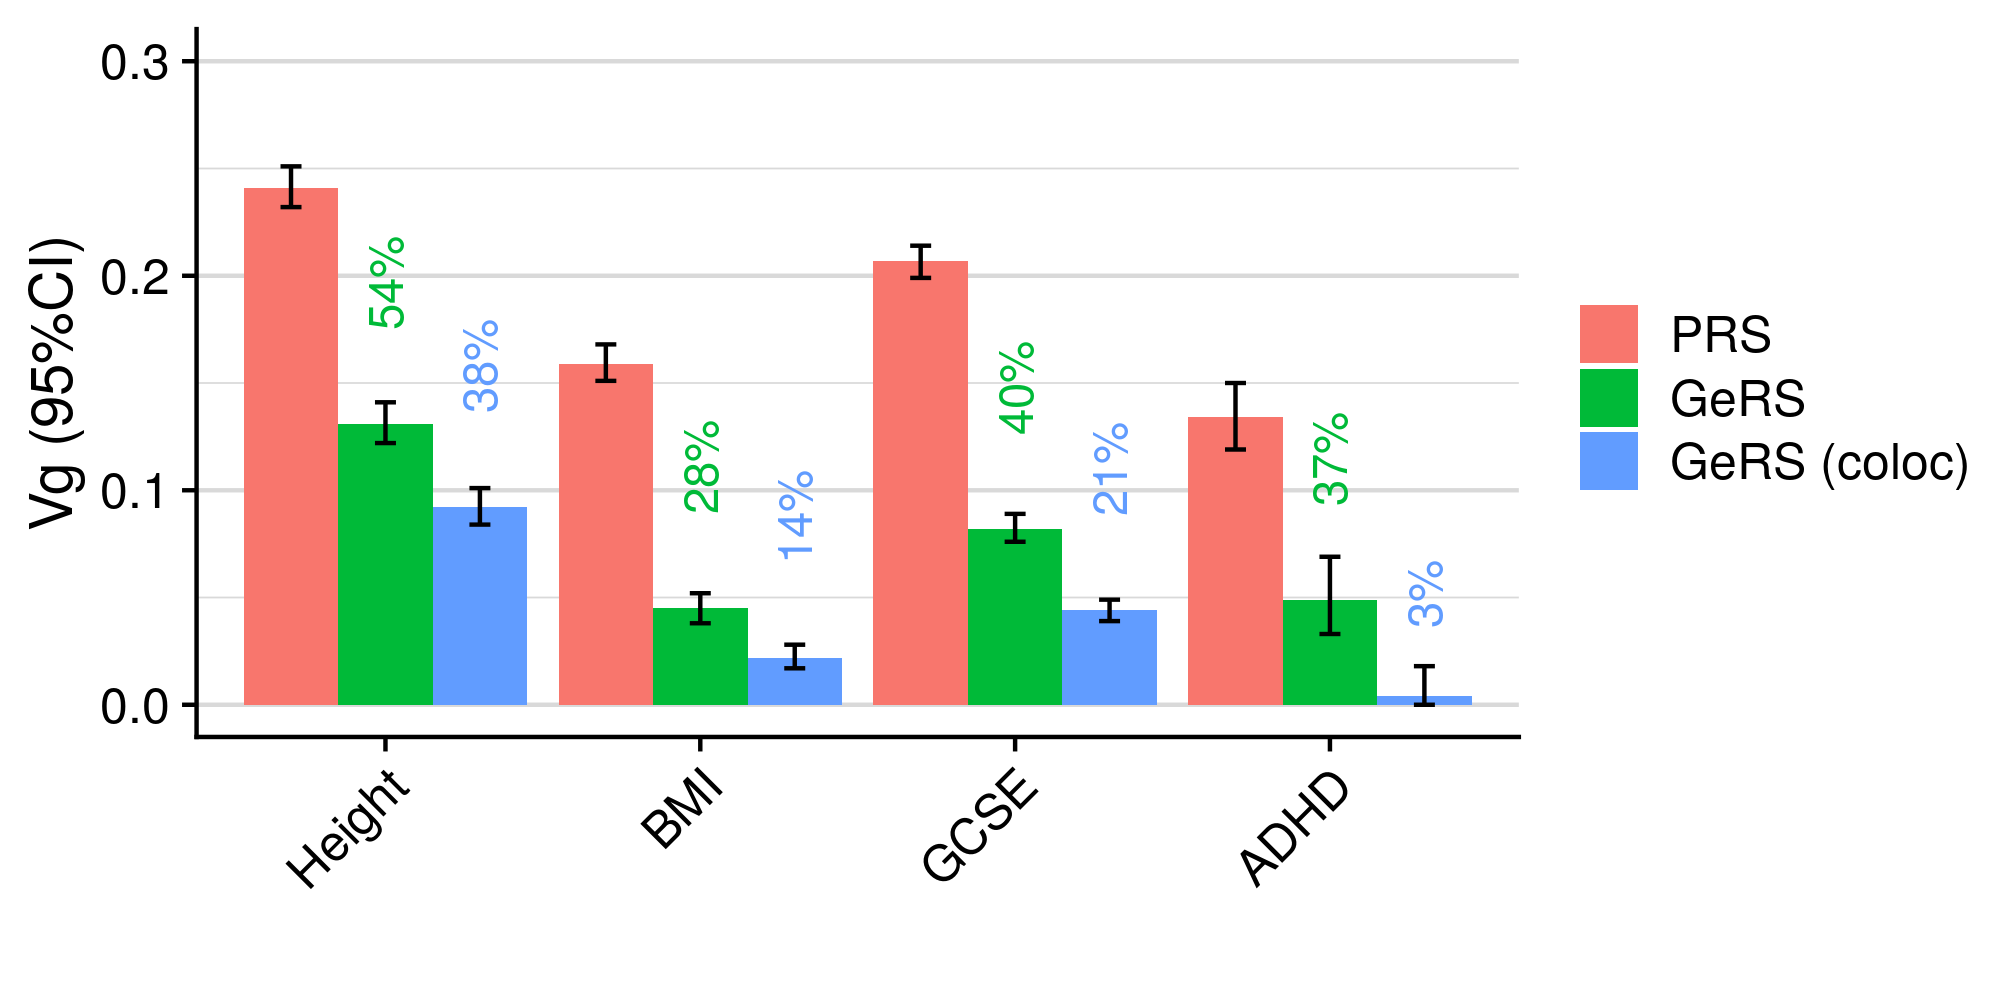
Proportion of heritability explained
Show summary of GeRS tests
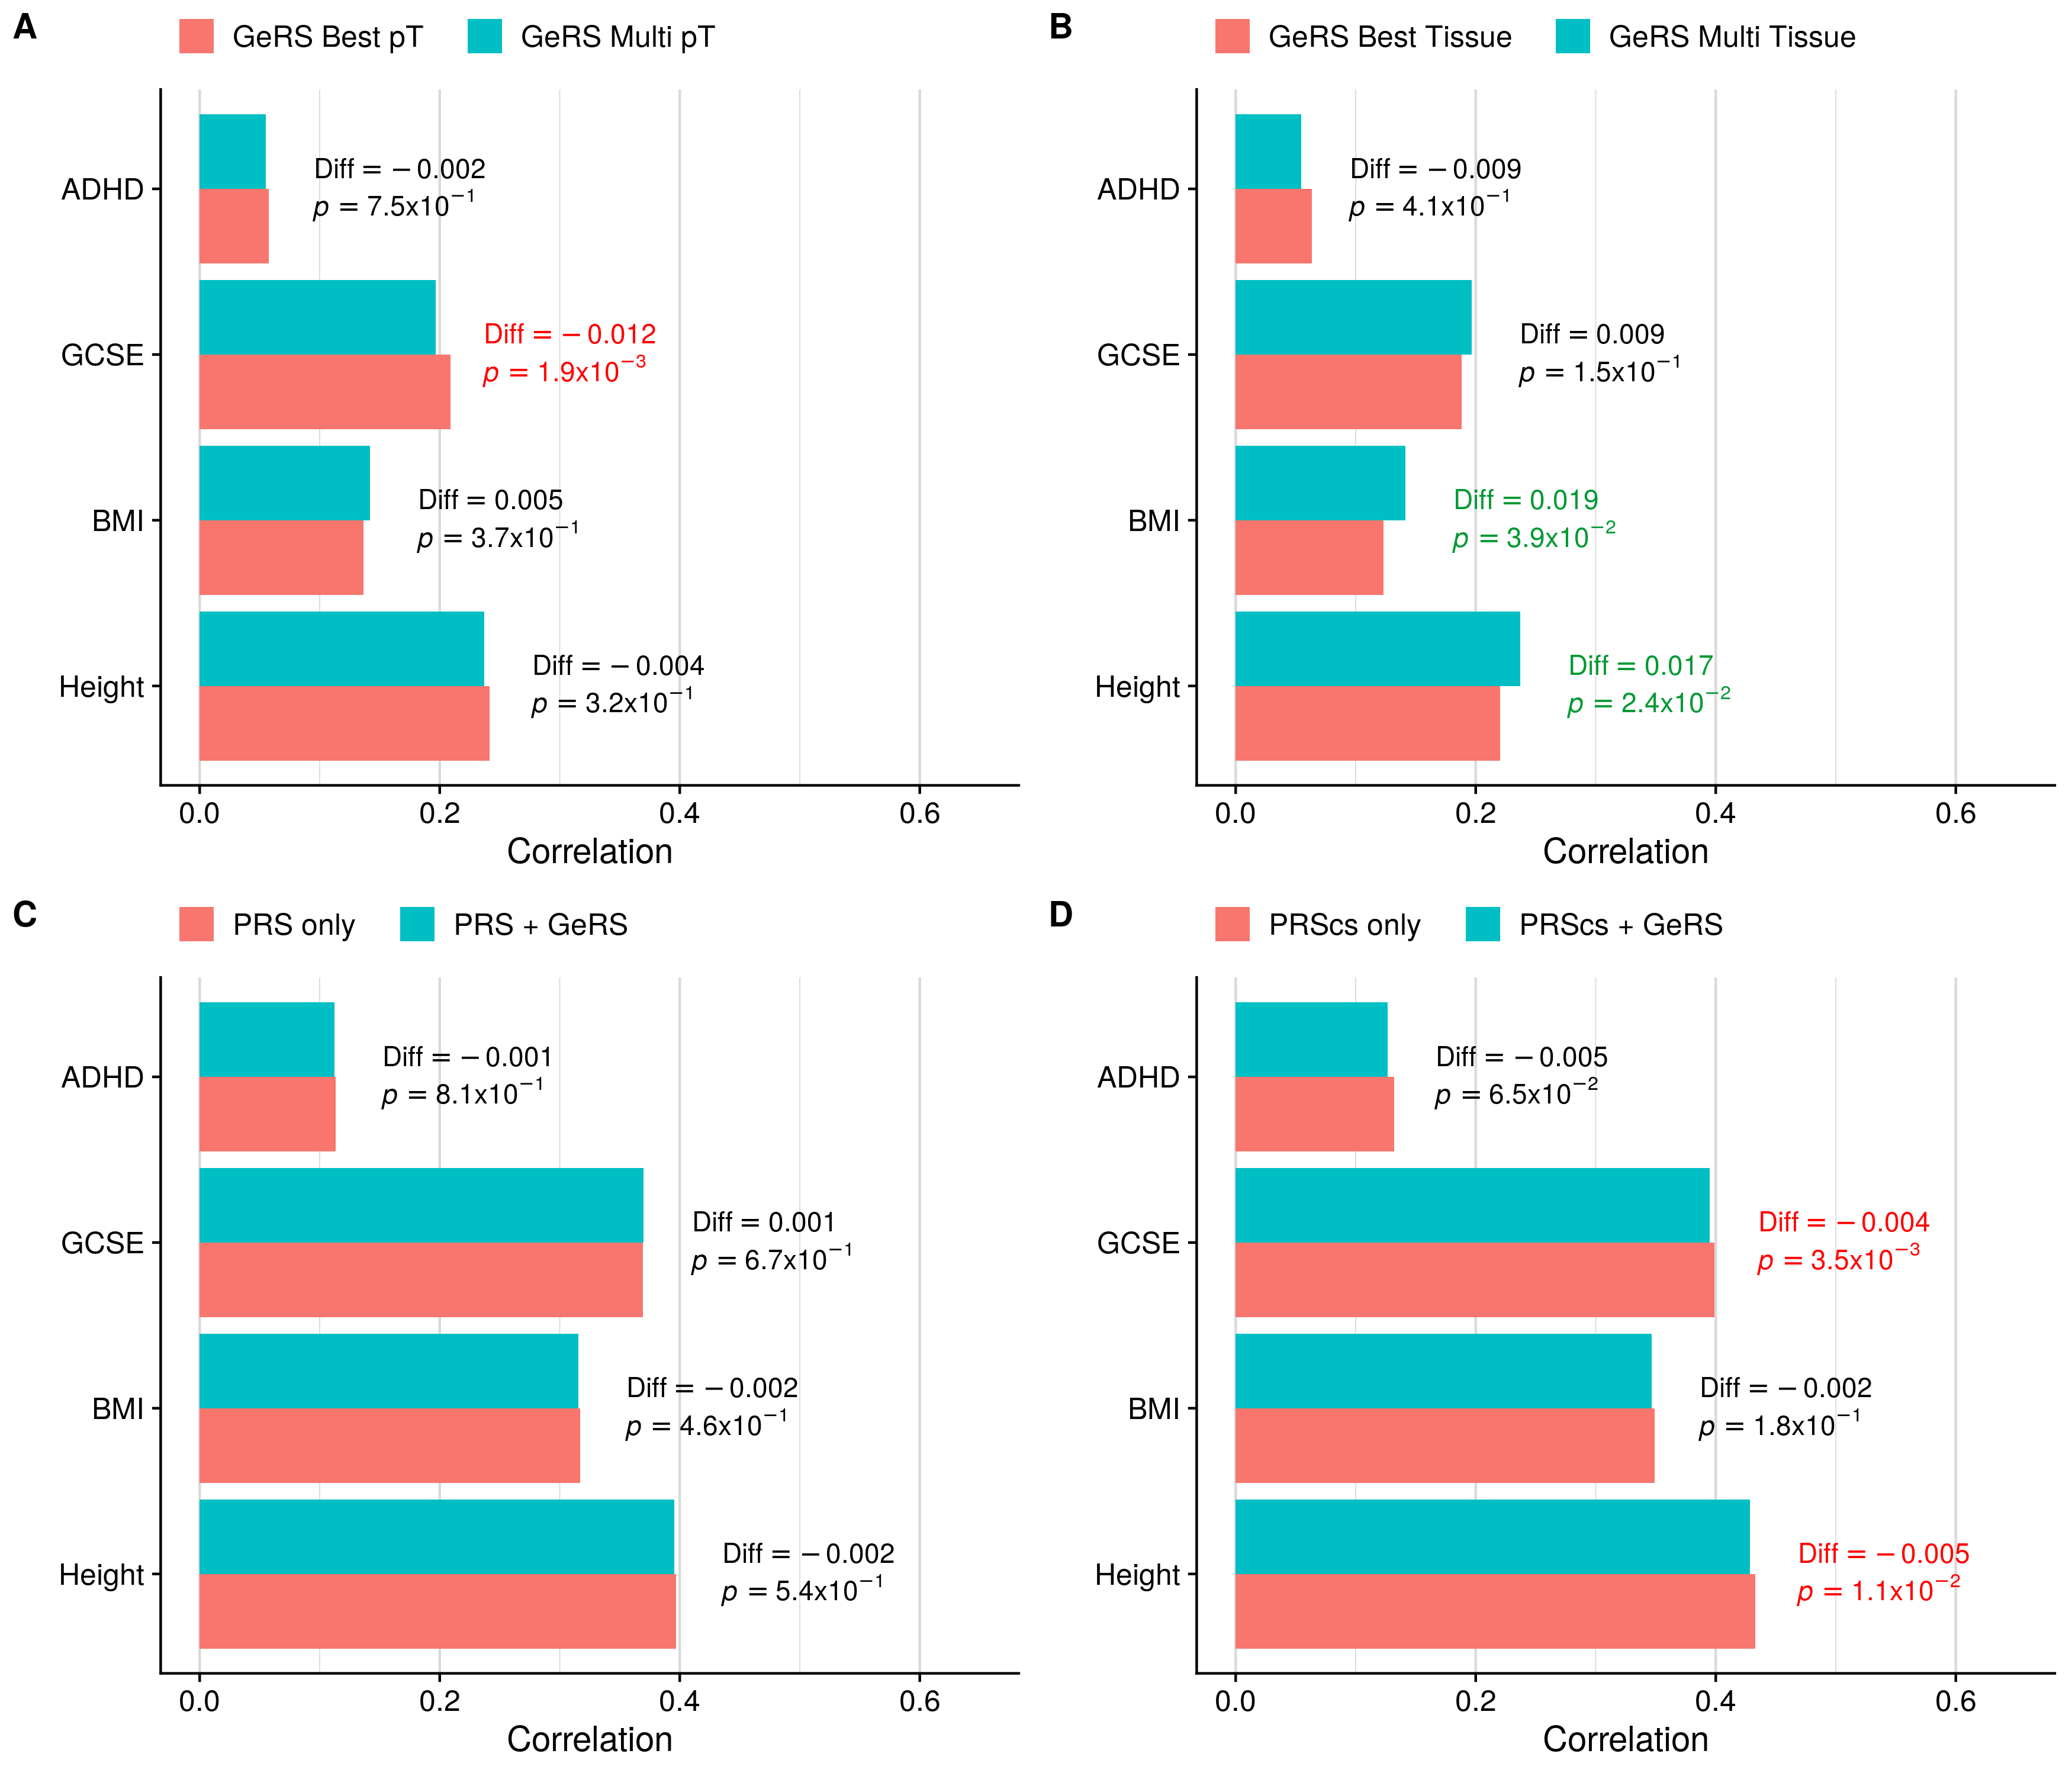
Predictive utility
| FALSE | Phenotype | Test | Model 1 | Model 2 | Model 1 R | Model 2 R | R diff | R perc diff | R diff pval |
|---|---|---|---|---|---|---|---|---|---|
| 1 | Height21 | GeRS_multi_pT | All | 0.5 | 0.237 | 0.241 | -0.004 | -1.8% | 3.23e-01 |
| 6 | BMI21 | GeRS_multi_pT | All | 0.1 | 0.142 | 0.136 | 0.005 | 3.8% | 3.75e-01 |
| 11 | GCSE | GeRS_multi_pT | All | 0.5 | 0.197 | 0.209 | -0.012 | -6.1% | 1.91e-03 |
| 16 | ADHD | GeRS_multi_pT | All | 0.5 | 0.055 | 0.057 | -0.002 | -4.5% | 7.46e-01 |
| 2 | Height21 | GeRS_multi_tissue | All | Nerve.Tibial | 0.237 | 0.220 | 0.017 | 7.1% | 2.45e-02 |
| 7 | BMI21 | GeRS_multi_tissue | All | Artery.Tibial | 0.142 | 0.123 | 0.019 | 13.1% | 3.91e-02 |
| 12 | GCSE | GeRS_multi_tissue | All | CMC.BRAIN.RNASEQ | 0.197 | 0.188 | 0.009 | 4.4% | 1.46e-01 |
| 17 | ADHD | GeRS_multi_tissue | All | Muscle.Skeletal | 0.055 | 0.063 | -0.009 | -15.6% | 4.10e-01 |
| 3 | Height21 | PRS_and_GeRS | All | PRS | 0.396 | 0.397 | -0.002 | -0.4% | 5.37e-01 |
| 8 | BMI21 | PRS_and_GeRS | All | PRS | 0.315 | 0.317 | -0.002 | -0.5% | 4.65e-01 |
| 13 | GCSE | PRS_and_GeRS | All | PRS | 0.370 | 0.369 | 0.001 | 0.2% | 6.75e-01 |
| 18 | ADHD | PRS_and_GeRS | All | PRS | 0.112 | 0.113 | -0.001 | -0.9% | 8.09e-01 |
| 5 | Height21 | PRScs_and_GeRS | All | PRS | 0.428 | 0.433 | -0.005 | -1.1% | 1.13e-02 |
| 10 | BMI21 | PRScs_and_GeRS | All | PRS | 0.347 | 0.349 | -0.002 | -0.7% | 1.80e-01 |
| 15 | GCSE | PRScs_and_GeRS | All | PRS | 0.395 | 0.399 | -0.004 | -0.9% | 3.46e-03 |
| 20 | ADHD | PRScs_and_GeRS | All | PRS | 0.127 | 0.132 | -0.005 | -4.1% | 6.51e-02 |
| 4 | Height21 | Strat_PRS | All | strat.PRS | 0.380 | 0.381 | -0.001 | -0.4% | 6.06e-01 |
| 9 | BMI21 | Strat_PRS | All | strat.PRS | 0.272 | 0.271 | 0.001 | 0.5% | 2.89e-01 |
| 14 | GCSE | Strat_PRS | All | strat.PRS | 0.331 | 0.333 | -0.003 | -0.8% | 1.70e-01 |
| 19 | ADHD | Strat_PRS | All | strat.PRS | 0.094 | 0.104 | -0.010 | -10.7% | 4.32e-02 |
Show summary of GeRS PP4 tests
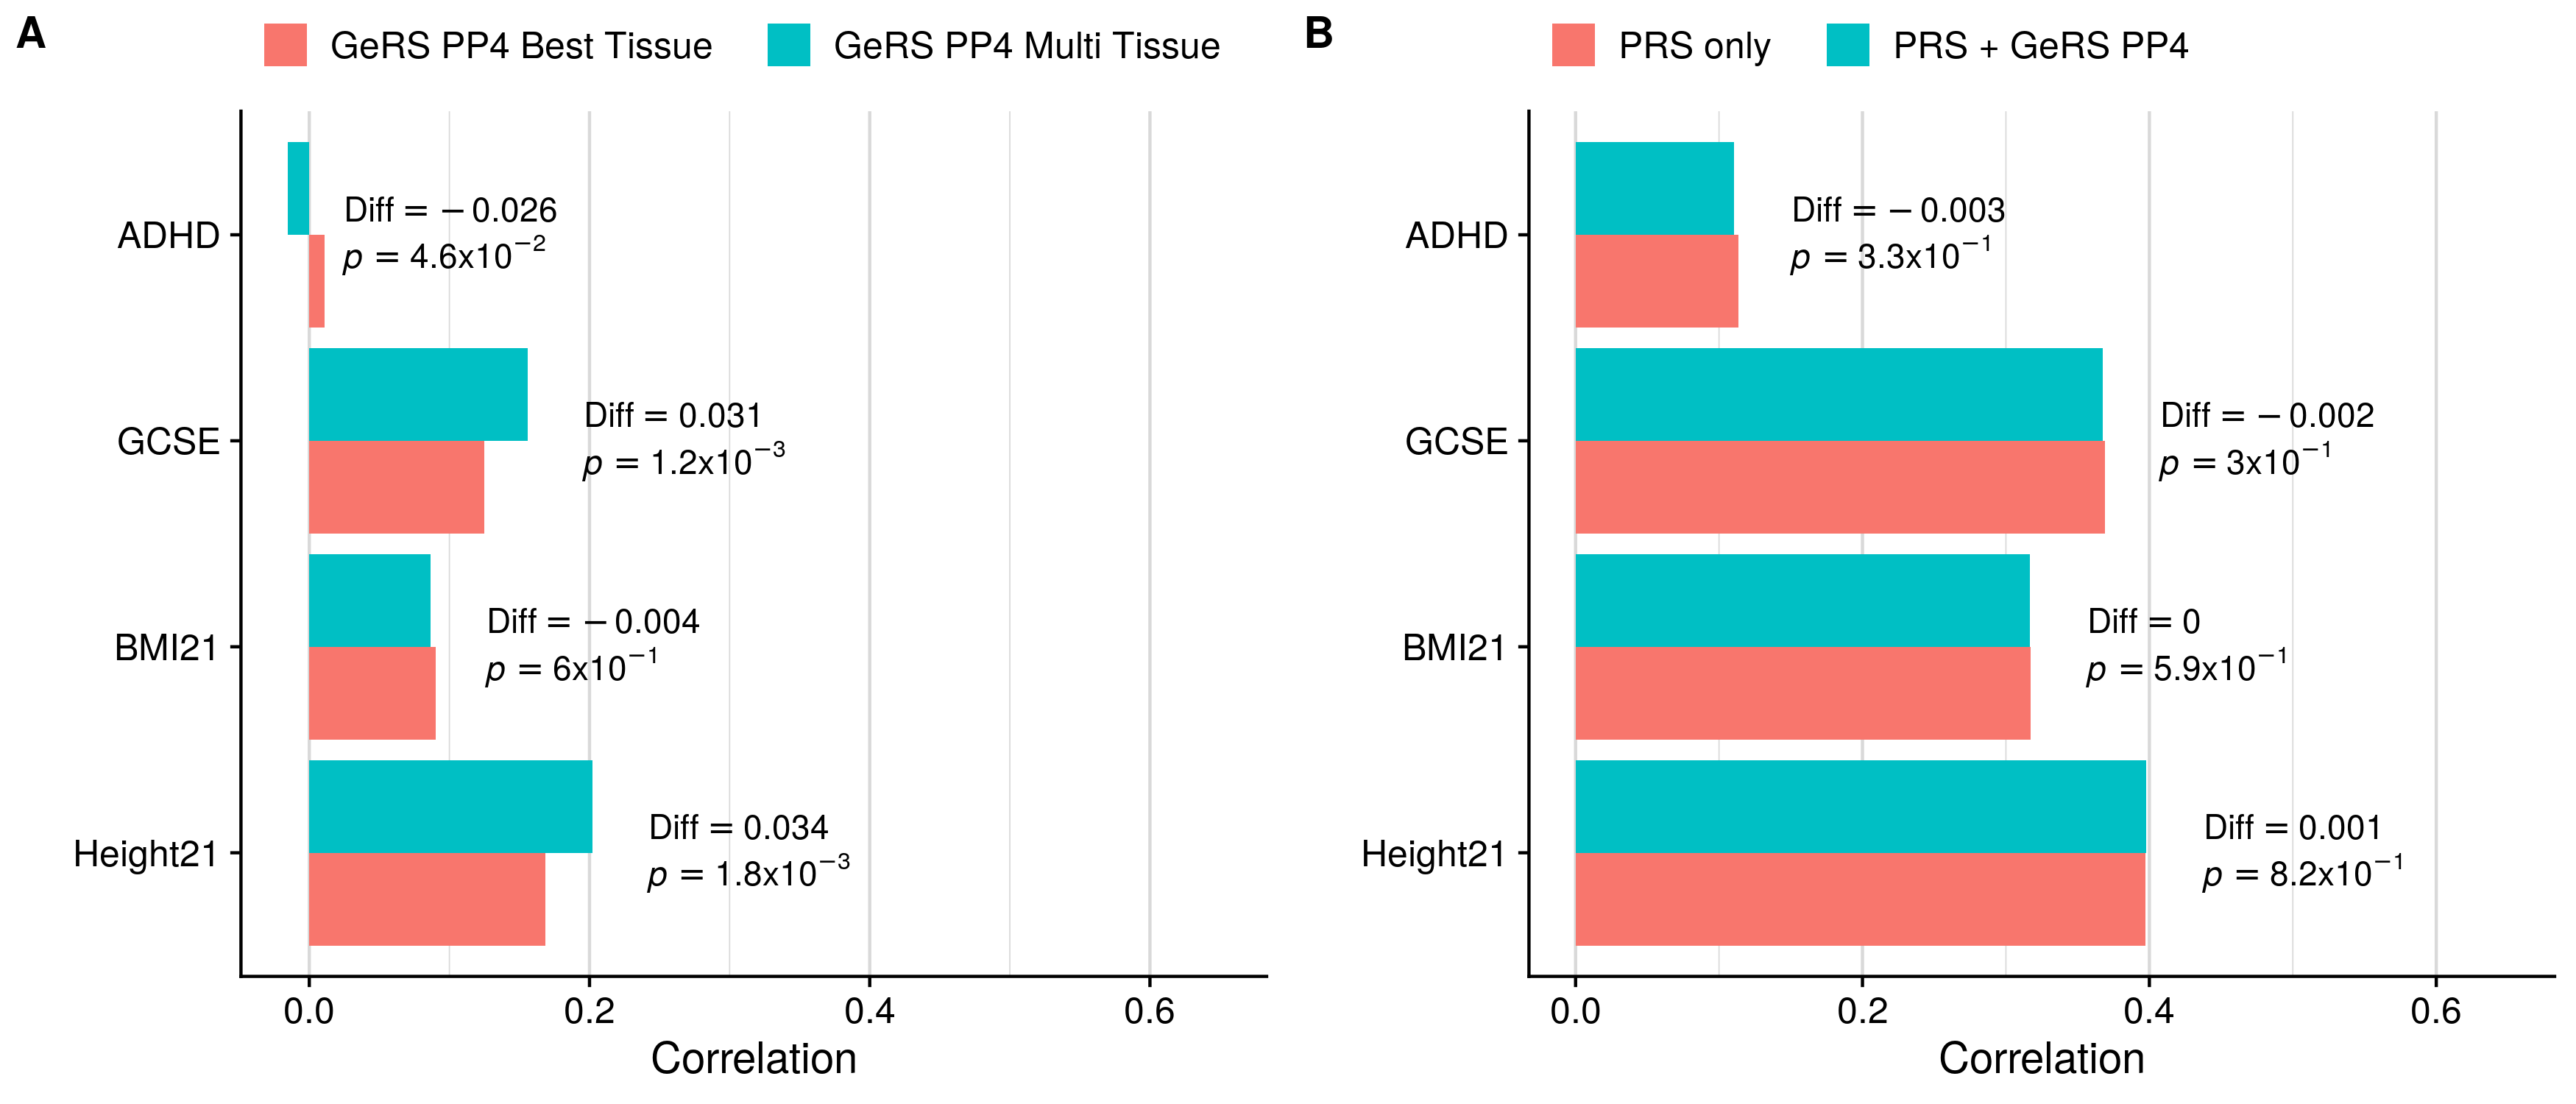
Predictive utility
| FALSE | Phenotype | Test | Model 1 | Model 2 | Model 1 R | Model 2 R | R diff | R diff pval |
|---|---|---|---|---|---|---|---|---|
| 1 | Height21 | GeRS_multi_tissue | All | Thyroid | 0.202 | 0.168 | 0.034 | 1.78e-03 |
| 3 | BMI21 | GeRS_multi_tissue | All | CMC.BRAIN.RNASEQ | 0.086 | 0.090 | -0.004 | 6.05e-01 |
| 5 | GCSE | GeRS_multi_tissue | All | Esophagus.Muscularis | 0.156 | 0.125 | 0.031 | 1.18e-03 |
| 7 | ADHD | GeRS_multi_tissue | All | Heart.Left.Ventricle | -0.015 | 0.011 | -0.026 | 4.56e-02 |
| 2 | Height21 | PRS_and_GeRS | All | PRS | 0.398 | 0.397 | 0.001 | 8.19e-01 |
| 4 | BMI21 | PRS_and_GeRS | All | PRS | 0.317 | 0.317 | 0.000 | 5.86e-01 |
| 6 | GCSE | PRS_and_GeRS | All | PRS | 0.368 | 0.369 | -0.002 | 3.02e-01 |
| 8 | ADHD | PRS_and_GeRS | All | PRS | 0.111 | 0.113 | -0.003 | 3.26e-01 |
Show summary of GeRS TissueSpecific tests
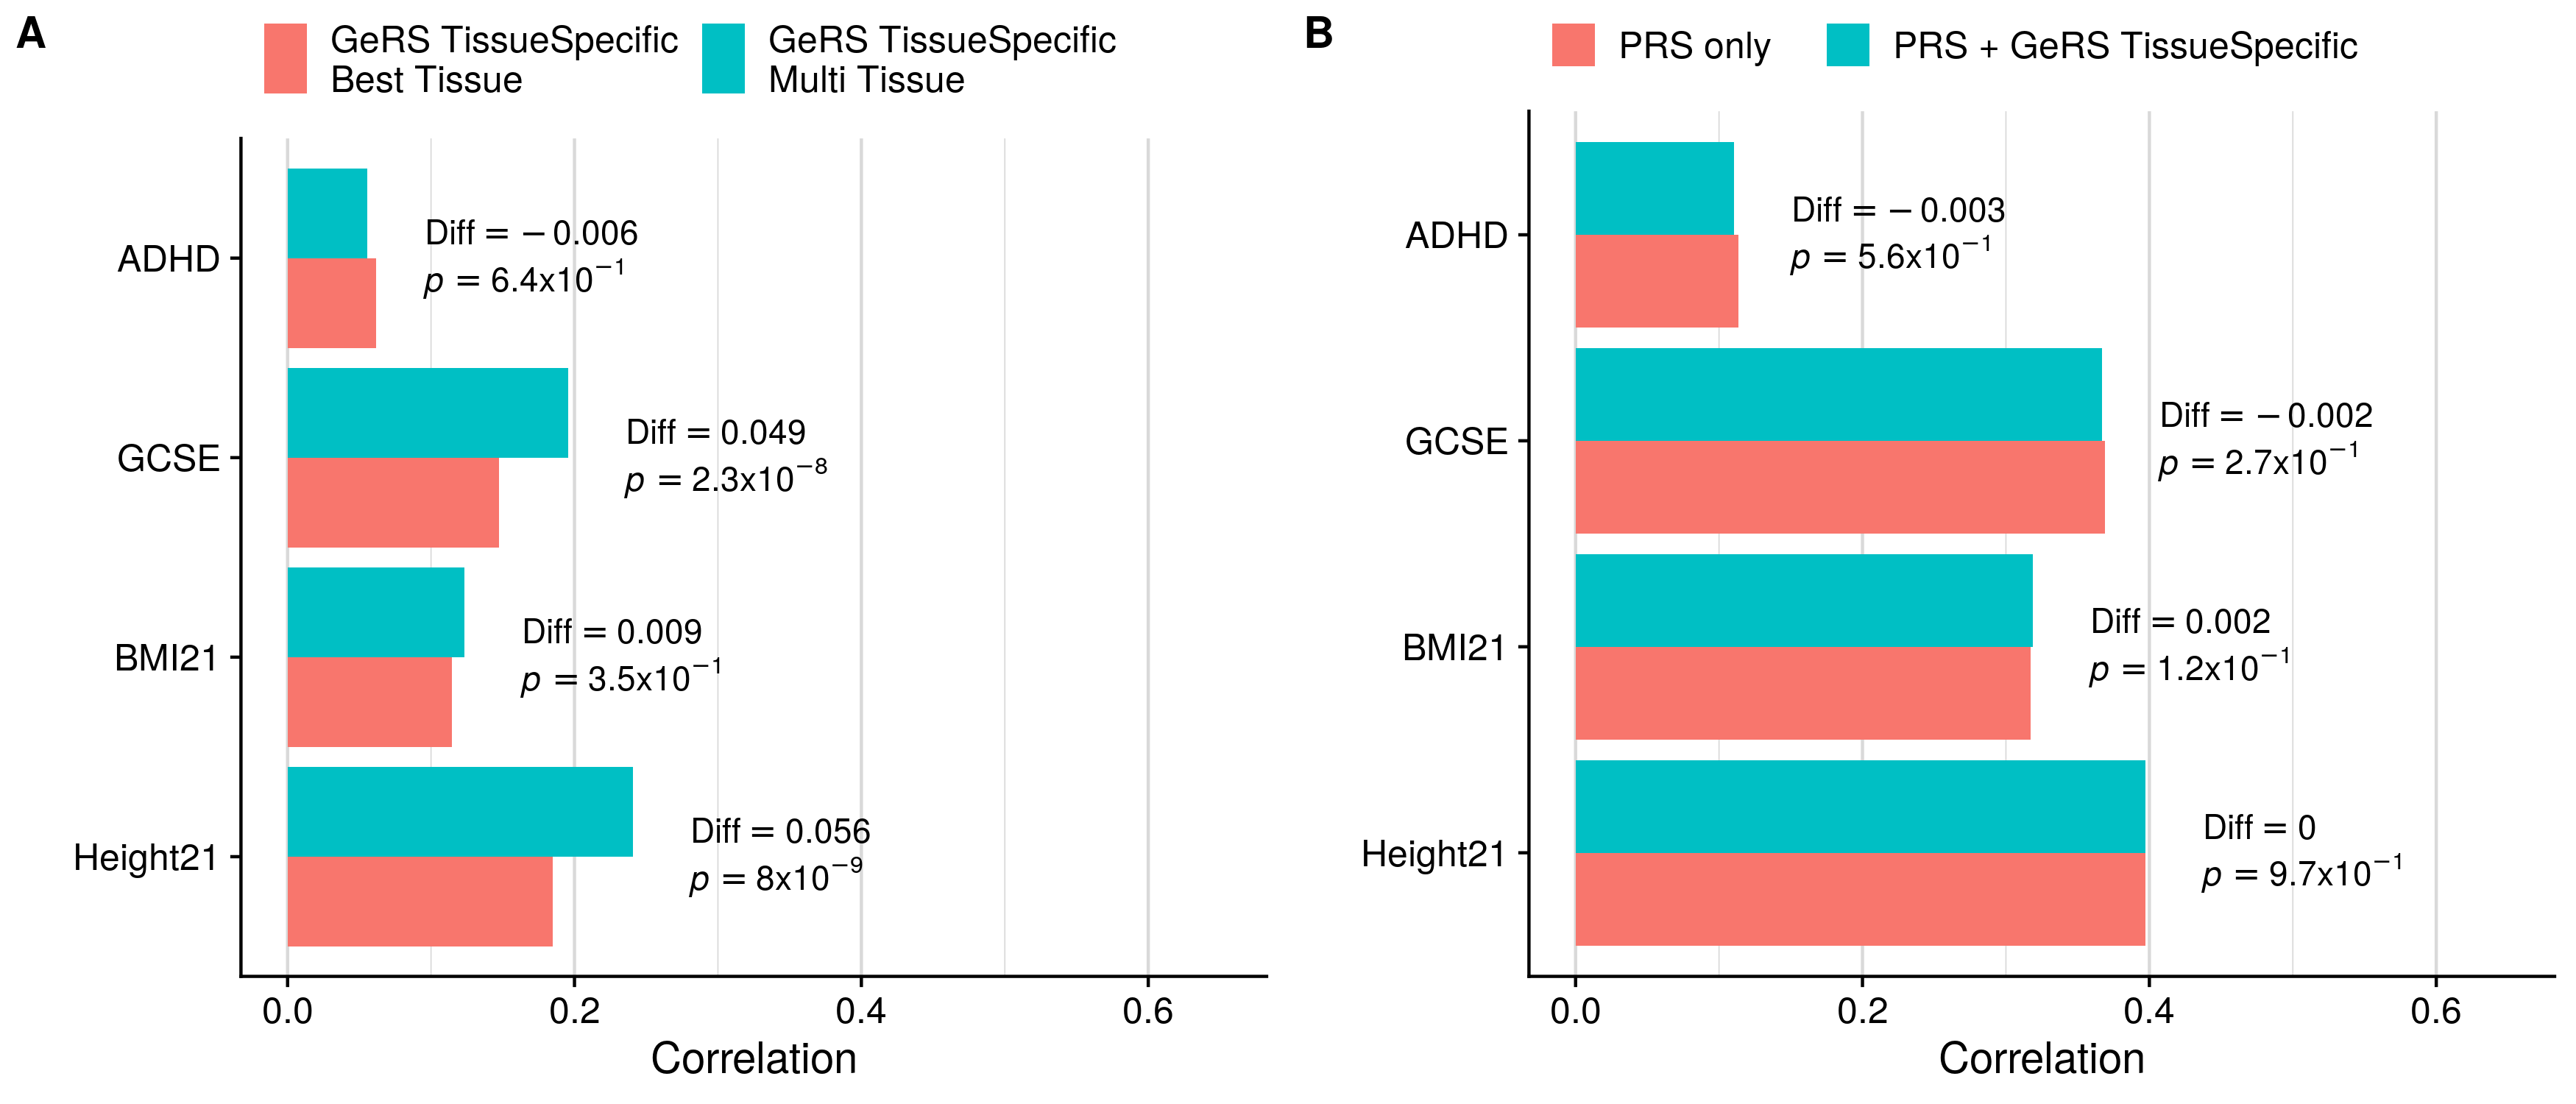
Predictive utility
| FALSE | Phenotype | Test | Model 1 | Model 2 | Model 1 R | Model 2 R | R diff | R diff pval |
|---|---|---|---|---|---|---|---|---|
| 1 | Height21 | GeRS_multi_tissue | All | Adipose.Subcutaneous | 0.241 | 0.185 | 0.056 | 7.99e-09 |
| 3 | BMI21 | GeRS_multi_tissue | All | CMC.BRAIN.RNASEQ | 0.123 | 0.114 | 0.009 | 3.50e-01 |
| 5 | GCSE | GeRS_multi_tissue | All | CMC.BRAIN.RNASEQ | 0.196 | 0.147 | 0.049 | 2.32e-08 |
| 7 | ADHD | GeRS_multi_tissue | All | Brain.Cerebellar.Hemisphere | 0.055 | 0.062 | -0.006 | 6.36e-01 |
| 2 | Height21 | PRS_and_GeRS | All | PRS | 0.397 | 0.397 | 0.000 | 9.74e-01 |
| 4 | BMI21 | PRS_and_GeRS | All | PRS | 0.319 | 0.317 | 0.002 | 1.24e-01 |
| 6 | GCSE | PRS_and_GeRS | All | PRS | 0.367 | 0.369 | -0.002 | 2.67e-01 |
| 8 | ADHD | PRS_and_GeRS | All | PRS | 0.111 | 0.113 | -0.003 | 5.65e-01 |
Show GeRS, PRS, stratified-PRS comparison
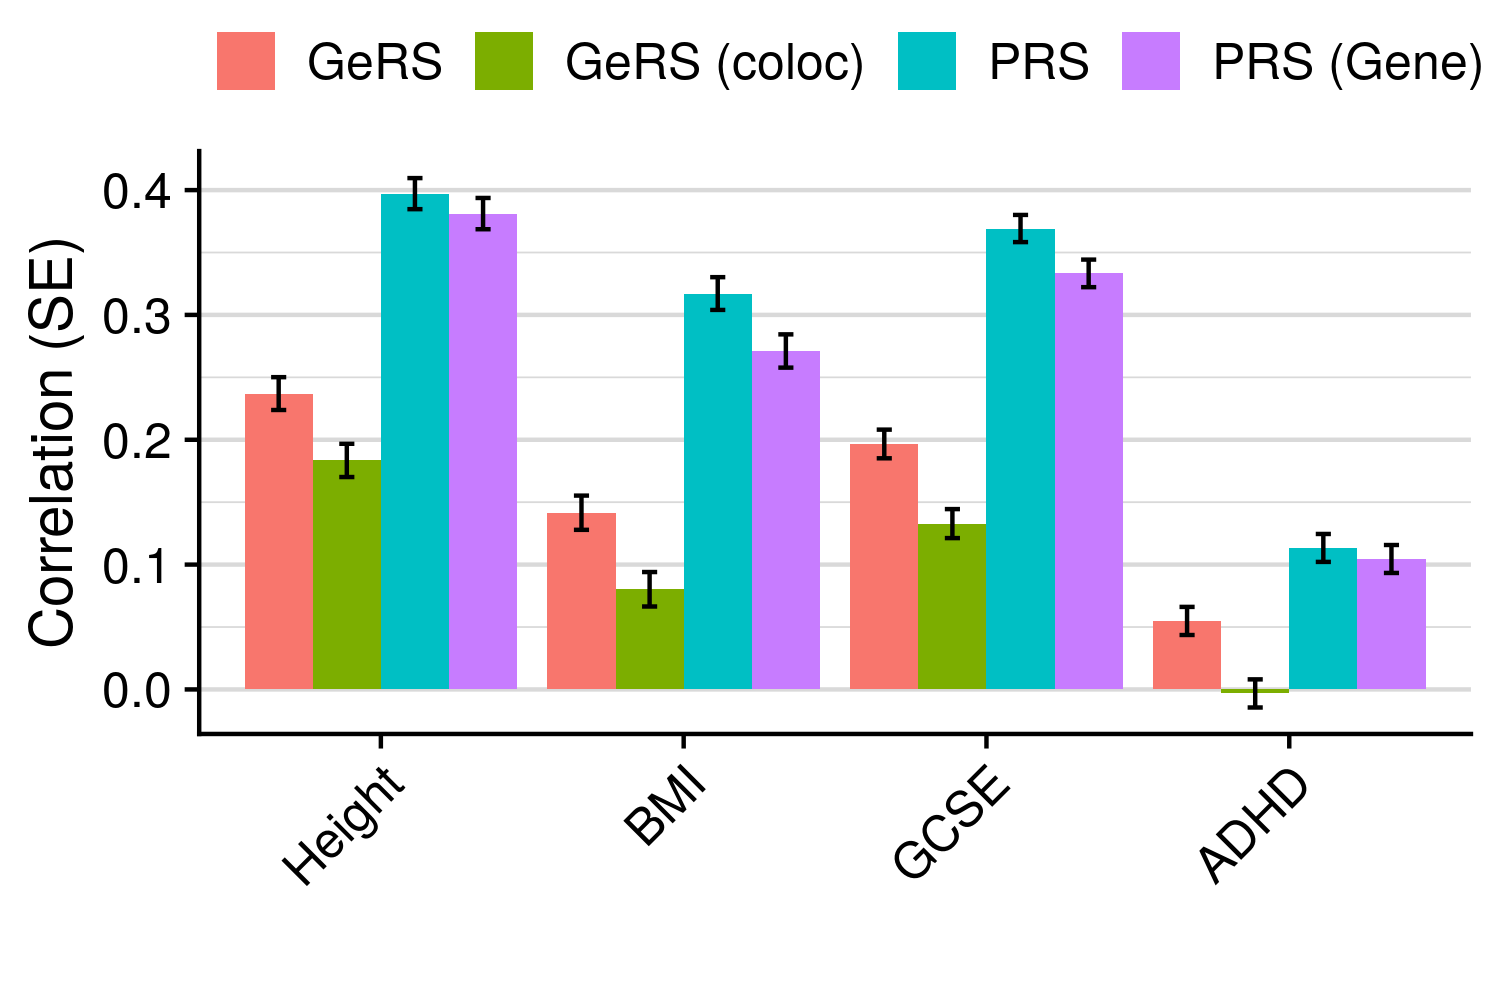
Predictive utility
| Phenotype | Prop_GE | Prop_GE_coloc |
|---|---|---|
| Height | 0.597 | 0.462 |
| BMI | 0.446 | 0.253 |
| GCSE | 0.533 | 0.360 |
| ADHD | 0.484 | -0.028 |
Show GeRS coloc and tissue specific comparison
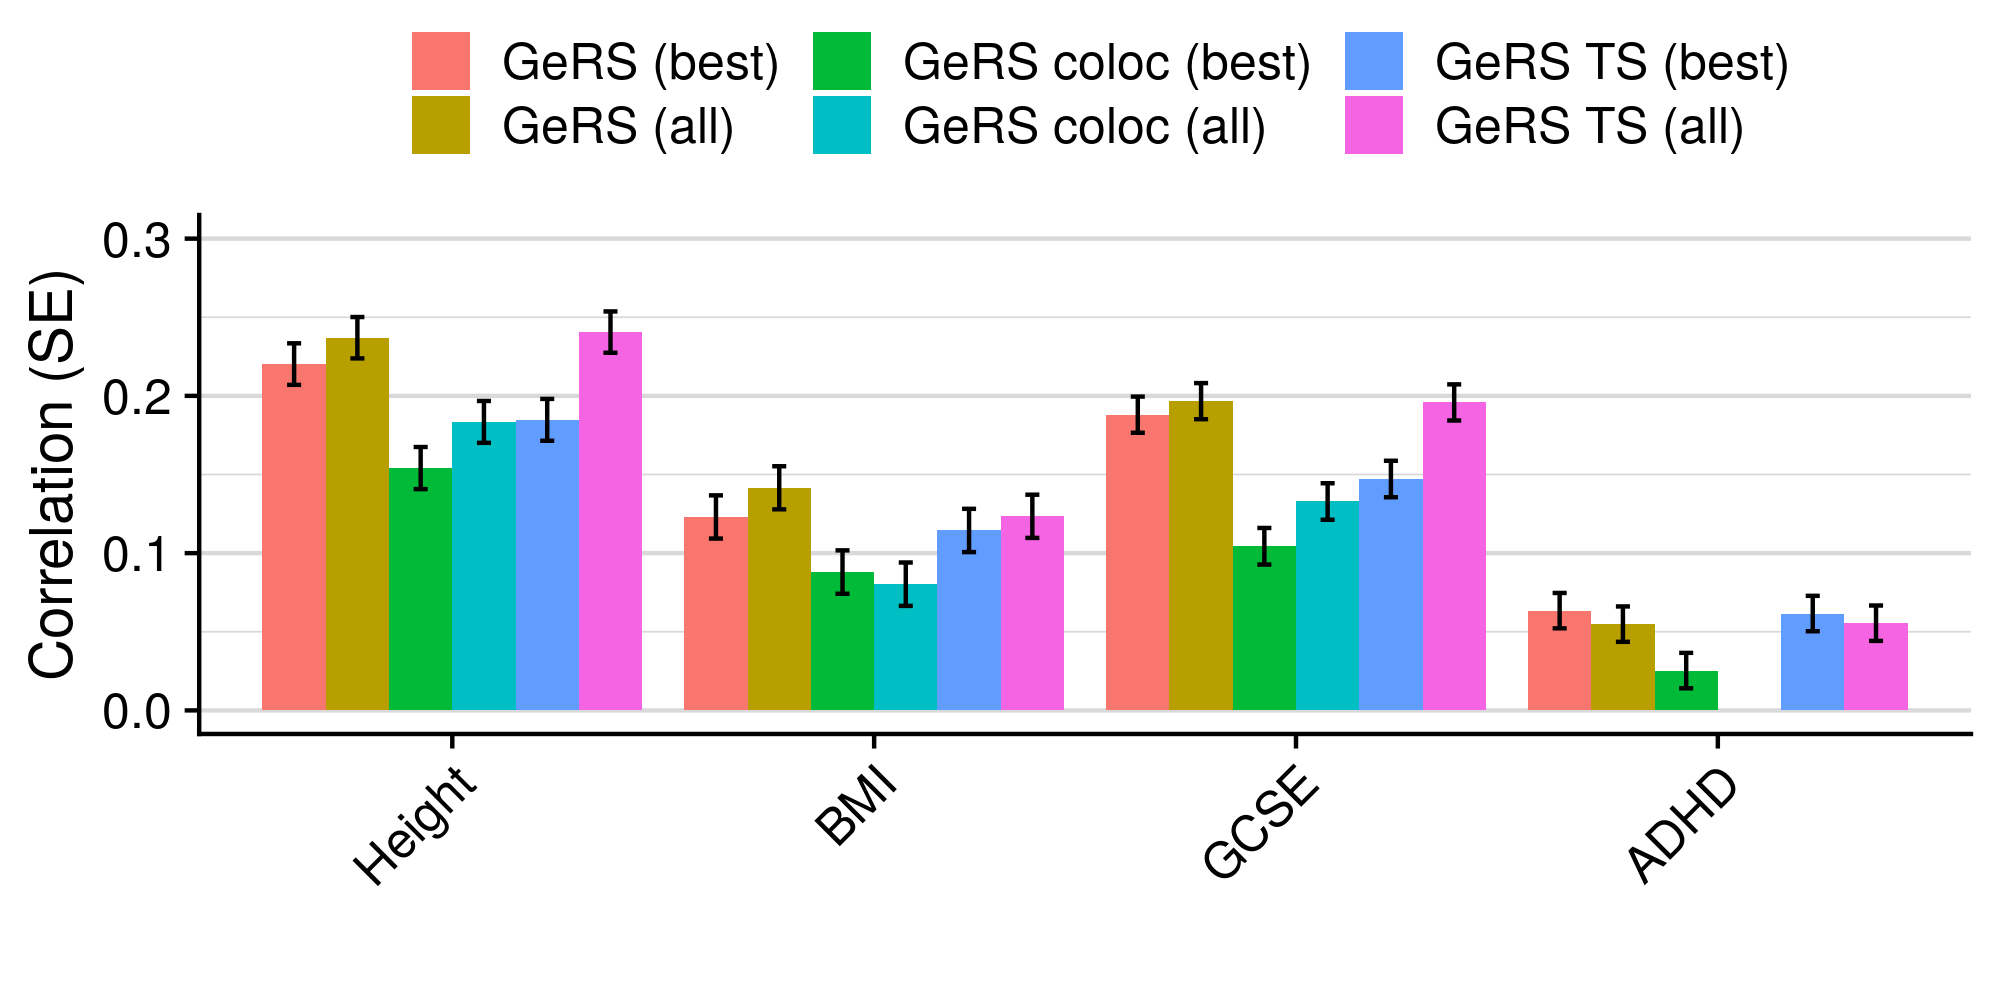
Predictive utility
| Phenotype | Method | R | SE |
|---|---|---|---|
| Height | GeRS (best) | 0.220 | 0.013 |
| Height | GeRS (all) | 0.237 | 0.013 |
| Height | GeRS coloc (best) | 0.154 | 0.013 |
| Height | GeRS coloc (all) | 0.183 | 0.013 |
| Height | GeRS TS (best) | 0.185 | 0.013 |
| Height | GeRS TS (all) | 0.241 | 0.013 |
| BMI | GeRS (best) | 0.123 | 0.014 |
| BMI | GeRS (all) | 0.142 | 0.014 |
| BMI | GeRS coloc (best) | 0.088 | 0.014 |
| BMI | GeRS coloc (all) | 0.080 | 0.014 |
| BMI | GeRS TS (best) | 0.114 | 0.014 |
| BMI | GeRS TS (all) | 0.123 | 0.014 |
| GCSE | GeRS (best) | 0.188 | 0.012 |
| GCSE | GeRS (all) | 0.197 | 0.011 |
| GCSE | GeRS coloc (best) | 0.104 | 0.012 |
| GCSE | GeRS coloc (all) | 0.133 | 0.012 |
| GCSE | GeRS TS (best) | 0.147 | 0.012 |
| GCSE | GeRS TS (all) | 0.196 | 0.011 |
| ADHD | GeRS (best) | 0.063 | 0.011 |
| ADHD | GeRS (all) | 0.055 | 0.011 |
| ADHD | GeRS coloc (best) | 0.025 | 0.011 |
| ADHD | GeRS coloc (all) | -0.003 | 0.011 |
| ADHD | GeRS TS (best) | 0.062 | 0.011 |
| ADHD | GeRS TS (all) | 0.055 | 0.011 |
Show association with GeRS for each SNP-weight set
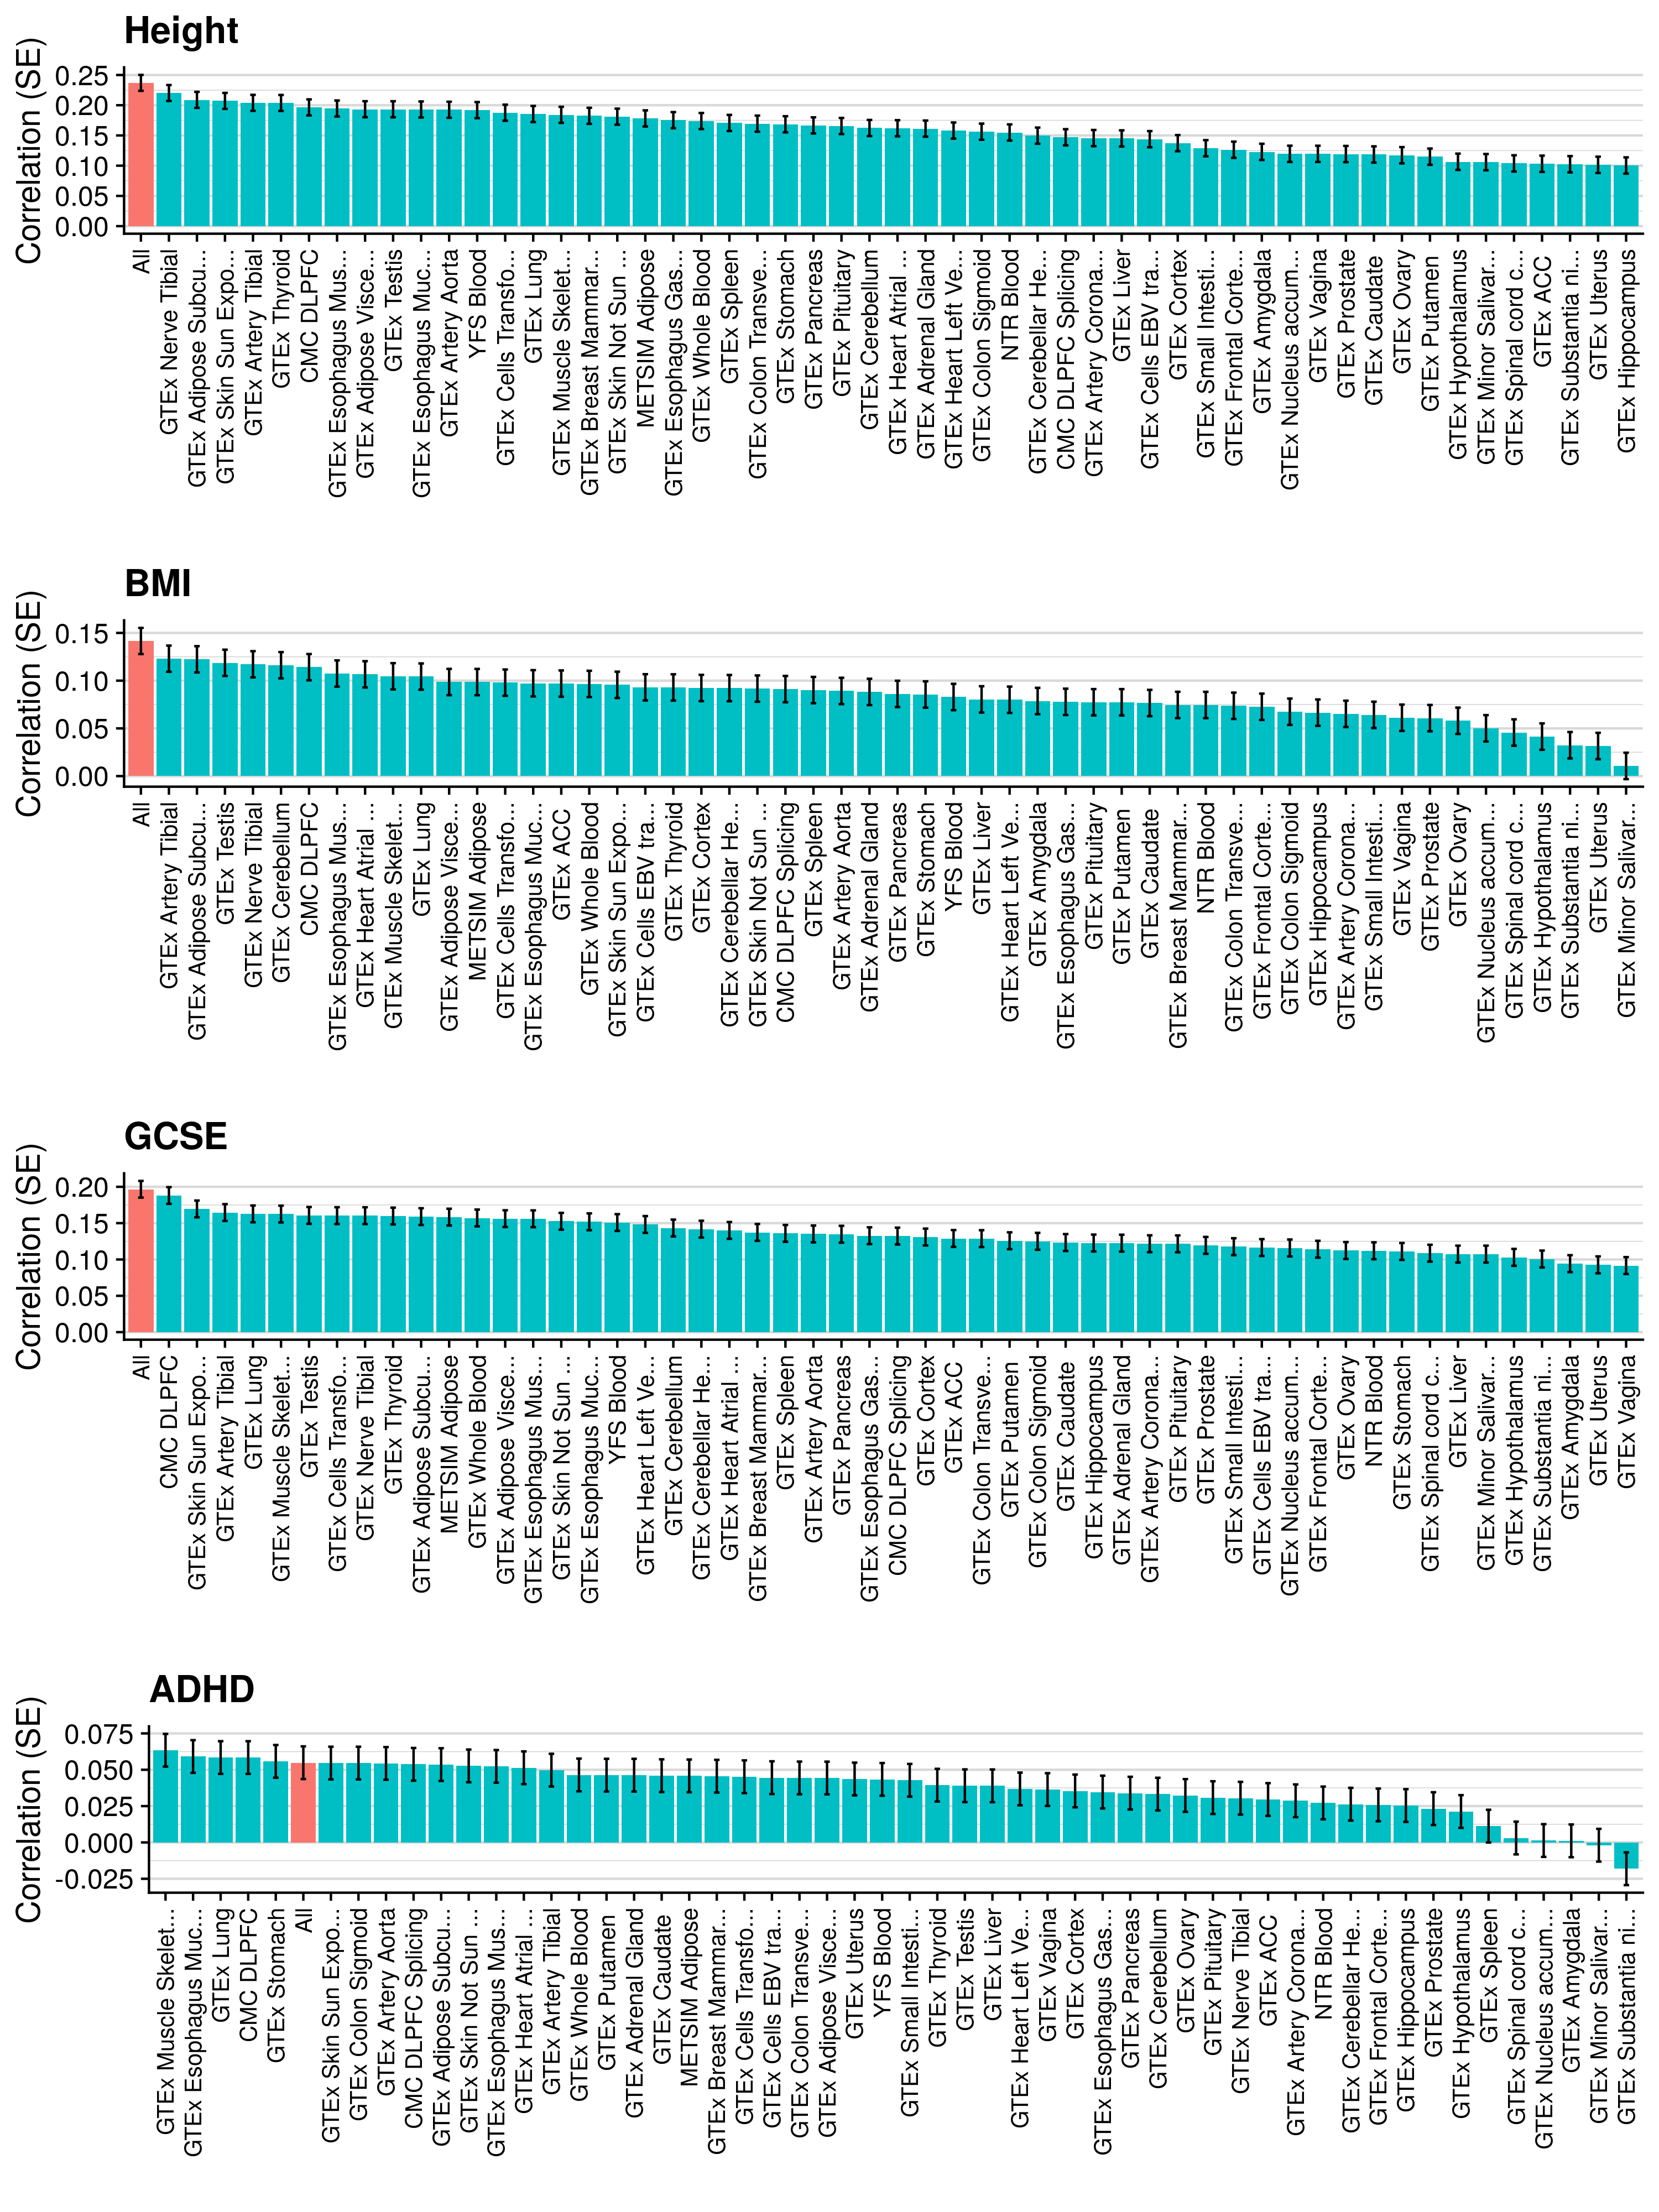
Predictive utility
Show association with GeRS PP4 for each SNP-weight set
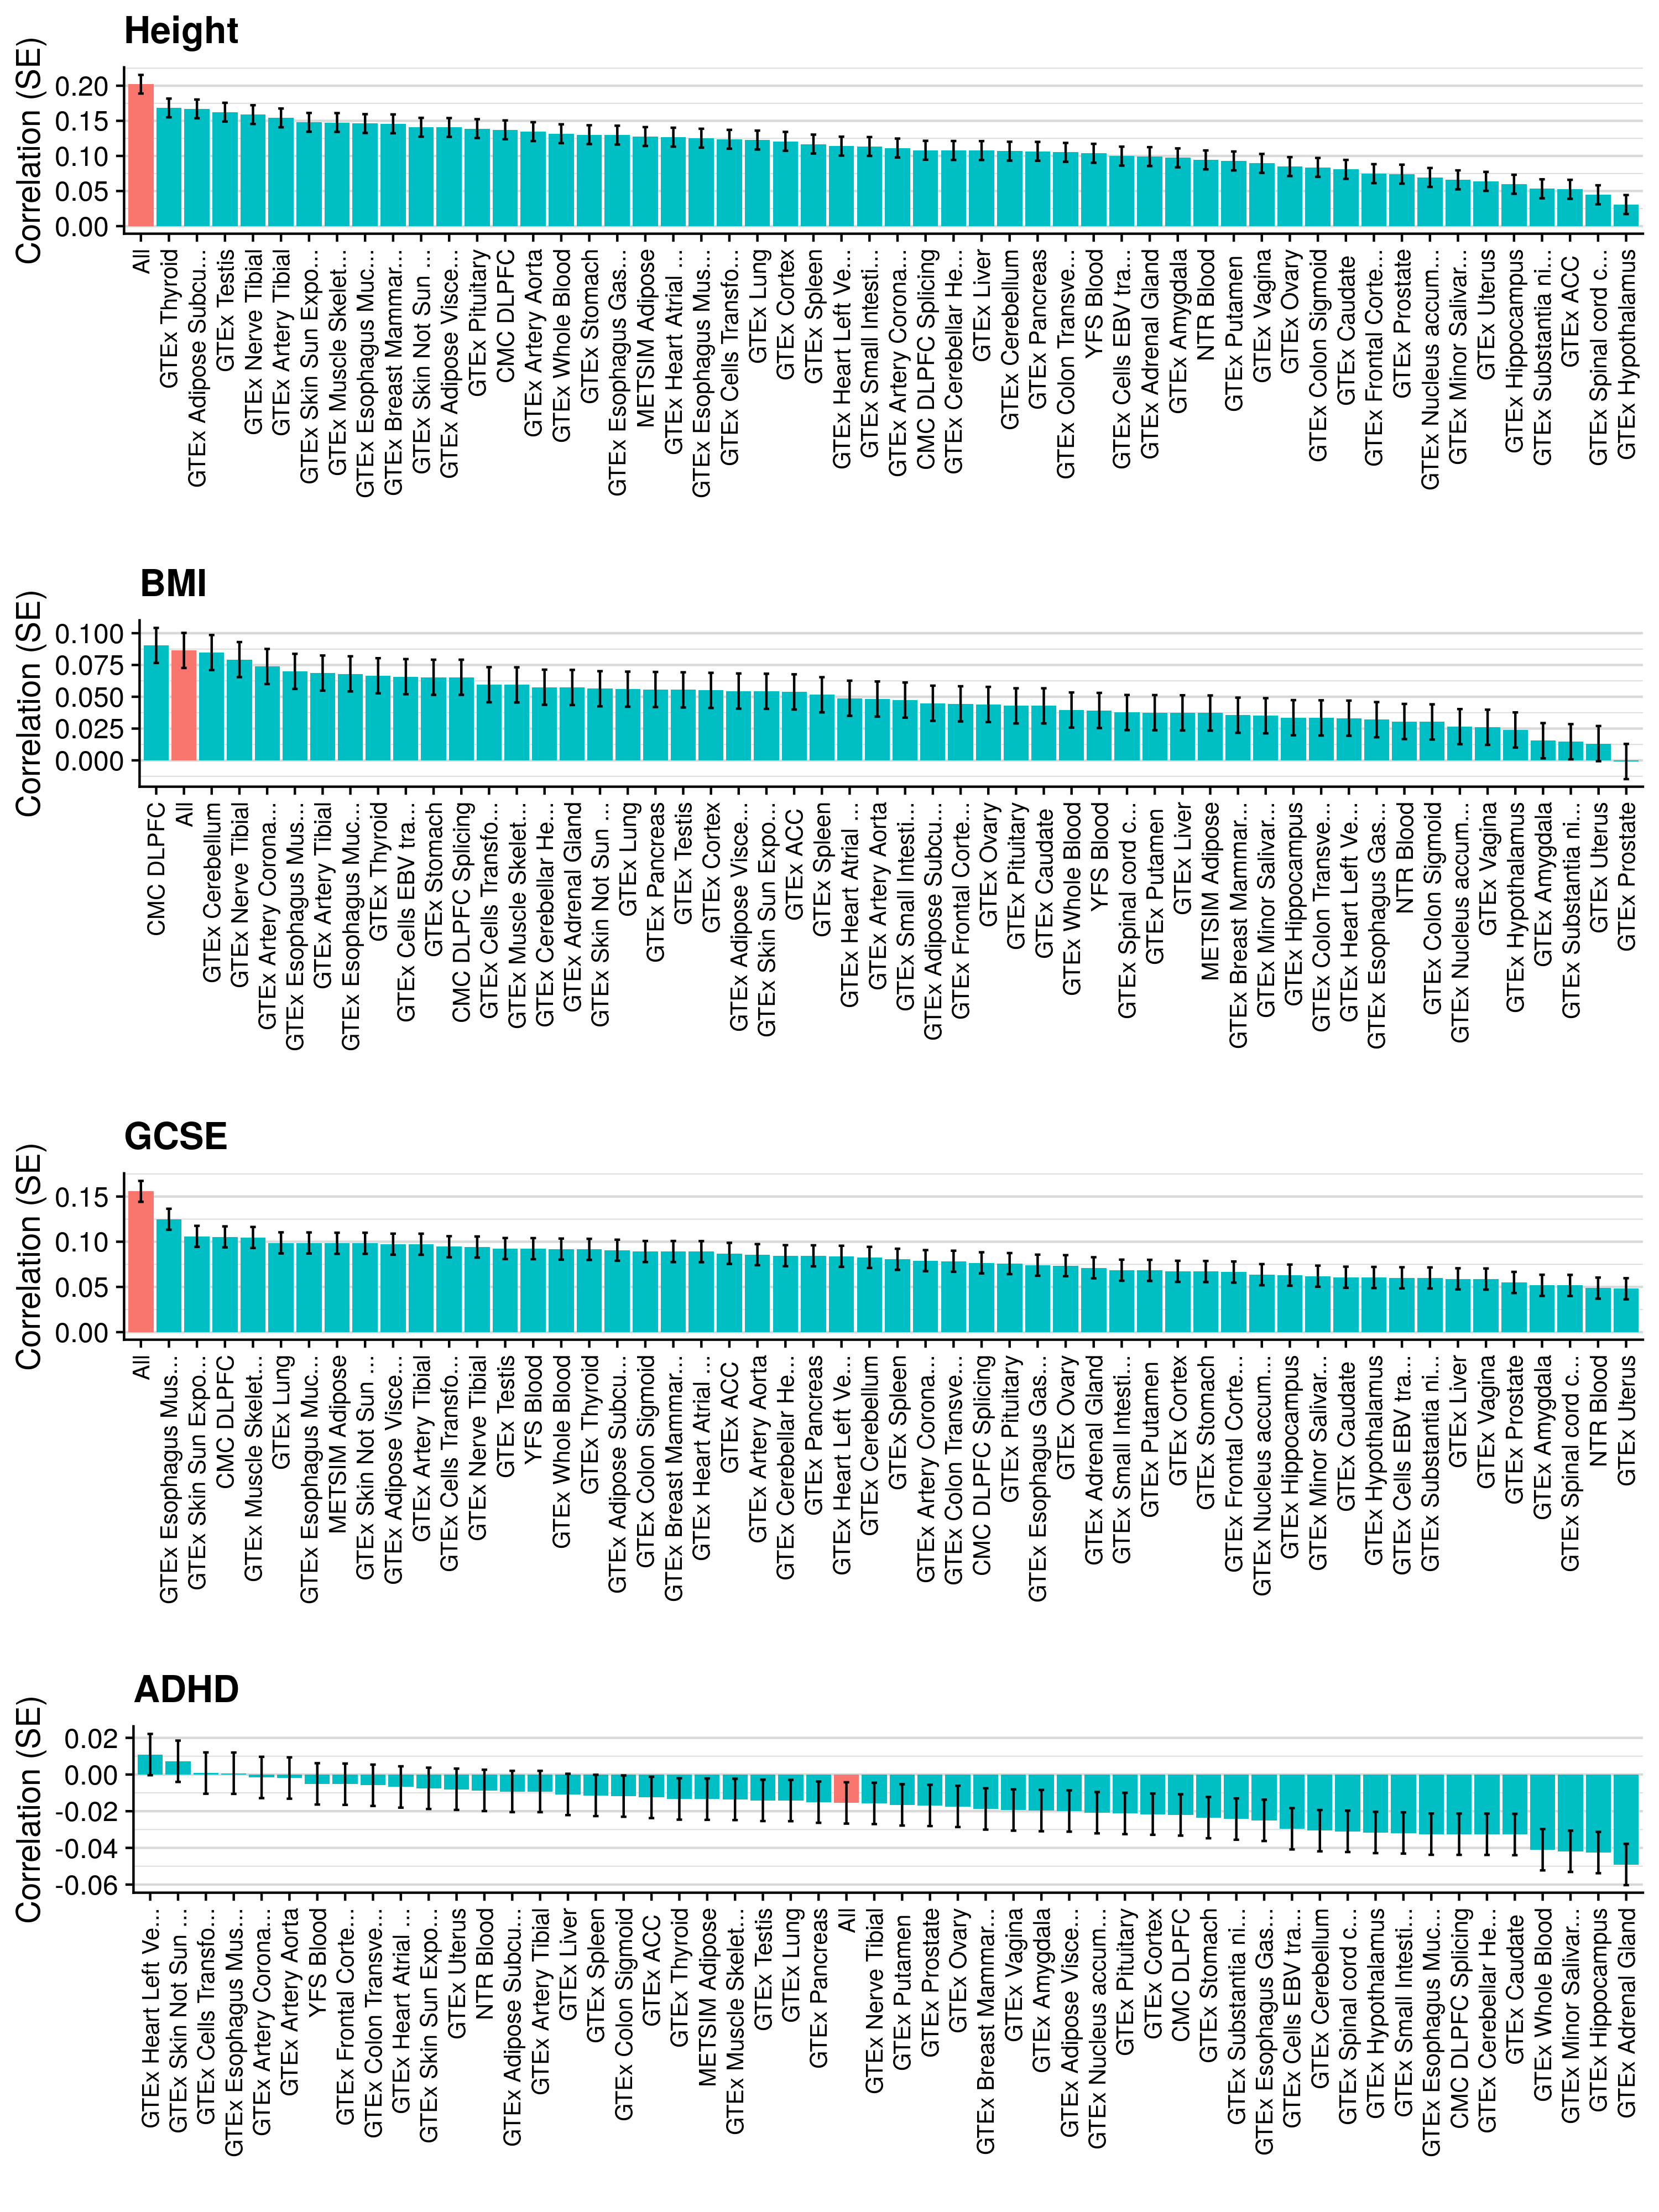
Predictive utility
Show association with GeRS TissueSpecific for each SNP-weight set
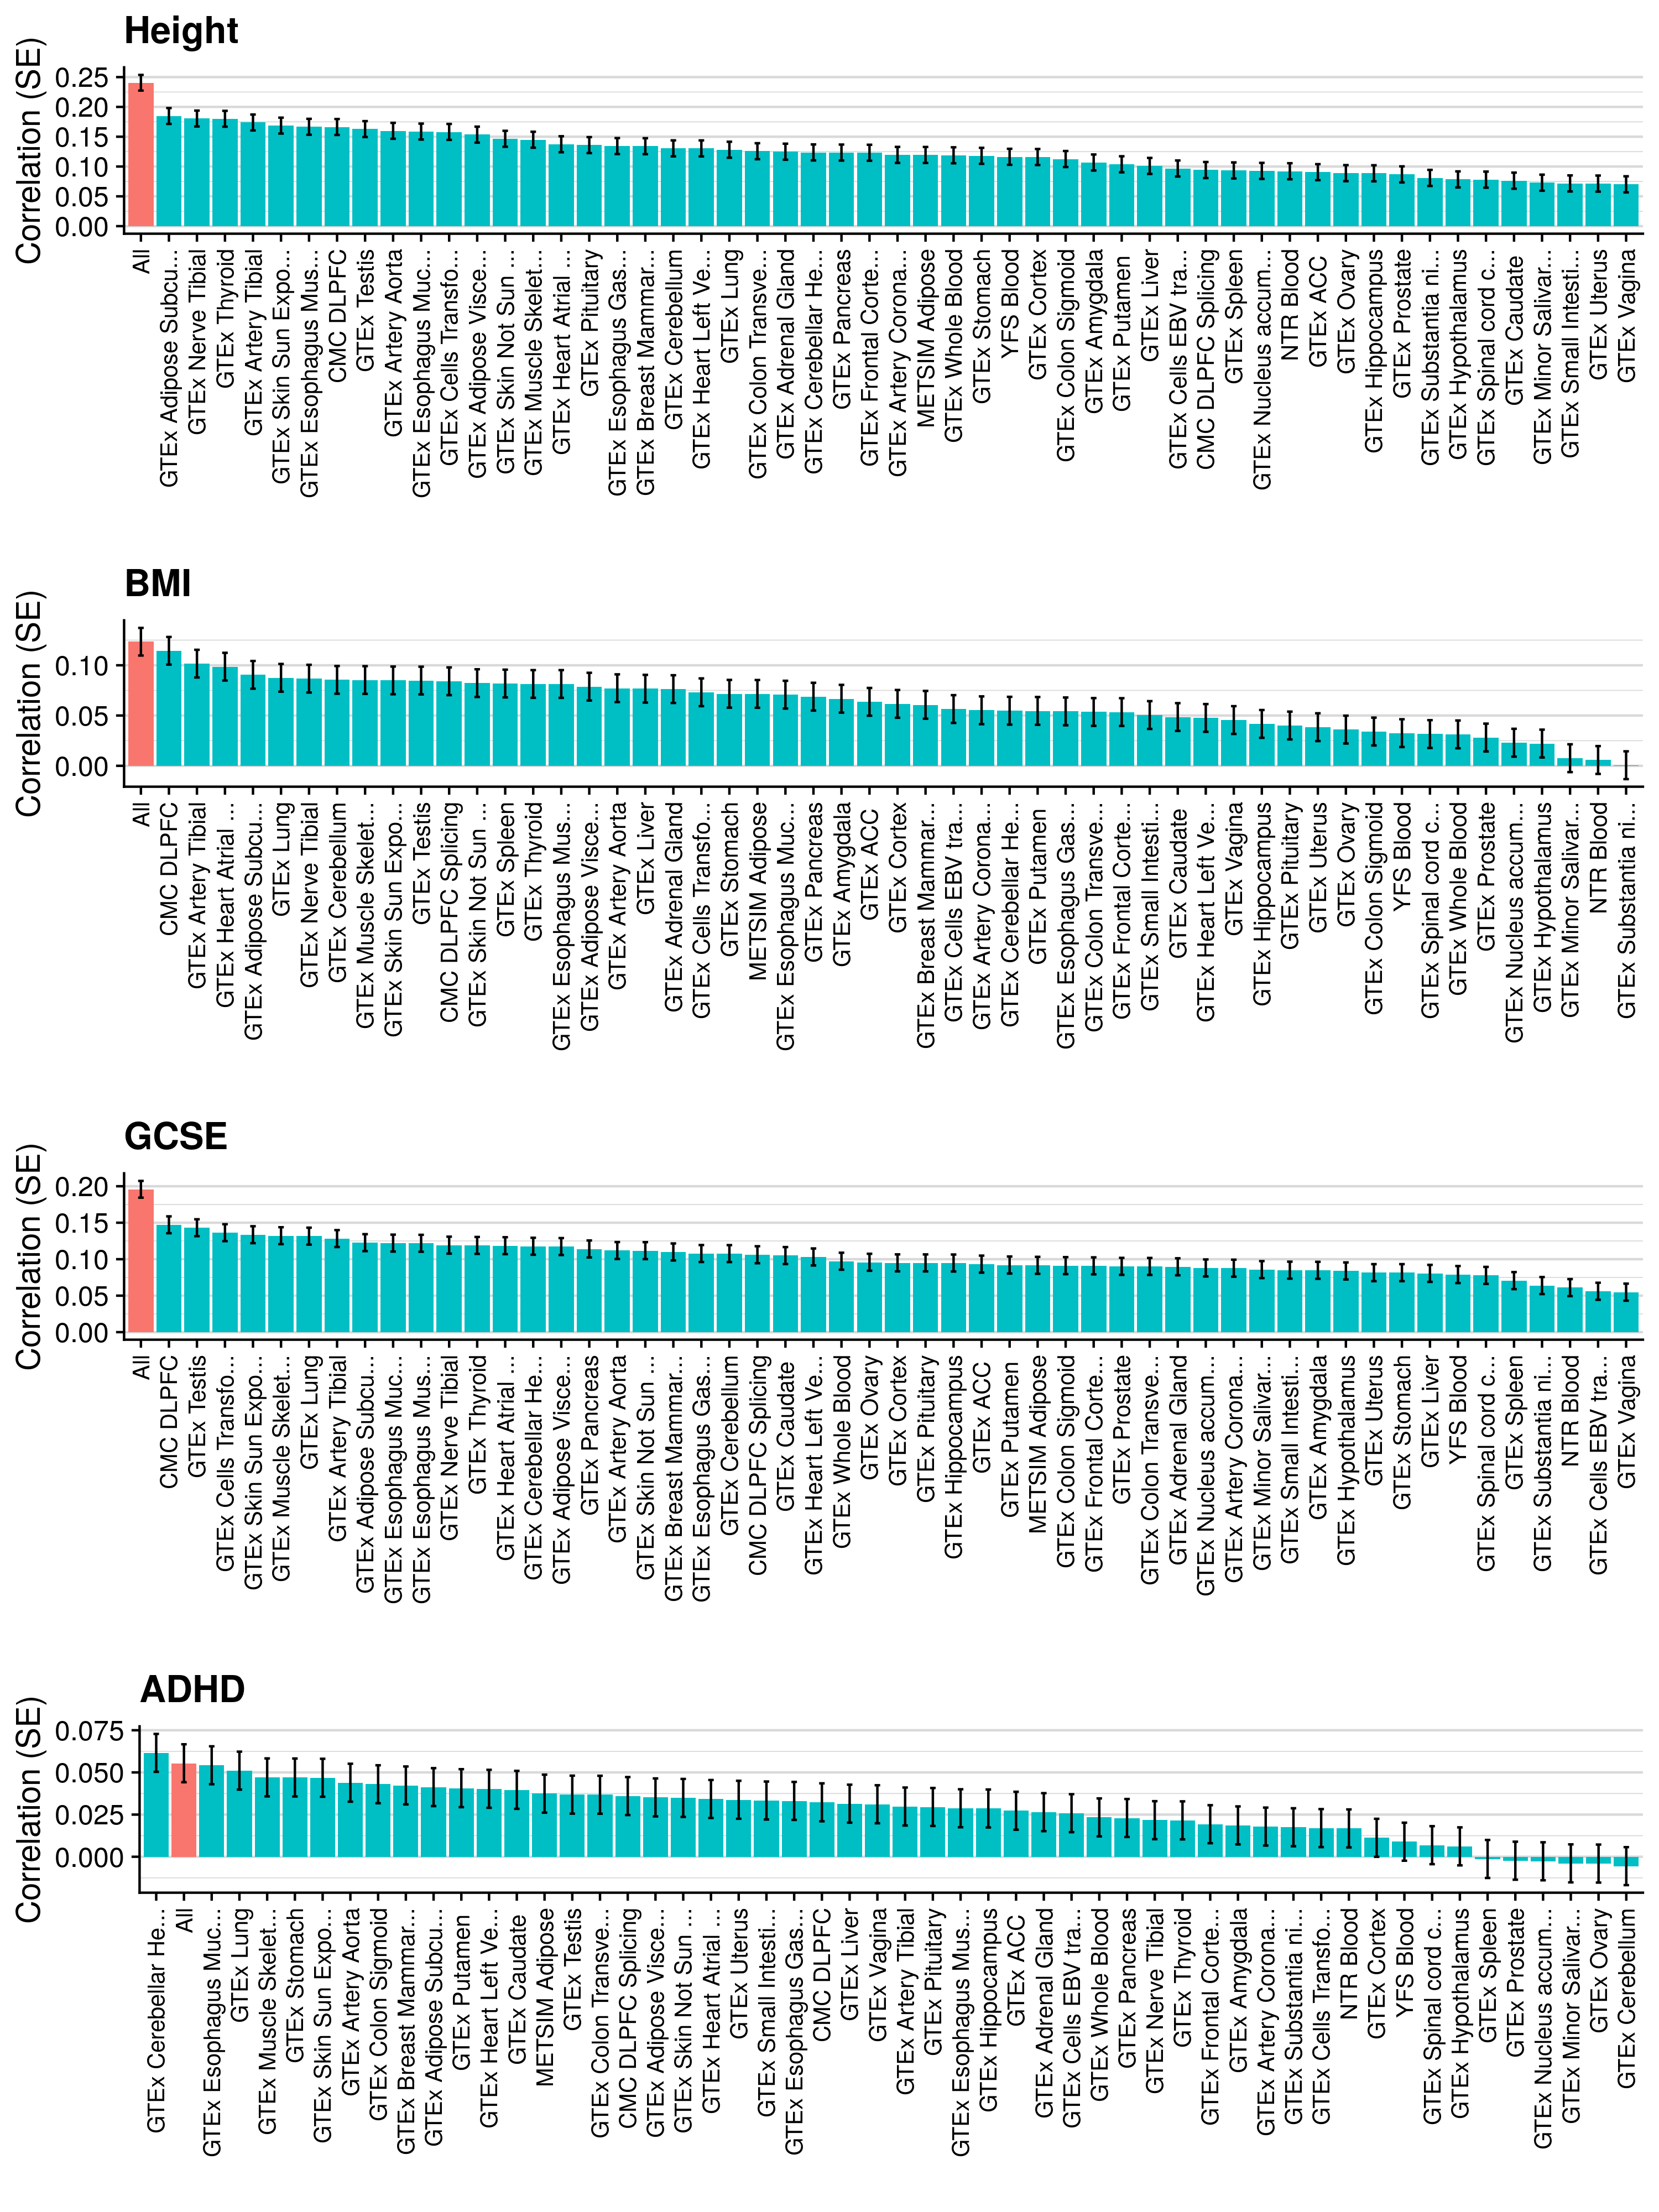
Predictive utility
Show association with GeRS for each SNP-weight set after accounting for number of features
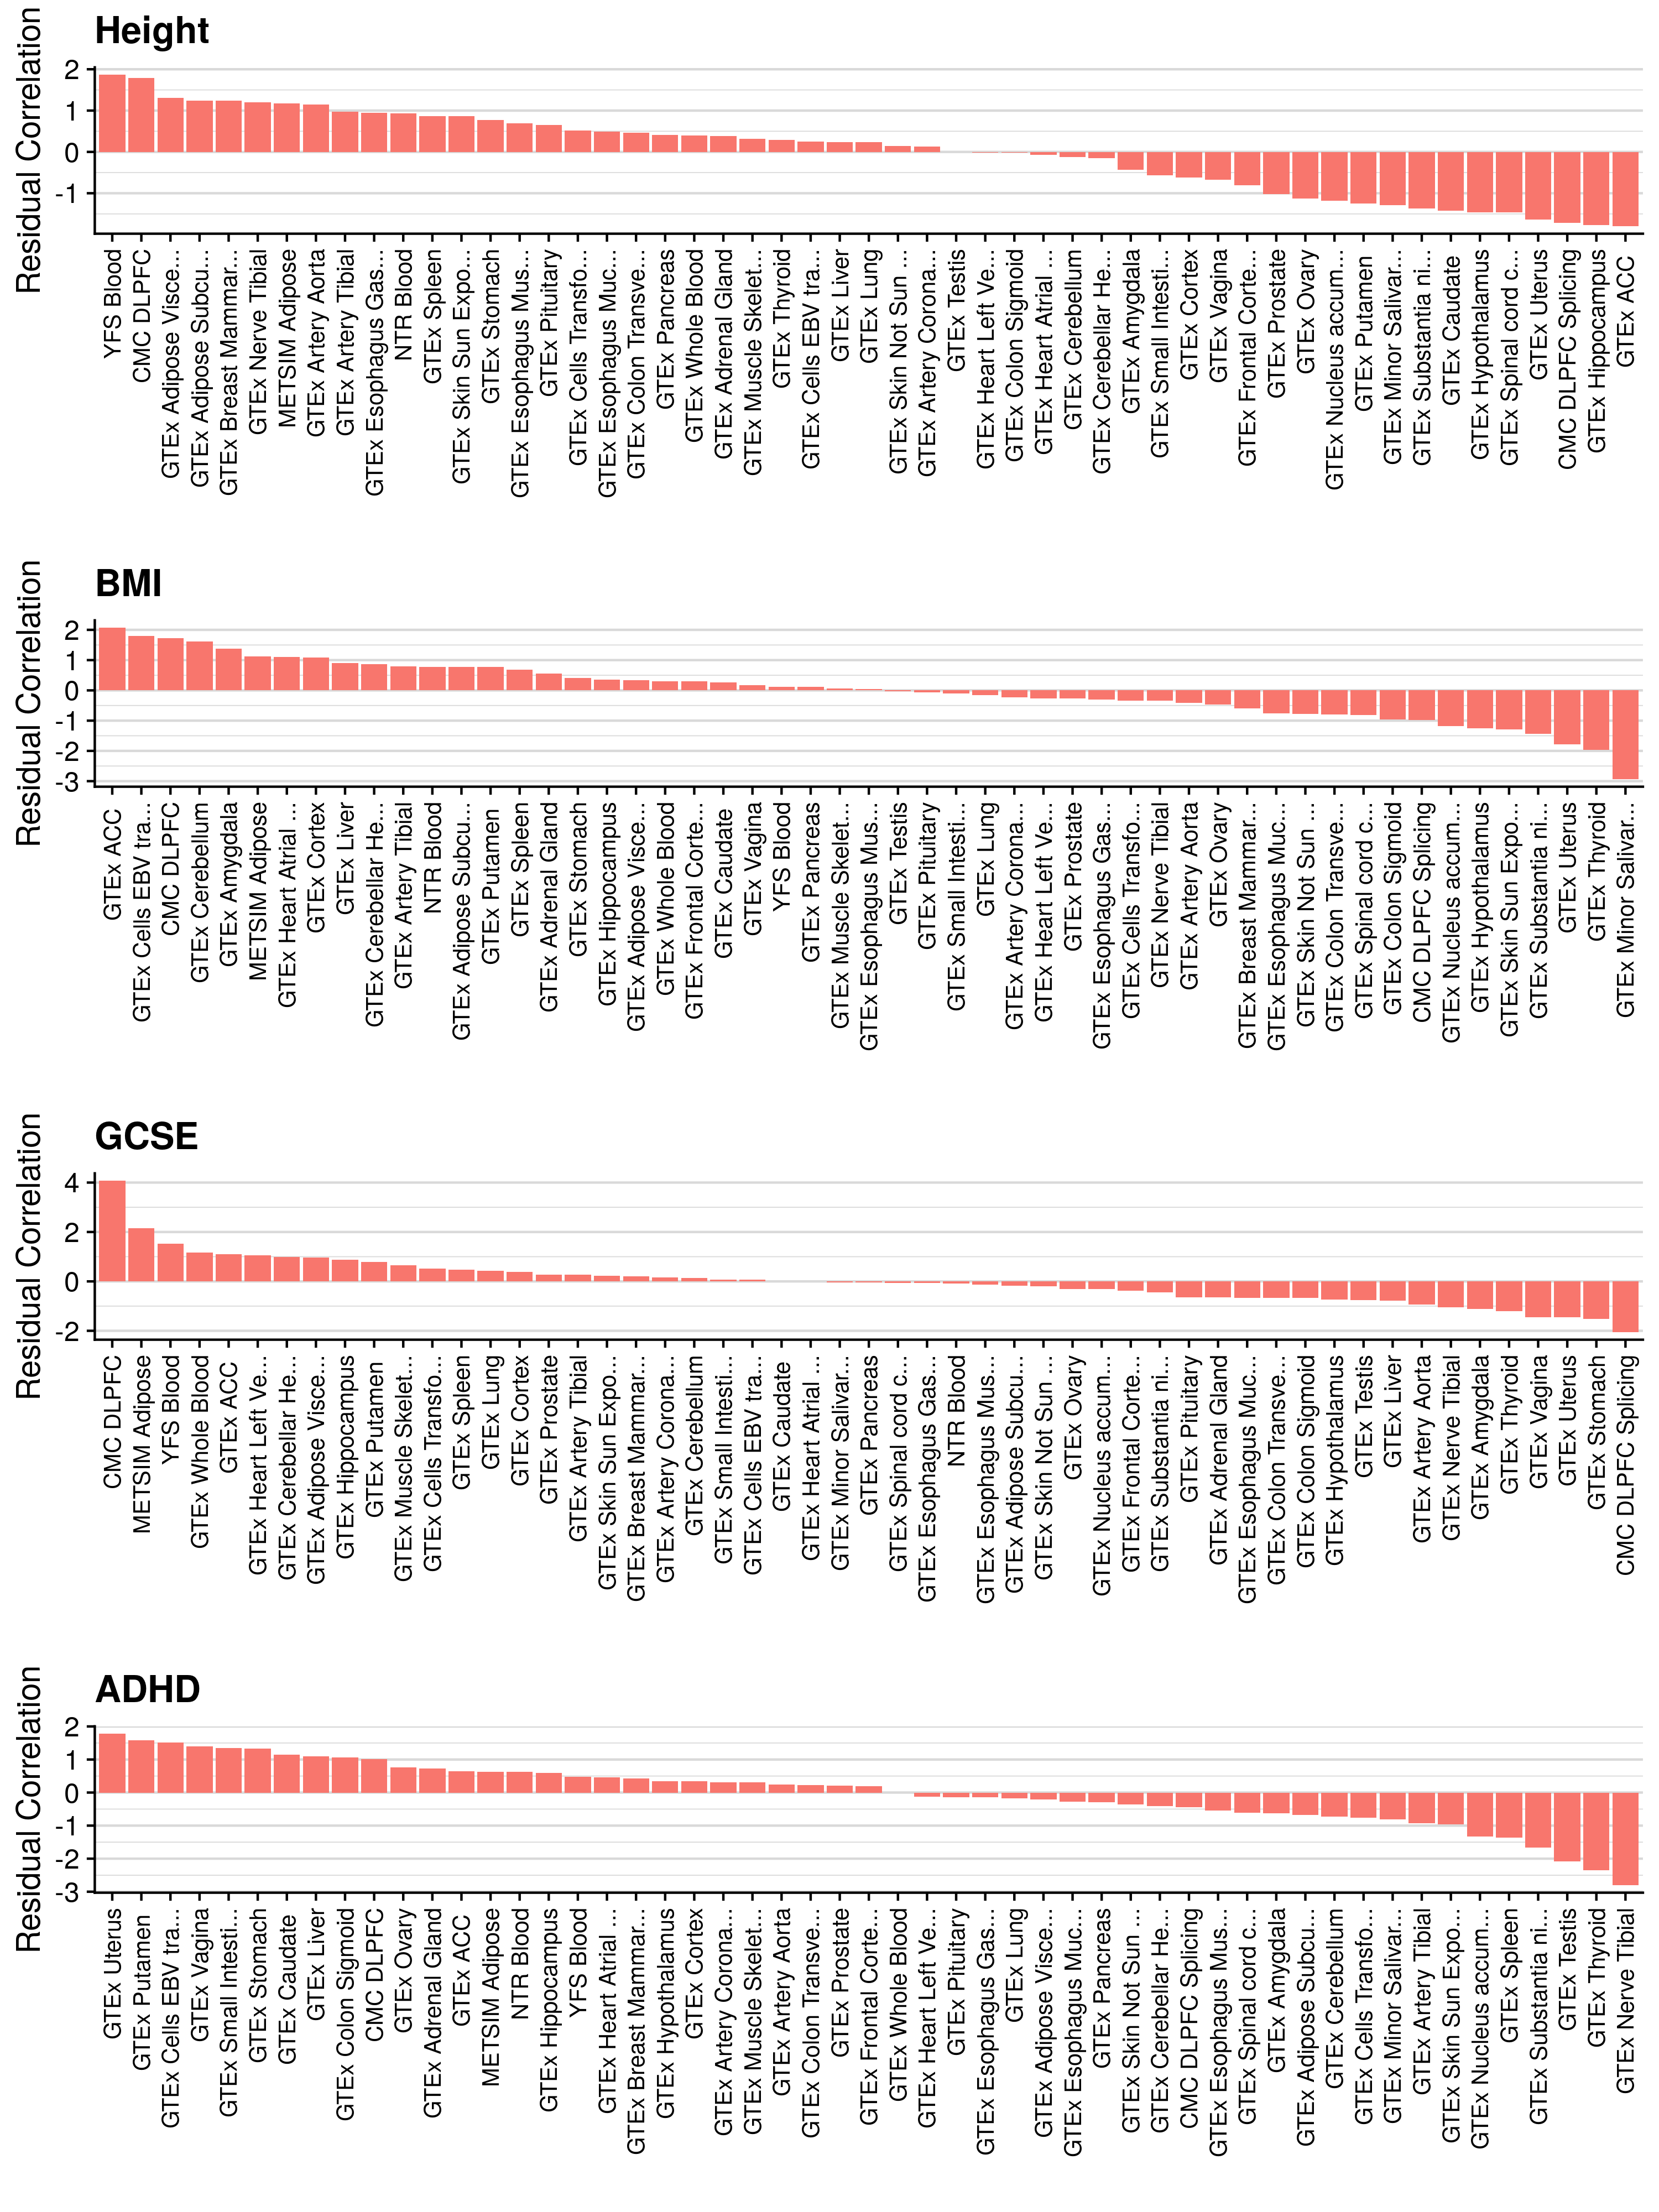
Predictive utility
Show effect of number of features in the SNP-weight set
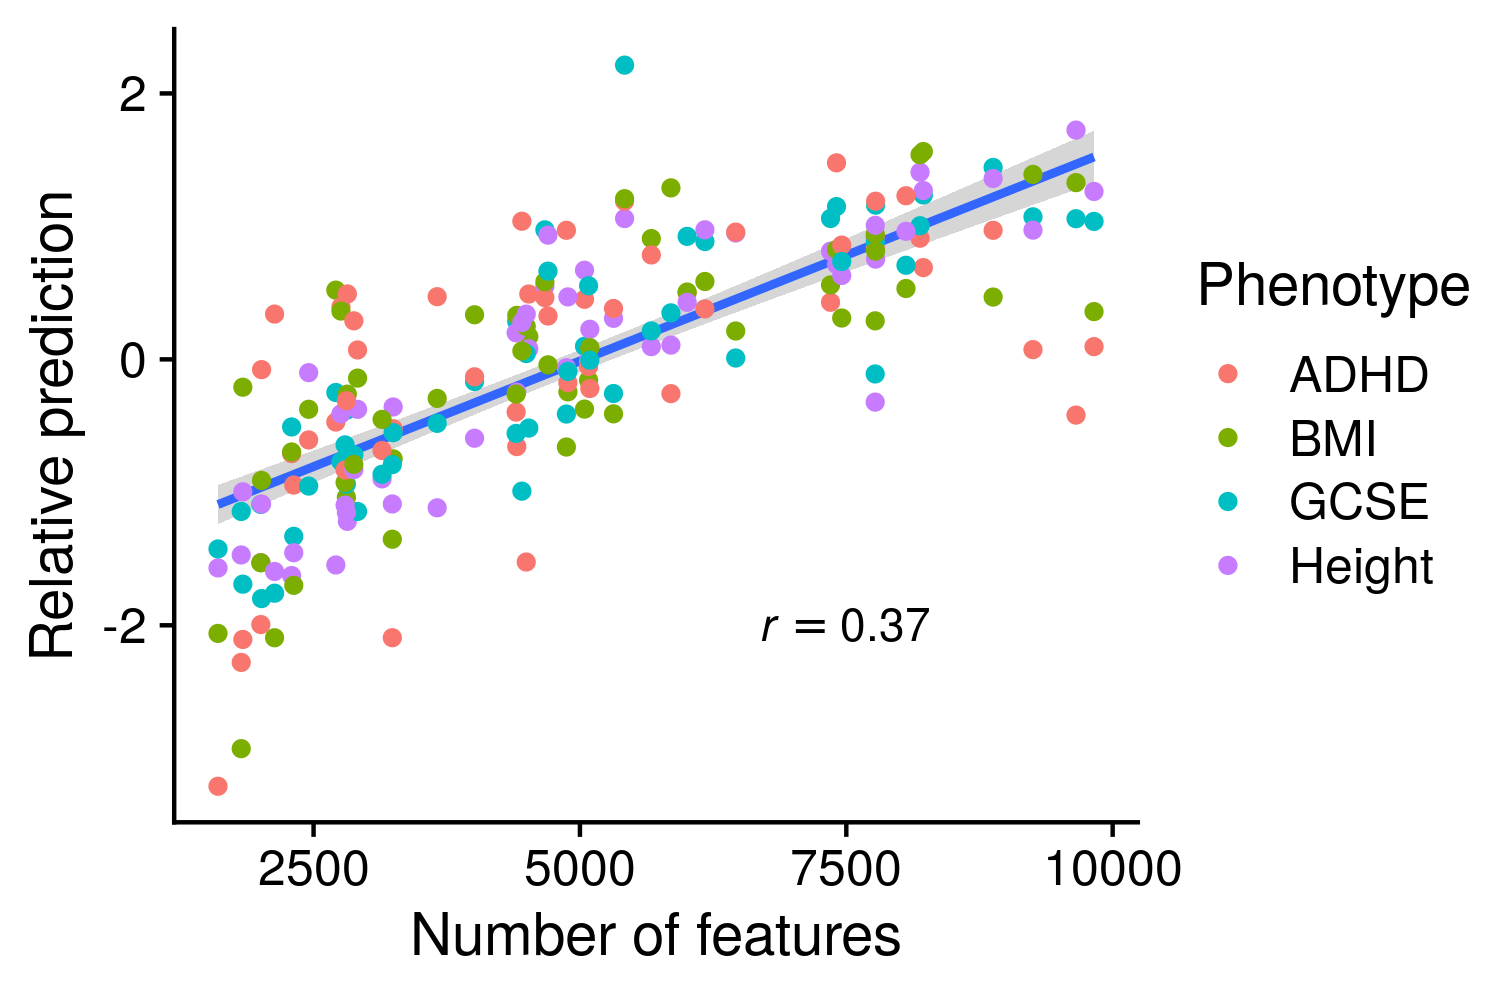
Number of feature effect
5 Conclusion
- Gene expression risk scores (GeRS) can explain a significantly non-zero amount of variance in a range of phenotypes
- The amount of variance explained by GeRS is less than explained by a genome-wide pT+clump polygenic score or TWAS SNP-weight stratified polygenic scores, except for Rheumatoid Arthritis.
- Use of elastic net models to combine GeRSs derived using multiple pTs does not significantly improve prediction over the single best pT as idenitified using 10-fold cross validation, though prediction never decreases
- Inclusion of GeRS based on SNP-weights derived using multiple tissues consistently improves prediction over the single best tissues as idenitified using 10-fold cross validation
- Inclusion of GeRSs only improved prediction over genome-wide polygenic scores for rheumatoid arthritis, providing an 1.6 times increase in r2 (0.021 to 0.035). Prediction improvements were non significant for all other phenotypes in UK Biobank and TEDS.
- However, PRScs polygenic scores which does not use LD clumping reduces the benefit of using GeRS for all outcomes, and the increase for RheumArth is no longer significant. This indicates the gain is in the fact that GeRS are based on joint SNP models.
- This findings suggest that GeRS represent a component of risk captured within genome-wide polygenic scores, rather than containing novel information.
- This indicates GeRS may be more useful for stratifying risk rather than improving risk prediction in a linear model.
- TWAS SNP PRS explain a suprisingly large amount of variance considering they only contain a fraction of the genome.